hi so we're going to start a new chapter and it's a doozy it's on phase diagrams and so we're going to be moving beyond the simple phase diagram that you see in physics 1:50 1151 solids like what gas type stuff and we're going to be moving into phase diagrams but also consider things like the percent composition of the material which kind of takes it up a notch so here's the typical phase diagram that you might see in physics 1150 1151 so let's remind ourselves of some of the terminology and things that are going on in
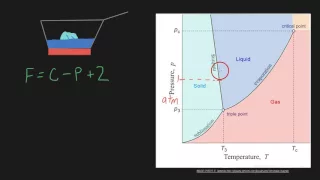
the state diagram so first of all this is the phase diagram for water okay so we know that at atmospheric pressure which is shown here at one atmosphere in the dashed line at zero degrees Celsius water freezes and that's a solid okay and then ask that viewer to green line it'll start to melt and eventually it will become totally water in the liquid state and then it will boil and about a hundred degrees Celsius depending on your altitude in the pressure but roughly a hundred degrees self DSO boil and then it will go from a
liquid to a gas and of course there's all these different lines on here that indicate the transition from one phase to another okay so you have your liquidus line and the liquidus line is the transition from the solid to the liquid and so that's shown here you have your lines indicating the transition from the liquid to the gas and then you have here the triple point now remember that all on the line while you're sitting on the line that the material can exist in both phases at once and so what happens is when water goes
from a solid to a liquid it takes energy to kind of heat it up and that q is equal to MC delta T kind of way that you learn about physics in physics 1150 and then once it reaches your degrees C it won't change temperature anymore until it's completely melted okay so it holds steady at that temperature and while it's holding steady at that temperature it will be in the process of melting and you'll have both solid and liquid while it holds at that temperature so that's kind of as represented here on the line it's
where the material can codes this and the two phases where all these lines intersect that's known is the triple point and the really fun thing about the triple point of water is of course it can be in all three phases at once solid liquid and gas all at the same time which is kind of fun so that's a little bit of a reminder of what's going on with material in these kinds of phase diagrams now there's another phase diagram that you might have looked at in some elementary chemistry classes are in high school or whatever
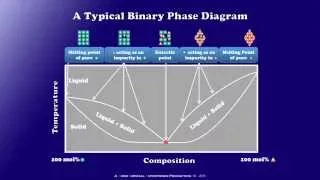
and that has to do with the percent composition of the material versus the temperature so instead of plotting pressure versus temperature for example as we saw in the water phase diagram then you can change the composition versus temperature so this phase diagram shown here is the sugar water phase diagram and so as you go along the bottom of this plot you're increasing the weight percentage of sugar in your sugar water solution okay so from this you're getting a mixture so there could be more than one phase going on for example here's your solubility limit that's
the solubility limit line that kind of arcing line on the last right hand third of the graph and what happens is that at a given temperature list to green temperature for example as you add sugar you can get the sugar to dissolve into the liquid phase up to a certain point up to a certain weight percentage and then pass that you're not going to be able to get the sugar to dissolve anymore it's going to stay in its solid state just as a precipitate for example on the bottom of your glass or bowl or whatever
so the limit the weight percentage limit for that is indicated by the line and if you go across to the intersection at twenty degrees Celsius you can see that that intersection happens at about 65 weight percent for the sugar water solution so what can happen is let's say that you heat your solution up to say eighty or ninety degrees C okay well now if you're at 80 Griese you can see that your limit is a higher weight percentage okay so you could mix more sugar in so let's say that you go up to 80 degree
C you make more sugar in but then you cool it off and as you cool it off some of that sugar that you got to successfully dissolve at 80 degrees C is going to precipitate out into little crystals on the bottom of your glass so that's kind of what's going on with that kind of phase diagram so basically you're in a situation where if you alter your temperature you can change the number of phases so for example if you go from A to B a year and you're starting at a temperature of say 20 degrees
Celsius with 70 waitperson of sugar and you've got two phases you've got your liquid and your solid persistence and then if you go up then you cross that line you've heated it up and then some of that sugar that precipitated out of the solution will dissolve in to the liquid state okay so that changes the number of phases from two to one now if you add more sugar and you go from B to D then you're going to go from the liquid state to a liquid in a solid state where that sugar just won't dissolve
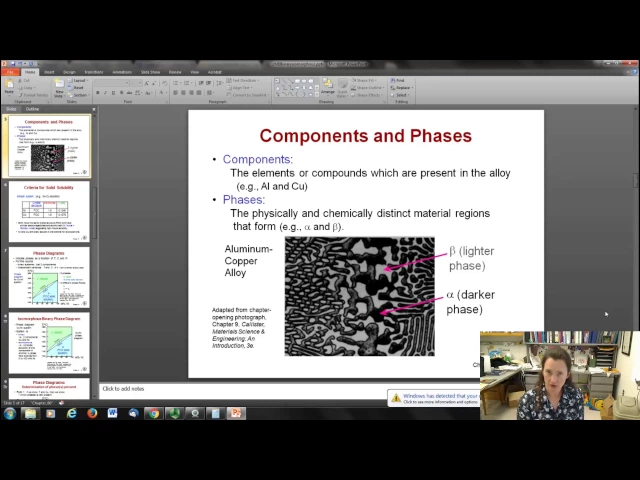
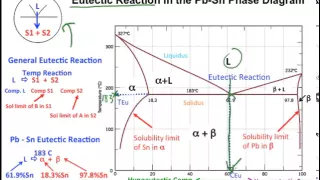
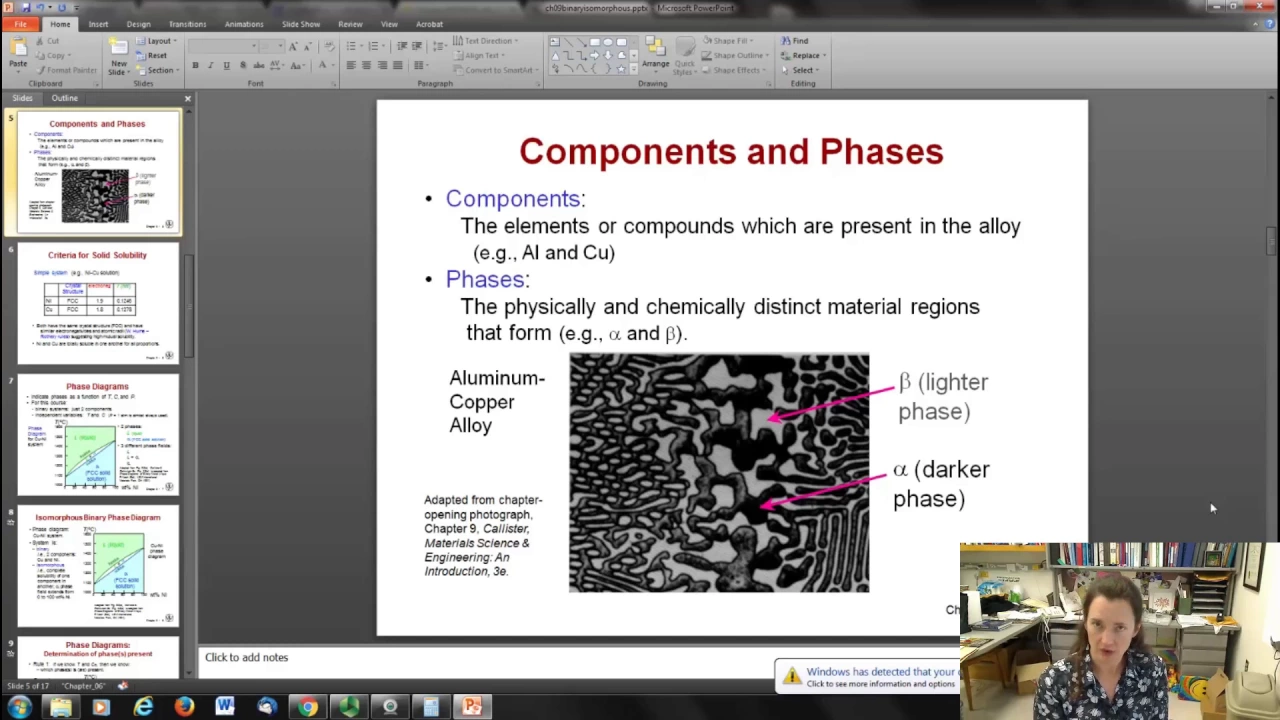
in any more so that's kind of what's going on there now I wish I could say that all of the phase diagrams material science whereas happy smiley as that but what happens in materials science is that you get more than one kind of solid phase and they can actually have different structures so for example this is an image of aluminum and copper formed in an alloy and you can see here that it's kind of a cool looking picture actually that there's two different phases present one of the phases shows up as darker than the other
so the alpha phase actually is has a dark color to it and the beta phase is a lighter color and this is I believe from an SEM image paying electron microscope image is a two phases okay so those two phases they're both solids but they're physically and chemically distinct regions that form okay so they might have different crystalline structures and they also are different chemically they have chemical compositions perhaps one of them for example probably the copper nowadays copper is copper rich and then the beta phase has more aluminum ok so it's a lighter density
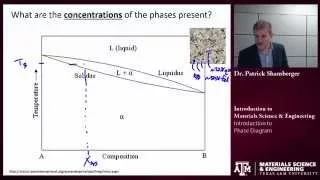
phase as well alright but before we embark on the really super fun really super fun phase diagrams if you can get into it material science let's start off with the simplest system possible so you can get used to looking at them and so you can learn how to do some of the techniques for analysis so the simplest thing that you can do in material science is to have a system with two components like nickel and copper that are completely soluble in one another all right now they both have the same crystalline structure they're both FCC
and they have similar electronegativities and atomic radii so you might remember the Hume Rothery rules that we covered in a previous lecture so these two things have very high mutual solubility all right so they're totally soluble in one another for all proportions which is awesome and as we'll see really unusual actually so if you look at the copper nickel phase diagram on what you can do is you can indicate the phases as a function of temperature composition and pressure you can you can plot the pressure - like we did for the water phase diagram but
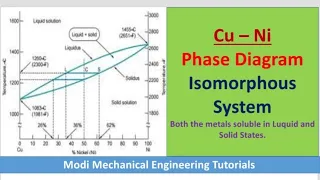
for this course those can get kind of complicated and complex so for this course we're just going to look at binary systems with two components like copper nickel and we're going to only examine the independent variables variables of temperature and percent composition and we're just going to hold the pressure at one atmosphere which is what the standard kind of is for comparison anyway sense where it went off you're here okay so if we did that for copper nickel then this is what the phase diagram looks like you can see the liquid portion is in green
and the solid portion is in blue and we're going to call the solid phase here the alpha phase okay so this is the Alpha solid phase and it's an FCC solid solution on the bottom of the graph is plotted the percent change in weight percent of nickel so you start all the way here on the left hand side where you've got all copper and then as you increase your weight percentage you end up eventually on the right-hand side where you have pure nickel okay now the temperature increases here we just zoomed in on the high
temperature near the melting point for these percentages because of course below that below a thousand degrees C of course it's a solid and above where it goes where nickel melts of course it's a liquid okay so there you go now you can see if you look at the phase diagram that copper and nickel have different melting points okay if you're over here on the left hand side at zero way percent nickel then that's the melting point of copper okay and if you're over here on the right hand side at 100% nickel and you read it
off that's the melting point of nickel okay but you can see that in the intermediate region here because the copper and the nickel do have different melting points then you're going to get a region in between your liquidus and your solidus lines where you have a mixed phase where you have some liquid and some alpha phase material and this is because copper and nickel or different materials and they don't have the same melting point so you're going to get this region where you've got a mix of liquid and solid as one catches up to the
other that makes sense okay so liquid phase alpha phase solid phase liquid plus alpha phase is some mixed of liquid plus salt alright this is called an isomorphous binary phase diagram okay it's binary because it's got two components copper and nickel it's isomorphous because you have complete solubility of one component in the other okay complete completely soluble means isomorphous so this is an isomorphous binary phase diagram okay so here's how to read these suckers rule number one if you know the temperature and the percent composition then you know which phases are present okay so for
example if we go to point A and we know that we've got 60 weight percent nickel at a temperature of 1100 degrees C that I can figure out what phase on that okay and that phase is of course the FCC solid solution the alpha phase all right now if I have a thirty five percent nickel solution at twelve hundred and fifty degree stage then I can go and I can see what my face is and at that point I'm in the middle here and I have a liquid plus an alpha phase so it's a mix
of liquid and solid there so I can easily read these off that's not a problem rule number two if I know the temperature and the percent composition then I can determine the composition of each phase okay all right now this is a little more complex let's do the easy ones first let's go to point a up here in the liquid region okay it's on that point H then I'm at thirty five weight percent nickel okay so I have 35 weight percent nickel and I have only the liquid phase present at thirteen hundred and twenty degrees
C so my liquid is my whole phase and it's thirty five percent nickel I'm done okay now let's go to another easy one let's say I'm still at 35 percent nickel but now I'm at the temperature of eleven hundred and ninety degrees C that something down here in this solid region okay so I've got only solid present it's only alpha phase and it's 35 wavers and nickel okay so that's what it is um so that's pretty straightforward but now let's go to this region C okay in the liquid plus alpha phase region so I know
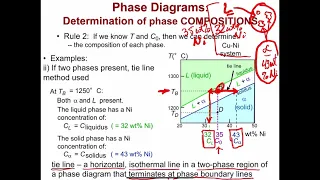
I have alpha phase and liquid phase now what I'm going to do is I'm going to construct what's called a tie line and the tie line is a horizontal straight flat line on this graph it's also sometimes called an isotherm and I'm going to look at the intersection of my tie line with my liquidus line here which defines the boundary between the liquid and the liquid plus alpha phase and my solidus line over here which defines the boundary between my liquid plus alpha phase and my alpha phase okay now I'm going to read off what
the concentrations are at the intersection of the time line with the liquidus line and the solidus line and from that I can extract some information so the concentration of my liquidus phase is if I go over and look at the intersection with my liquidus line and I drop down and see what the concentration percentage is at that intersection point then I see it's about 32 okay so that means that the concentration of my liquid phase in this liquid plus alpha region at this very specific temperature is 32 weight percent nickel okay now if I go
across and looked at the intersection of my time line with my solidus line then I can see that it intersects at a concentration of 43 percent okay what that means is that the alpha phase that's present there has a concentration of 43 weight percent nickel okay now if you think about it this kind of makes sense all right so we have a phase diagram that shows us that the melting point of copper is lower than the melting point of nickel so if you're in this region okay if you're in this middle region and then you
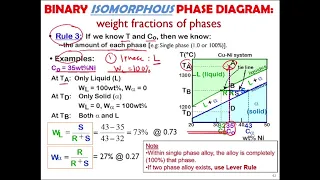
know that you've probably had more copper melt than nickel okay so that means that the weight percentage in your liquid phase is going to be lower right for nickel because it hasn't melted as much yet and the weight percentage for my solid phase is going to be higher for nickel because nickel has a higher melting point does that make sense hopefully it does now you can get even more information rule number three if you know the temperature and the percent composition then you can determine the weight fraction of each phase okay so let's go back
to our friends a thirty-five weight percent nickel and look at its timeline there at that temperature that we already looked at so um well so let's start with temperature a first at temperature a I've got 35 weight percent nickel I've got 100 percent liquid that's pretty straightforward at temperature D done here I've got only solid phase so it's 100 percent days and 35 weigh percent nickel but now talk about here to the middle at temperature be but I know I've got alpha phase and my liquid phase present I've got my time line my tie line
intersects at 32 weight percent on one side and 43 weight percent on the other but I'm sitting right here at 35 weight percent so I know that I can figure out what weight percentage of liquid I have in that liquid flip out the phase and what weight percentage of alpha phase I have in that liquid plus alpha phase so I can tell you not just that I have alpha phase and liquid phase but what weight percentages those two things are I can do that by using my tie line and what's known as the lever rule
shown here okay so the tie line connecting the two also called an isotherm what you can do is you can look at the relative weights of the liquid versus the alpha phase based on the tie line so if you want to calculate the weight percentage of the liquid in that liquid plus alpha phase then you look at what concentration you're at you're at 35 percent and then you compare the relative length of your tie line before it intersects the liquidus and solidus line you can compare the relative lengths of that and get a weight percentage
out of it so let's look at our timeline if we consider our to be the distance on our tie line from the intersection of the liquidus line to the concentration that we're at and we consider s to be the length of our tie line from the weight percentage that we're at 35 percent to the intersection with the solidus line then I can find the weight of the liquid phase by the calculation s over R plus s okay s I can find by looking at the concentration at the intersection with the solid line C alpha minus
the concentration that I'm at which is 35 percent and then I divide that by the total length of my tie line running from the liquidus to the solidus line which is the concentration at that alpha phase intersection minus the concentration at the liquidus line intersection okay now I can do the same thing if I want the concentration of my alpha phase instead of s over R plus s I do r over r plus alright spending sense okay so I can I can figure that out now from this slide it was all constructed here breaking it
down but if I run through the calculation for the weight of my liquidus phase I get S which is 43 minus 35 divided by R + S which is 43-32 and I see that I've got 0.73 or 73% liquid okay at that point and that kind of makes sense that I would have a higher percentage of liquid at that point because I'm really closer to the liquidus line than I am to the solidus line okay so it makes sense that I have more liquid than solid and of course if I have 73 percent liquids that
I've got 27 percent solid but if I wanted to verify that I could just do R over R + S which would be you know 35 minus 32 / 43-32 and I would get point 3 7 all right I hope that's relatively clear okay so what happens is let's look at what happens in a vertical line so we're holding constant at 35 weight percent nickel and we start out in the liquid phase and then we slowly cool it down and watch what happens okay so I'm up here I'm very far away from the liquidus line
and I'm at 35 wait percent nickel and now I start to cool it down kind of slowly when I reach my liquidus line okay then I get the formation of some little solid phase particles okay that's indicated in this little cartoon over here in this cartoon is the liquid is shown in green and a solid alpha phase is shown in blue so it's B I'm starting to see these little tiny alpha phase solid particles forming now given where the thing is okay if I construct a tie line here and look at the intersection on either
side I've got 35 weight percent nickel for my for my liquid phase and then for my alpha phase if I go across here and draw my Thailand can start to go to the other side that I've got 46 weight percent of nickel so because my nickel has a higher melting point the nickel is going to preferentially become a solid first okay it's going to preferentially become a solid first and so these little particles are going to be very nickel rich compared to the bulk concentration of the liquid which is 35% okay now let's say that
I drop down a little further well if I look at what my tie line looks like here okay I've cooled down more now if I can start my time line my liquid phase is 32 percent nickels and my solid phase is 43 percent nickel and as I go further and further down I see the weight percentage of the nickel drop until when I reached the solid region it's 35% again okay all right now what does that mean really well if you cool it down an equilibrium equilibrium kind of way not much basically what will happen
is if you do it slowly enough your copper and nickel diffuse and move around and you'll have a homogeneous mixture by the time you get down into the solid phase temperatures and it will be 35 weight percent nickel no matter where you are okay so that's at a very slow rate of cooling though that you get those equilibrium structures any time you hear the word equilibrium in any sort of thermodynamics class you should think slow painfully painfully slow that's what equilibrium really means okay it things have been given time to equilibrates now this is also
rare because in a real manufacturing facility or any kind of thing like that people are not that patient they want results that got money they got deadlines and so things usually aren't at equilibrium type condition okay so what happens when you're not in an equilibrium condition is it the diffusion of the copper and nickel moving around it doesn't have time to happen okay and so when it starts to cool in the very core when the nuclei is first formed you've got a very nickel rich phase and then as you move word then you're going to
decrease the percentage of nickel as you move outward so a lot of these regions you're going to see a nickel rich phase on the inside and then sort of a cored shell structure where the percentage nickel drops off as as you cool it down and then the solid phase moves away from the nucleation site okay so what kinds of homework questions can possibly be asked about this alright here's here's an example problem is it possible to have a copper nickel alloy that at equilibrium consists of an alpha JS a 37% nickel and also a liquid
phase of 20% nickel and if so what temperature is that alloy at and if not what's the maximum percentage of nickel in the alpha phase that it's possible for a liquid phase of 20% nickel ok so here we go it's not possible all right I've shown you why here I've got this diagram back up and I've constructed a couple of hot lines for you so the first is I constructed a tie line a horizontal line that intersected the solidus line at a weight percent of 37% nickel so that's this top guy right here so it's
intersecting at about 37 percent nickel right there and you can see that so that would mean that the alpha phase would be 37% nickels but if you go across to where it intersects the liquidus line then you can see that the best it can do is say about 27% nickel in the liquidus phase so you're not going to get it okay now if instead you construct a tie line that intersects the liquidus line at 20% that's about right there okay then it's going to intersect your solidus line at about 30% okay so the highest concentration
of nickel that you'll get in your alpha phase is about 30% so it's not possible and instead the highest percentage is intricate in the alpha phase is about 30% for the 20% liquidus concentration okay now as you change the percentage of weight percent of nickel in this copper nickel system then it's going to affect various things it's going to affect the tensile strength most dramatically and also the doct ility remember what we said in previous chapters about how solid solutions are affected by by the addition of these dopant atoms so what happens is when you
put in a dopant material like let's say that you're adding nickel to copper then those things those those atoms can act as barriers to the motion of slip and dislocation okay so the dislocation can't move through once it hits that dopant atom it acts as a barrier and so what you're going to see is that as you increase your weight percentage for nickel your tensile strength is going to increase okay now it'll do that up to a threshold value and it's going to depend on what materials are what materials you're looking at as to what
the maximum maximum is and what the composition is when that happens but here we're peaking at about sixty weight percent nickel what happens in is your tensile strength starts to go down okay well what's happening then is you've become instead of a mostly copper with nickel docents you've become basically Nichols with copper dopants okay so this is your maximum here and now you're increasing until you really are a nickel matrix and not copper matrix anymore so you're going to get a peak value for your tensile strength okay all right now of course the ductility goes
as sort of the inverse of the tensile strength so stronger something is the less ductile it is we talked about that and so you're going to see the ductility bottoming out when the tensile strength Peaks okay all right I hope that's interesting and if you have any questions you probably will then see if you come see me and I'll see you in class