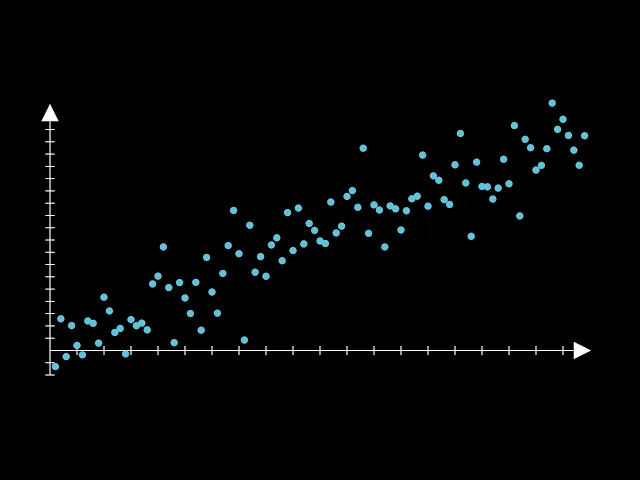
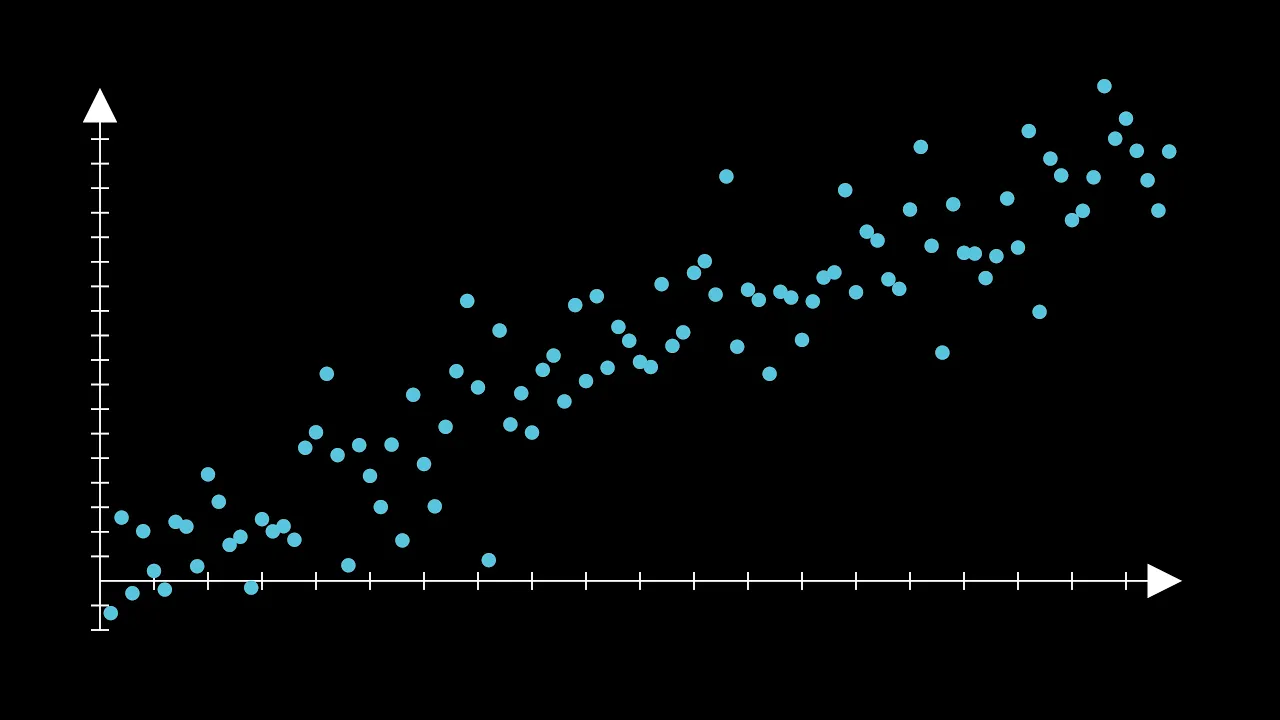
foreign [Laughter] we are going to learn how to create a scatter plot in mannum we will create an animated version as well as a non-animated version let's start with the latter first the non-animated version is going to Output this and I will walk through this code we have this beautiful scatter plot and we are using the axis class manum to create it so let me walk through what that looks like so first up we are going to bring in this data stored here on GitHub so we have two columns of data and I am just going to bring this in using pandas so I'm going to import pandas import all my manum objects I'm going to use this this OS library to run the command line later but I'm going to pull this data directly from GitHub read it as a CSV and then we'll come back to using it later I'm going to add the axes first so this is going to create an X and Y axes from where the x-axis is going to be from 0 through 100 and it's going to have tick marks and increments of five the y-axis is going to have a range of negative 20 to 200 with tick increments of 10. I'm going to add that axis to my to my to my manam scene which by the way that's what this this whole class is extending it's extending the scene class and I put everything that is initialized all of the work in the construct function which overrides that method in the scene and then I'm going to iterate each of the dots so I'm going to iterate each of those dots in the data frame I'm going to access them as as values in a numpy array and I will call the axis c2p so that's the coordinate to point this will convert the a given point that exists on that coordinate system to a point on the entire screen so it's a very handy method to to easily to easily convert a coin relative to the axes to the point relative to the screen and then we can add it accordingly so the first argument for the dot is going to be the location that we want the dot to be which we will get from that conversion of X and Y and I'm going to make this dot blue and then I will add the Dot finally I'm going to execute that scene uh by calling this command line argument taking the making a high quality I'm going to suppress some warnings disable it caching and I'm going to out plot into the scatterplot scene. png use this given file which I called scratchpad.
py and this is going to be the scatter plot scene so let's run this and there we go we now have the scene now I want to animate this a little bit what does that look like now there's a lot of different animations I could use to initialize this scatter plot but what I'm going to do is I am going to call self. play and take the axes pass it to the right animation then I'm going to pause for one second by calling self. weight you could put an argument away for more than one second if you want and then we are going to create all of the dots by iterating all the values put them in a list and then we're going to call lagged start this will create a nice pleasant effect where the dots don't come in all at once but they will kind of fall in one at a time with the lag ratio of 0.