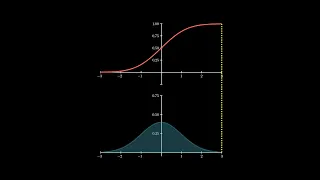
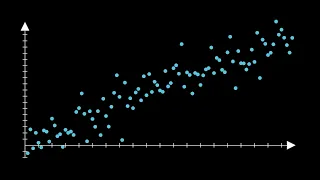
[Music] foreign [Music] Code walkthrough I am going to show you how to build these animations that I am showing you right now I use these animations for a YouTube video I made about a week or so ago demonstrating the normal distribution as well as its PDF CDF and ppf counterparts I get a lot of questions at how I make these animations I use the manam library or more specifically manam Community Edition this is a python library that allows you to build beautiful mathematical animations using python code it was made by Grant Sanderson originally from 3.1
Brown and it got forked to create the community edition of mannum so there's a lot to share here I think that this would be a good community service for the manam community I really would love more people to to be interested in the library because you can do some wonderful visualizations for not just data science but math in general and I will make a point in future videos to do more manam walkthroughs as well as short three-minute videos on how to achieve certain tasks using manam a lot of them will be data science machine learning
machine learning oriented though so let's go ahead and dive in and get started and I will show you how to build these animations all right let's Dive Right In and get started grab your coffee because there is a lot of code to walk through so I'm going to bring in manam um all of us to all of his dependencies I'm going to bring in the normal distribution from scipy and then I'm going to import the OS interface to help with running the command line from python later I declared this data right here this is actually
this is actually a sample we're going to Simply use it to calculate the mean and standard deviation for the normal distribution nothing more for the purposes of this animation so I'm going to collapse that I'm going to declare this this scene to be named the PDF to CDF to ppf scene instead of instead of extending a scene it's going to extend a moving camera scene from mannum this allows me to zoom in and out and Pan the frame around this will be helpful when I start with the PDF and then I zoom it out I
call everything all the initialization is going to happen in the construct function this is going to override the construct implemented in the scene I have this argument right here skip animation so I broke because there's so much going on in this sequence I broke it up into sections and this was just a parameter that allowed me to skip sections while I was helping with the development you can use it as well if you want to if you want to only render certain parts of this of this scene so a couple of so a couple of
different different models I declared in advance so these classes I have the PDF plot the CDF plot and ppf plot will go through we'll go through each of these as they're used but I will show the PDF plot initially so when I initialize it I am going to I'm going to essentially save to it the mean the standard deviation the lower and upper X of this normal distribution which I'm going to set the range to be plus or minus three standard deviations from the mean it's also going to contain the axes so the X range
is going to be plus or minus three standard deviations essentially the Y range is going to is going to be between 0 as well all the way up to the means output function value PDF value and I'm going to buffer it with just a little bit of 0.1 on top of it and I'm going to divide that up into four four ticks and then I have a couple of configurations done on the X and Y axes to not include the numbers for the X but to include the numbers for the Y and I'm going to
and then for the Y configuration I'm going to limit to two decimal places so I'm going to tuck this away oops I didn't mean to tuck away that much so we have our X our axes declared the plot is going to be called on the axes I'm going to pass it this function f which we declared so this is a simple python Lambda so it's a shorthand function where it takes to give an x value it passes it to SCI Pi's normal distributions PDF and it accepts that x value it will also pass the mean
and standard deviation that built this PDF and then I'm going and one thing to point out here is this PDF plot class I declared extends a v group this is a special type of class in manum that essentially holds a group of vector objects so Vector group is really what it's short for and you can do a lot of useful Arrangements in manim by putting several objects inside a v group and then I'm just going to save the function the axes and plot to this class I do have some helper functions we will use as
well so for a given x value return the corresponding point that is the input and output variable values for that given x value and that's simply delegating to the axes c2p passing the x value as well as the result of passing x to the PDF function and the area range so this will return a area under the curve that's shaded and that shade is going to be blue and I I Define it with an interval X star and X end that delegates to the axis get area passing the plot the color as well as the
range of X values so we'll come back to the CDF and ppf model later as you can see I've collapsed those but I'm just gonna I'm going to collapse them for now and I will also collapse the PDF function or the PDF class sorry I will calculate the mean and standard deviation off that data like I said I would I am going to declare this section create PDF and CDF and zoom out so this is just a way to help keep this very long sequence of animations organized and kind of break it up into stages
and notice that the skip animations I set it to the skip animations argument I declared earlier so this is a way I can blanket all of these scenes to be skipped and Skip those animations as I'm iterating the work and I don't have to render the whole entire scene I only render that part of the scene I'm working on so when I can set this to true in order to just skip all the animations say for that one scene that I am working with I will declare my PDF model so passing that PDF plot we
were just looking at the mean of standard deviation and then I'm going to bring in I'm going to declare the CDF plot as well so let's bring that in next it really is very similar and follows the same pattern of the PDF but you'll notice that it's using scipy's CDF function not P not PDF and I change the range the range for the x is going to be the same but I change the Y range to essentially be between 0 and 1. I add a little 0.1 at the top just so the s-shaped curve doesn't
hug the top of the graph and then I increment the tick marks by 0.25 and then I'm going to configure the y-axis to include the numbers as well as limit the number of decimal places to two so so those that declares the axes then we call the plot on the axis to plot that s-shaped curve using that function and then we'll add the axes and the plot uh and will also save the function axes and plot inside this class instance so that we can refer to them easily later and it also extends V group so
very similar pattern to what we did with the PDF vx2p just like we did with the PDF this will recur for a given it'll return the point on the screen for a given x value for a given x value input as well as its output variable of the probability coming out of the CDF so it delegates to the c2p function on the axes I also have this function that plots the area all the way up to a given x value which we saw in the video and so this this is something we will use quite
a bit I also have these these uh these two helper functions to get the vertical connecting line to for a given x value all the way up to the curve as well as the horizontal line from the y-axis all the way to the curve so it allows me to trace a given point on the curve to the x-axis and Y axes so that is the CDF that is the CDF class oops and I just collapsed everything I didn't mean to do that so that's the CDF class or CDF plot class and then I'm going to
like I said I declare those two models and then I am going to declare the ppf plot for later and move it to the right to the right side of the screen but I'm not going to show it yet but I am going to put it there for now and then I'm going to take the PDF and CDF up here that we created and because they are already organized as a vector group I will put them in yet another Vector group and Nest them inside that new Vector group I will arrange them downwards so it'll
stack them nicely in a in a downward in a downward stack and I'm going to scale them so that they that they fit the height of the manam screen and manim has a height of seven units by default so that will that will compress those items down to seven units and their height and it will maintain the proportion of the width and height actually I can't remember if it was seven or eight I think it might actually be eight units uh and I just made a seven so it didn't hug the edge of the screen
now the PDF that I'm going to add the PDF model to the scene that'll include the axes the plot and everything now this is where extending the moving camera scene is useful I am going to save the current state of the frame and then I'm going to zoom I'm going to zoom in by a factor of 0.6 and then I'm going to move to the PDF model so that effectively Zooms in the camera by a factor of 0.6 and then I focus that camera on the PDF model none of this is animated yet I'm just
getting things set up and this is where I finally run the animation I'm going to is I'm going to restore the frame and have it Zoom back out and as it zooms back out we are going to see this the CDF axes revealed as they fade in as we zoom out and then we're going to wait for one second so that is the end of that first section Next Step we're going to draw an area between the PDF and CDF we're also going to label both of them so that's the name of this section I
am going to create a value tracker here so a value tracker in manim is very useful because it allows you to redraw redraw shapes and objects and anything that depends on a certain value shifting and changing it will you will it allows you to automatically update based on that value so I'm going to initialize the X upper tracker this is going to main this is going to be a variable of the given x value I have selected in the PDF and CDF and I'm going to initialize it so it starts on the far left side
of the graph essentially having which will essentially result in an area of Zero by going three standard deviations to the left we're going to declare the area for the PDF and I'm going to use what we call the always redraw function so they always redraw function is going to be updated on every single frame and this is where we utilize the value tracker so as I shift and shade different areas of the PDF and then do lookups on the CDF this I'm always going to have the PDF always withdraw that area based on whatever the
value of the X upper tracker is so I'll call the PDF model and then call that area range function we declared in it it's going to shade the area from three standard deviations the far left edge of the graph that's effectively negative Infinity but that's the end of the the x-axis range so that's the far left Edge and then I'm going to go all the way up I'm going to grab the area all the way up to the X upper tracker's value you call the current value out of the tracker the value tracker get value
and that will return the court the current value it is storing so this allows so it's going to redraw this this object on every single frame this area object so that we can see it updated between each frame going from going from a lower bound x value all the way up to an upper bound x value and I'm going to set the color currently to be blue we'll draw the connecting dashed line between the PDF and CDF projecting the area this is going to be a dashed line and I'm I'm doing some type some some
type hints in Python to kind of help the autocomplete as I was coding this it's also going to be an always redraw so this is the line that little yellow dashed line that ties the PDF to the CDF on that given X upper tracker's value and it kind of shows that neat little projection of capturing the area up to a PDF but showing the value for that area on the CDF and the star is going the start of that dashed line is going to be uh the PDF models x given x value to point and
I'm just going to Simply pass the given x value in the tracker and the CDF models x2p is going to do the same thing it's going to return the point on that S curve for the given tracker's value now because this tracker is always you know can change between frame to frame and manual interpolate what and we'll see this in action shortly we'll interpolate what the x value should be for a given duration of time to execute that animation this will always redraw that connecting line accordingly and I'm going to make that dashed line red
so we'll project the area to the CDF as X upper increases the tracker increases but will also show the area as a decimal so we'll have that partial plot of the CDF that is going to reflect um that is going to reflect the plot all the way up to that x value so when I build that s-shaped curve I'm not building it all at once I'm Bill I am projecting the area as I slide that PDF area and I'm showing the capture area up that point so I'm only going to plot up to that given
x value which I which I have that CDF model do up here which I just jump to it it's only going to plot that function only to the specified x value as the Max and this allows me to create that neat little animation of not building the entire S curve but rather animating that S curve being built all the way from zero to one so going back to where we were so right here I also will have an area label it's always going to be updated as well it's always going to be redrawn I'm going
to use a decimal number so this is a nice little label where you simply pass it a floating point value and it will take care of how many decimal places it should show in that given label for that decimal number and I'm passing at the CDF models probability value using its function and I'm just passing the X upper tracker's value and I'm going to scale that down by a factor of point a so make it a little smaller and then I'm going to set it next to the I'm going to set it next to the
point on the CDF on that S curve for wherever that point is on the s-curve so I'm getting the x value from the tracker and I'm looking up for that given x value on the CDF what is the output variable value and that will give me a point and so this area label is always going to follow that point and I'm going to put it on the right side on the right side so we'll populate the so finally we're going to execute the animation we're going to fade in the area the connecting line the partial
plot as well as the area label we're going to run the animation for five seconds by filling the whole PDF scene so we're on that value tracker we're going to call animate and then we're going to call set value and we're going to set it to the max of the range on that axis which is going to be three standard deviations to the right so mean plus 3 times standard deviation that will bring me to the upper bound of the normal distribution as well as the CDF and PDF that will gradually interpolate in between each
frame what the x value should be and that's one of the night the neat things about mannum is it will execute the that the interpolation math for each frame for a given amount of time which in this case is five seconds and then all of those always redraw functions will update all of those objects pointed to that X upper tracker accordingly so very cool we're going to wait a second it's always a good habit between each animation to put in a weight and when you go and edit this video for narration later you have nice
little spit spaces to do freeze frames and so on so you can hold a given frame while you narrate before you move on to the next step and I've been using I've been using a video editor for that which is a whole separate topic we're just using this to produce the animations to put into the video editing software and then for here we're going to fade out we're going to fade out the the area connecting line so you have partial plot and the seed and the plot of the CDF model in the area label because
we're going to reset we're going to reset and get rid of those items so that we can look up specific values so we're going to bump the PDF and CDF to the left Edge so we are going to scoot those over to the left side of the screen if you recall earlier we put the PDF and CDF in the left panel which is just a v group holding those two items and we arrange them down and we scaled them down to fit a height of seven units which again I believe manam's height is eight units
don't hold me to that and so I move it to the edge which means I'm going to put it to the left side of the screen and there is a buffer argument to change how much buffer there is between the edge and this given object or group of objects and that is this will give me some room to do some to do some work on the right side and to create some other objects such as the the subtraction scene to calculate a given middle range area which I'm going to show show shortly but before we
even get to that we're going to label both the PDF and CDF and Flash that in which um which we which is pretty simple to do I just create a text object and just label the the cumulative density function probably density function respectively I scale both of those down by a factor of 0.75 so I decrease their size a little bit and I'm going to put each one next to the CDF model and the PDF model respectively I'm going to put it on the right side of that object so so these next two commands are
very very nice to use because you can move an object relative to another object and say okay which which side should it be on in this case I say put the labels on the right side of those of those objects so I'll fade in those labels because we did we only created them we didn't actually fade them in or add them to the scene yet we'll wait a second and then we will fade them out and then we'll wait another second and that is the end of this section okay so next up we're going to
show an area lookup uh from the PDF to CDF all the way up to x equals 70. so I'm going to create a label of just containing the number 70 scale it down by 0.8 and I'm going to put that on the x-axis of the PDF where x equals 70 this is why I call the axes dot c2p right here so this is going to take the coordinates of 7 0. and look that and look that up on that given axis for the PDF and that will return the point on the screen not just the
point on the axes and I want it to be zero because I want to be on the axis on the x-axis where I want the Y the output variable to be zero and I'm going to put that label below that point I'm going to reset the X upper tracker and set that value back to the left boundary of the axis that's going to be you know three standard deviations to the left I'm going to fade in that label that I just created I'm going to add back the area and that connecting line so when I
add that it's not going to animate the minutes it's going to throw them in immediately and because the the value tracker is on the far left position you're not going to really see the area yet because the areas effectively has an area of zero and the connecting line will be visible though and then we're going to animate the value tracker and set the value to 70. so it's going to in one second because that's the default time for a for a play of an animation it's one I mean I could set the runtime to a
different value if I wanted to but but for now I am going to just simply animate it and set the value to 70 and that will take one second foreign and that will update the connecting line in the area accordingly and I'm going to label the area in the CDF so I'm going to use the CDF models function past the value 70 and that is going to return the area I'm going to pass that to a decimal number label format it to three decimal places and I'm going to put I'm going to put that next
to the connecting line at the top of it and I will put it in the upper left I'll make it upper left to the top of that connecting line and then I'm going to get the Center of that area the center of that polygon and so I'm going to call pdfmodel.axis coordinate to point I'm going to pass the mean as well as the as well as what the Y value is for that mean and then subtract by 0.5 so what I'm doing here is I'm trying to get the center of that area mass not just
not just horizontally but also vertically there is a function in mannum called get Center of mass that I've been told should help do this for me but I still had some issues with it and maybe I'm just not reasoning maybe I'm just not using it properly for my particular use case that's something I will investigate later any learnings I do find I will probably make a video for and then I'm going to create a question mark inside a text label and I'm going to move to the center of that area so I will put that
question mark in the center of that Mass and then I will fade it in next up we are going to look at this horizontal line on the CDF that little dashed red line that's going to always that's going to be an always redraw I call the horizontal line on the CDF model pass it the tracker value that is going to so that's always going to be updated based on whatever the value trackers set at and then I'm going to do a write animation to bring it into the scene so it'll like do a little sketch
do a little sketch animation to Brit to bring it in we'll show the area the area lookup label for the CDF then we're going to move it to the area so we'll bring in that label on the CDF but then we're going to wait we're going to remove the area question instantly and then we're going to animate that label being moved to the the center of the area plot on the PDF let's move on to the next section where we show an area in the middle range lookup from the PDF to the CDF so I'm
going to wait a second and then I'm going to break up the area into two pieces this was a little tricky so I needed to subtly break up the the area uh from into two areas so from 65 to 70 and and also have that left tail all the way up to 65. so I'm going to have this area 65 to 70. it's always going to be redrawn it's going to be an area range from whatever is the upper bound of the X the tracker all the way up to 70. so this x upper tracker
is actually acting as the lower here and then it's going to have the upper range be 70. and then I'm going to add that area and then so I'll move the area up to 70. to the right side of the screen so I will take that area of up to 70 move it over to the right to the top right corner of the screen I'm going to take put the area as well as its label together in a group and then I'm going to call the copy function this will do a deep copy so that'll
also copy the objects inside the group and then I will call that the area 70 panel I'm going to animate it scale it down by a factor of 0.8 and then put it next to the left panel and then I'm going to bump it to the upper right Edge so this so actually in this this actually this next to left panel might not have been necessary I might have just left that in here but it's because I think the two Edge is going to override it and actually do its own thing it's going to literally
put that to the edge of to the edge of the upper right side of the screen then I'm going to wait and then I'm going to fade out that label that's that cdf70 label not the one we copied over but the original one and then I'm going to label 65 on the x-axis on the PDF so I'm going to call I'm going to use math text create the 65 scale it down by 0.8 so make it a little smaller then I'm going to put it next to the point on the axes of 65 0 on
the PDF so 65 0 that coordinate on the PDF is what we're putting it next to or putting it below it so again we're using the coordinate to point function on the PDF models axes to convert that 650 coordinates into a point on the screen now we're going to switch the area color to Red because we're now going to get the area we're subtracting which is going to be the area up to 65. and subtract that from the area up to 70. so we will set the value to 65 on the tracker and that will
this animation will last for a minute and then we'll also simultaneously fade in that label of x equals 65. we'll draw the horizontal connecting line on the CDF and we'll also draw the question mark so we'll bring in another question mark put it next to that that area chunk that middle range area get the left side of it and then put the question mark on the left of its Edge and I found I had to shift a little bit again this is where I probably should have probably should have used the get Center of mass
function and try to work it out but I just did some manual correction and just shipped it further but to the left by a factor of 0.2 so the left is actually you can this would bump it by one unit to the left but if I multiply it by 0.2 that will only shift it by 0.2 units and then I'll wait and then I'm going to write the question mark write that horizontal line on the CDF then I'm going to label that area for X is less than or equal to 65 in the CDF so
that will be a decimal number uh passing 65 to the CDF models function so that is what gets passed to psi pi and gives me the resulting area from the CDF and I'm going to set it to three decimal places then I'm going to set it to set it next to the top of that connecting line again putting it on the upper left of the top of that connecting line then I'm going to wait a second fade in that uh that 65 label that we just created and then I'm going to wait remove that question
mark immediately Fade Out that horizontal line on the CDF and then I'm going to animate moving that label to be next to that middle area between 65 70. I found the best way to position it inside that asymmetrical area object was to get the left side of it and then put it and then put it to the left and then we'll wait and then and then we're going to wait for another second now we're going to move take that area as well as its label and we're going to copy we're going to put it in
a in a vector group I'm not going to copy the vector group this time I'm only going to copy the area itself because I want to show the label cdf65 that given area as the answer so I don't want to remove the label I kind of want to put some emphasis there and keep it there but I'm going to put it in a vector group and I'm going to copy the area and I'm going to declare I'm going to declare a minus sign scale it scale it up by four so I'm going to blow it
up by a factor of 4 make it bigger and I'm going to put it next to that area assembly panel but put it below it I'm going to have a buffer of 0.5 so I'll Pat it by a fact by 0.5 units I'm going to remove that area I don't need it anymore then I'm going to fade in that minus sign then I'm going to take that area 65 panel that I that I declared up here containing that area I've copied as well as the the 65 the 65 label animate it scale it down by
0.8 and I'm going to put it next to that minus sign but I'm going to put it below the minus sign and the aligned Edge this is a really helpful argument you can do in the next two function is I'm going to align it to the left border of the area 70 panel so it's going to left a line essentially and the left align is going to stop at whatever the left edge of the area 70 panel is and I'm going to give that a buffer of 0.5 so I'll play that animation I'm going to
wait for a second finally I'm going to create an equal sign I'm going to blow it up by a factor of 5 so increase it by a factor of 5. I'm going to have it match the width of the minus sign so I this was a little tricky it was a little awkward taking some math text but making it really large to show the subtraction operation between the area up to 70. the subtracting the area up to 65 and what that equals so I made the equal sign have the same width as the minus sign
it proportionally scales it down and then I'm going then I set it next to I took the area 65 panel the area semi panel and I put those both in a group just for the sake of this operation so treated this as a single object put it next to that but put it below and this was my way of dealing with the ace the asymmetry of those two objects the area 65 and area 70 panels because those partial areas were a little weird and they were aligned strangely so I found putting them in a group
together and kind of putting an imaginary box around them got the desired result I want and then I could put this equal sign below them and I gave it a buffer of 0.5 so 0.5 spacing then I label the area X between 65 and 70. so I take that um I create a decimal number of the area between 65 and 70 that is going to have three decimal places and I move it to the middle of that uh to the middle of that area that's left over that middle area between 65 and 70. and I
found I had to manually shift it down by half a step just to make it look a little bit better again I really need to explore the get Center of mass function a bit more I fade in that label 6570 I Fade Out that connecting line I wait and then and then I'm going to move that area 65 through 70. I'm going to put that to the right side put that below the equal sign so I grew up that label and that area I do a deep copy of it and then I'm going to fade
in the equal sign then I'm going to take that panel I just declared of those two of the label and the area and then I am going to I'm going to animate it scale it down by factor of 0.8 so make it a little smaller put it next to I put a whole group containing the area 65 panel the area 70 panel and the equal sign so I put a big box around that essentially by putting in a V group and then put the area 65 70 panel below that entire that entire group of objects
I put it below and I put a buffer at 0.5 and then I shifted it to the edge I shifted it to the right so that the tail so that the right side would kind of align to so the center area I wanted the T I wanted its right side to kind of line up to the right side of the area up to 70 and that and I achieve that by doing the two Edge to the right side and then I wait for another second now that that's all done we can do some cleanup I'm
going to group up all of these elements um and fade them all out as a single group so that includes the the area panels the equal sign the minus sign so I just do one massive cleanup to leave only the PDF and CDF themselves and get rid of everything else because what we're going to do next is we're going to take the CDF and do that animation to turn it into the ppf the probability Point function so I am first going to copy the CDF model axes and then I'm going to do a couple of
rotations so first I'm going to rotate it by 180 degrees along the x-axis and then I'm going to rotate it by 90 degrees by default on the I believe it's the y-axis if I recall correctly I believe it's the y-axis so actually it rotates you know actually it rotates along the out axis so so so when you do a rotation it's actually going to rotate uh relative to straight on the screen so towards the out towards the out Direction and then and then I'm going to transfer and then I'm going to do something called a
fade transform so I'm going to take that that axes the axes I just copied and then make it become the axes on the probability Point function model the fade transform when you have two objects that don't that don't seem to transform from one to the other as well it's a good it's a good transformation to resort to where it just basically does if does a fade illusion to make it look like the transformation is happening but it's really fading from one to the other and then I'm going to bring in the CDF plot the CF
plot and copy it I'm going to send it through the same rotation so I'm going to rotate it 180 degrees along the x-axis then I'm going to rotate it 90 degrees along the out axis and then I'm going to animate it to become the plot for the percentage for the ppf function now that's not that's not terribly hard thing to transition towards because they're both s-shaped at this point so there's a little bit of there's a little bit of shearing and stuff or or stretch that happened between the CDF and the ppf or just a
little bit of transformation but not tons and then finally I do a lookup for a given ppf so I'm going to label the probability Point function really quickly I'm going to rotate that text by 90 degrees scale it down by 0.75 and just put it on the left side of the ppf model I'm going to wait fade in that label wait again then fade it out I'm going to set the area color to be blue again I'm going to reset the X upper tracker to be on the left side of the axis all the way
at the edge or the the star of the range which is going to be three standard deviations to the left I'm going to get the area up to 75 as well numerically I'm not actually doing the geometric area area yet but I am going to get the area for or sorry let me rephrase I'm going to retrieve the x value that gives me an area of 0.75 and that's what's going to be saved right here I call the ppf models function which goes to which goes to scipy actually let me show you that because we
did not look at the ppf plot class so it has the axes of .001 to 0.99 now the reason why I have to do why I can't just do 0 through 1 is because that s-shaped curve will forever approach Infinity but never reach infinity or reaches it it's wrapped around those two asymptotes and it will cause some undesired Behavior by having zero and one included in the range so you just Pat it just a little bit so it never includes zero and one because the s shaped curve will never touch those values then we're going
to calculate then for the Y range it's going to just go from you know -3 standard deviations all the way to up three standard deviations the standard deviation itself is going to be the the tick mark units and the length of and then we're just we're just going to have the length of this graph before and we'll also do some further configurations to the x-axis only including 0.25.5.75 and one those are the only numbers we will see on that axis we'll make the plot Orange it's going to use this function up here which is again
it's using SCI Pi's ppf function I passed the x value the mean and the standard deviation and that's going to return at the given the given x value for an area X which this actually probably should be P to be more proper but I'll just keep it there for now and I will add the axis plot the functions I have this P2P function which literally looks up for a given probability value what is what is the uh what what does that return what what point does that return uh from the curve at at that given
p-value that given probability value or what we were previously considering the x value we can also have the same methods to return a vertical line horizontal line so going back down to where we were we are going to so we are going to look up the x value that gives me 75 of the area and this area 75 this is going to be the Shaded the Shaded area under the PDF it's always going to be redrawn it's going to call the area range from you know negative three standard deviations all the way up to the
given x value from the tracker I'm going to wait add that area immediately which again it shouldn't which again that area should be non-existent at first but the moment we start animating the X tracker going all the way up to whatever value gives me 75 of the area which I got from psychics from scipy if I said psychic learner I earlier I apologize I meant scipy and I'm going to set that value to X up to that x value that gives me 75 75 of the area I wait a moment and then I'm going to
label 0.75 put it in the middle of the Shaded area which I do with the c2p function right here again I'm going to fade in that label of 0.75 and then I'm going to move the question mark to the x-axis so I'll take that area question I I made earlier move it next to that x value that gives me 75 of the area the Y value being 0. so it's literally right on the axes and I call that using the c2p again I put it below that point and I give it a buff about buffer
of about 1.15 I write in that question mark and then I am going to get the vertical and horizontal lines for the PD for the ppf and CDF respectively and this is what's going to allow me to trace the uh the ppf and the CDF simultaneously and I'll write them as simultaneously in the same animation wait a second and then I'm going to draw the horizontal line which reveals the x value so I call the ppf's a horizontal line the cdf's vertical line for that given x value that gives the area 75. and then I
write both of those lines simultaneously and then that's going to reveal the x value and I'll put in that label of what that x value is that CD coming out of that CDF or ppf I'll set two decimal places scale it down by 0.8 and then I'm going to put it on the I'm going to put it on the CDF model on the axes where the x value gives me 75 of the area I'll also set the Y value to zero because I want that point to be right on the axis I'm going to put
the label right below that and give it a buff of 0.15 so that's the CDF label I'm going to do something similar with the ppf I'm going to copy that label and then move it to the ppf model on its axes where the x value is zero but the Y value which really it's actually the probability the probability is the input and the x value is the output so X is actually the vertical axis here and then I and I'm grabbing the point of zero and whatever x value gives me 75 of the area put
it to the left and that's kind of a buff of 0.15 I write both those labels simultaneously weight and then I am going to fade out that question mark immediately and then animate animate that that area lay that x value label immediately to where the question mark was and then wait a second and we're done so we have finished that enormous enormous scene there was a lot going on there it took me quite a bit of time to write but but it was fun to do it's fun to share with all of you and I
really hope that you learned some new things here there are a lot of great Madame resources it's a very very nice welcoming community and I do encourage you if this stuff interests you to please um to please give it give us some practice what we finally do here is um if if I run I run the script it's going to check if it's the main method so this is my way of checking if I actually literally hit run on this file and if I did then it's going to execute this command so it's going to
execute this command with manum to execute this python file and render the scene accordingly and you'll see that I just said it this sets it to low quality whereas if I did K that is 4K quality or H is high quality I'm going to suppress warnings I'm going to have it automatically play immediately I'm going to disable caching and I just understand that disable caching does improve input improved performance doesn't take up as much storage space the output file is going to be the PDF to CDF to ppf scene dot MP4 the input file which
is this file we're walking through right now I called it scratchpad.py and then finally the scene that we are rendering that's the class name that we are rendering it's the PDF to CDF to ppf scene which if you go all the way to the top of the file that is the name of the class right here so folks I hope you got a lot out of this walkthrough the code is on GitHub you can see it in the description below and and feel free to comment and if you have any suggestions on other things you
would like to see just let me know and I will try to get to those suggestions as soon as I humanly can all right till next time thank you [Music] thank you [Music]