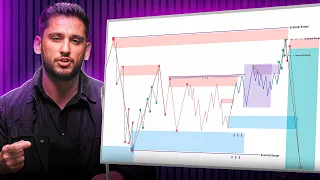
Hello everybody welcome back to the channel I am the stoic Trader and today in this video we are going to dive deeper into the market structure this is going to be a followup for my previous video the only trading strategy that you will ever need but before we begin I want to remind everybody that this video is not Financial advice and should not be construed as Financial advice I highly encourage you to consult your own Financial advisor before investing in trading live funds so in this video I want to reinforce the foundations of the market
structure and how the market moves then we're going to understand The Narrative of why Market moves and where should we be taking our trades because without narrative any pattern and any concept will fail with without understanding where the price most likely to go next doesn't matter what we apply to to the Chart it's going to fail Because you don't understand the narrative and at the end we're going to take a look at the simple trading plan using the market structure Concepts so I want to bring your attention back to the how Market moves and Market
moves because of structure because of Market structure Market moves based on structure and I put out this tweet recently or post uh what it's not a tweet anymore right um Market structure is the blueprint of price analysis with Indicators and Concepts as its tools to decode the prices J JY so really think about it you have the foundation of how the market moves and there's a lot of theories a lot of conspiracy theories on how the market moves and everybody trying to decode the algorithm trying to find the Enigma and they not realizing that their
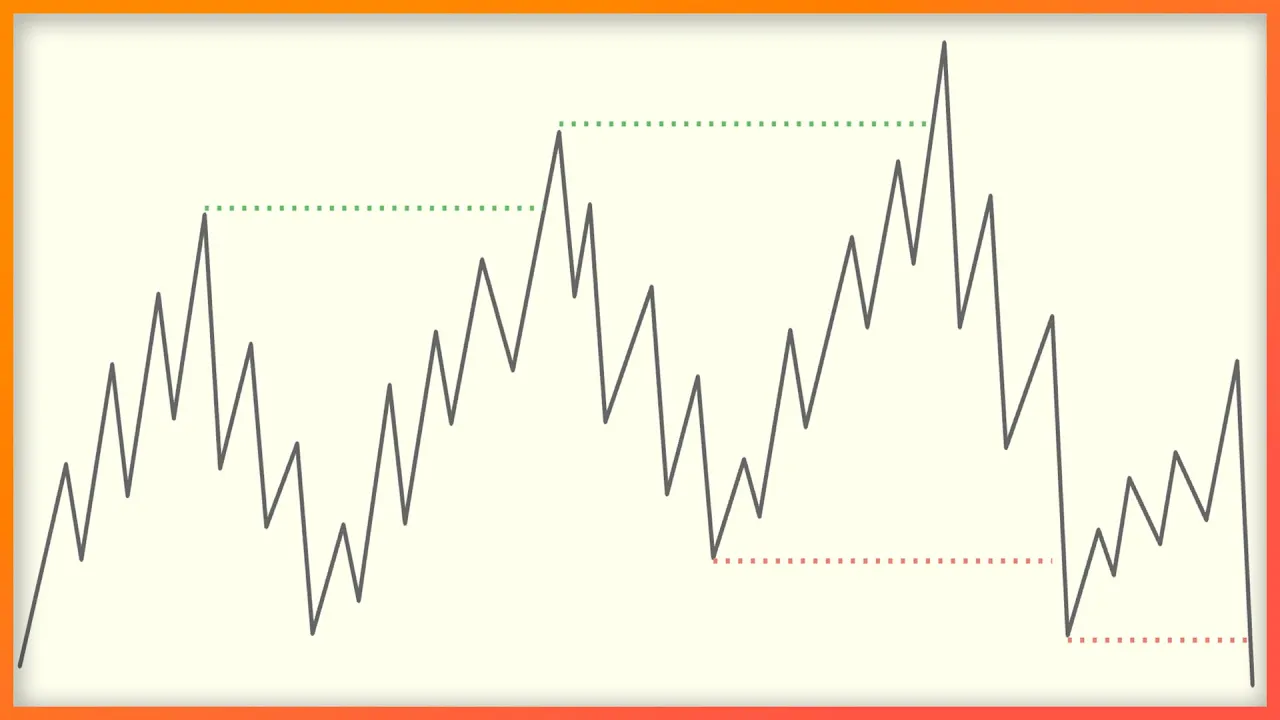
little setup that that that little silver bullet or something else failed because they don't understand the structure because they don't understand When they buying in the bearish trend when the trend is bullish they shorten it and that comes from lack of understanding of the overall structure and I'm talking about the high time frame structure and we want to follow High time frame structure in order to be on the right side of the market and again Market structure is why the price moves because uh as we create highs and lows above those highs going to be
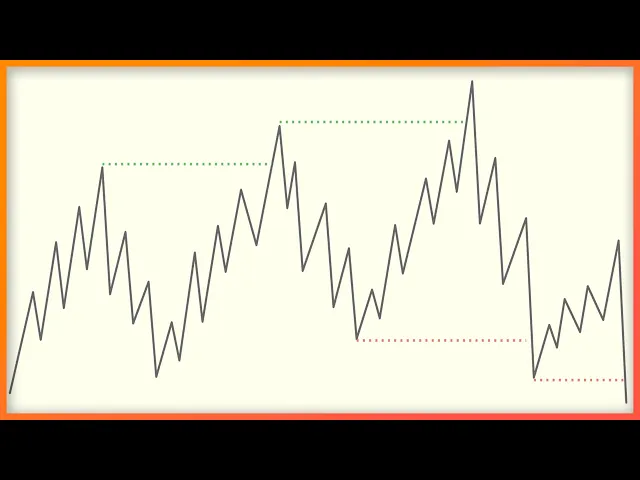
liquidity above those below those lows Going to be liquidity so Market moves from liquidity to liquidity and creating structure and building Market structure this is the most important thing that people Overlook and they don't understand why their setup might not work and largely it's not going to work because people don't understand where the price is coming from so a lot of people get tripped up on uh picking the right highs and picking the right lows by trying to Short over here not realizing that this is a high time frame low and this is a high
time frame high so if you get tripped up and you're not understanding that this is intermediate Trend between high and low you're going to get screwed on your trades if you're getting to confused which high and low is protected and which are not remember this rule the high has to come from the low the High time frame High has to come from the high time frame low so look at this High Time frame High came from the high time frame low so when this low is broken this is intermediate low this is not a real
Market structure shift I mean it is a market structure uh break or shift whatever you want to call it but it's on the intermediate time frame it's on the lower time frame shift and until we go below this low this whole High time frame is going to be bullish as you can see we we go and Making higher highs on the higher time frame and until we break the higher time frame low we're not going to be bearish this stage is bullish so we keep looking for the bullish setups until we get a bearish break
so the high has to come from the low the high has to come from the previous low and that's how you know that that's a high time frame high so just like this low coming from this high from high time frame high this low didn't come in from this high this this High time frame low did not come in from this little high because this High did not come in from the high time frame low so when we looking for the trades we want to be on the right side of the market so this could
be a high time frame Trend and inside we could be trading this going down here and going back up making new high and after the high is established we we're looking for the come back to the previous area of price action remember At least 50% so we could be longing all of this trend here take profit at the high and then expect a come back into the area to long again to get a new high so a lot of people getting tripped up when we shift the intermediate structure and they think because we shifted the
structure we immediately going to Trend lower and take out this low we might do that but before we do that we need to see if we can have a flip because we bullish we expect a higher high so so When we have the bearish flip on the lower time frame we just know that we going down and we are starting a retracement for us to go back up higher so what we did we broke out from this previous area of price action supply and demand whatever you want to call it I'm not going to get
hung up on the terms but previous area of the price action we traded through it so now this pre area becomes demand below us it becomes an a an valid area for us to to Keep buying for the new high to be established so we anticipate price coming to our levels maybe this is a mitigated area or something here that is sweeping the low over here maybe there is imbalance there uh maybe there's an order block there it all works all the concepts are going to work only if you you can get on the right
side of the market so when we making higher highs you should be bullish on the higher time frame Understanding that intermediate trend is trying to find a low and then after this flip happens over here we could be buyer in here and trying to take out this high and this going to work on every time frame on all of the time frame it's going to somewhat look the same I mean the price action is not going to be perfect like this but we're going to have high time frame highs High time frame lows and intermediate
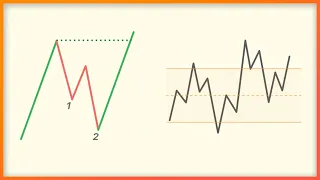
Trend between those and this is where The institutional PR playground is institutional playground and the retail graveyard because between all of these highs and lows the price can do whatever it wants so the intermediate Trend between highs and lows going to give us an indication of the flip we look for this reversal pattern the same reversal pattern that we were talking about in the previous video you wait for this pattern and because you're expecting a a bullish continuation you know this is an Entry here and we could this could be a 1H hour entry with
uh 1 minute or 5 minute flip and after we enter we hold it until the next high is taken this is basic Market structure and how Market moves and you can take advantage but you're only going to be correct on your trades if you understand where Market is going if you understand what is the current Trend what is the current intermediate Trend so here's the 1H hour chart of gold and you have the overall Trend in a red and you have intermediate Trend in between those so we're going to start here as you can see
we had a push up and then we had a break below so now the price came back and and give us an entry here in the previous area and we start our move down so you can see there's a chop in here there's a consolidation so a lot of people getting tripped up in here right maybe they Trying to pick ax botom and they they're getting excited on this pushup there is a wick in here so as you can see people may be got excited after manipulation distribution upwards we going to the Moon well nope
we haven't broke the important High until we break this high price can do whatever it wants in between those swing points and that's where all the retail getting clapped so we had this pushup everybody got excited and we have grinding down and this is Intermediate Trend in here and the last protected high is all the way here so when we have this push push up and push down there's a lot of emotions involved in this so you could be a sell every time we have this pumps until we have this intermediate Trend flip like uh
over here it was it flipped over here this this high this High has been broken over here and price came back give us an entry Bounce from the imbalance breaker whatever you want to call it and we Start making our way up but our protected high is here this is the last protected High because this High came from the high time frame low this High time frame low came from the high time frame high high time frame low high time frame high so anything in between the swing points see we keep making new lows until
we have a flip intermediate Trend flip so now we looking for bullish and now we are Looking for this high and if we can close about this high this would be a bullish Trend now but since we haven't closed about this High we just came back and mitigated this unmitigated area over there and we what we did we started building our bullish Trend I think there was a closure bullish Trend up and then boom broke the trend here and started to move our way down so this is a break in intermediate Trend so we came
back into this Swing and this is where we rejected from the last move up before the price made a new low and and the last move down before price made a new high and this is where we looking for Longs in here if we expecting this trend to continue but we actually flip this here so we probably attacking this low after this flip just an example how I would analyze the trend so let's talk about the correct way of measuring these previous areas of price action which areas are we picking here Which areas are we
putting our fibs on and a lot of people think that this is what Dave is teaching that that this is what we are measuring in here and it's not correct we are measuring a previous price action area and after price makes a new high we expect the price to come back to the previous area of price action and as I was talking in my last video we expect the price to come back at least to the 50% now you see me uh going with 30 50 and 70% well sometimes Price is not going to come
back all the way to 50% sometimes we can have a tap at 30% and really there is three uh main scenarios you know the price can tap on the area and go the price can dig into the area at least to 50% or the price can sweep the lows and create double bottom and and keep going higher so those are the scenarios that you need to back text you need to go into your charts and and find these setups right it's an easy find there's everywhere you Have a trend and You observe how the price
comes back into the area and what does it do here for you to get in only through the back testing you're going to realize the best areas to get in I'm just giving you framework I'm not going to give you signals I'm not going to tell you how to trade I'm going to give you the framework and you need to realize for yourself what how are you going to trade there's different Traders there's some Traders that want to just wait hours until their entry on a 1 hour time frame or something or you can sculpt
this you can sculp these little moves down then then move up you can do whatever you want but this is the framework and you need to understand what are you doing before you're doing it so that's why I always going to say get profitable in the demo first because this is all playing out on a live account with live Funds everywhere every time on all time frames and you need to just get profitable with it you need to build rules around this patterns about Market expansion and Market reversal which you're going to see every reversal
is almost the same so the same with the shorts you have the previous area of price price action the last swing up before the price made a new low the last swing up before the price made a new low so if we keep shorting here we want we Anticipate price to coming back into the previous area previous area the last move up before the price made a new low and the last move down before the price made a new high that's the area you measuring so shall it be 1 hour chart we waiting for the
lower time frame confirmation reversal pattern in the zone in the important Zone that you identify we're not getting a trade at the top of the range and trying to catch this expansion we're not doing That because as I was saying in previous video right don't buy high and don't sell low only Buy Low and only sell high so if this is the range why are you buying at the top of the range this is where you you're buying this is where the the best opportunity is and if you keep shorting this after we bouncing and
and we have a reversal on a lower time frame what are you doing We had an intermediate Trend reversal and you still shorting after the high time frame is is bullish that's where all the losses are coming in not understanding the high time frame narrative bias and once the price breaks out and you anticipate coming back into your area then you anticipate your reversal and what reversal I'm talking about this reversal the pattern that I told you That Dave told you to go and look in your charts everywhere to to go and find it and
this is what you're going to find on the lower time frames even on higher time frames the same reversal pattern so again we have price moving down and then what we see a move up breaking this previous high and then move down into the previous area of the price action the last move down before price made a new high that's the area we are measuring And that's the best entry is the same for the shorts we have a trend up and we have a fail we have a break of structure and come back into the
previous area the last move up before price shifted down before price made a new low that's the area that needs to be mitigated and and if area is not mitigated we want to leave this area for the future because when the price comes back to that area we can have a nice reaction we can have a maybe scalp short Or maybe we have a continuation short and again like I said you don't want to be chasing down this stuff you want to catch it at the right area because that's where the the best opportunity this
is this is where the highest probability trades going to be cuz it can reverse after this low is swept it can just go like this and reverse you don't want to be chasing at the bottom of the range if it's reversing you want to at least capture Something if you get in here you want to capture something at least when it's reversing so that's why you want to have rules for the entry don't buy high at the top of the range and don't sell at the bottom of the range don't sell low so here's again
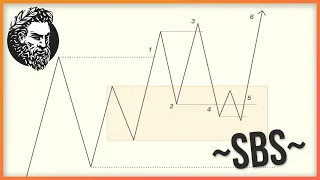
the simple schematic the price is not going to look like this perfect all the time but the idea is the same we have high time frame swing points we have high time frame highs and high time frame lows and in between Those we have intermediate Trend so when the trend is breaking bullish when this high is get gets is broken we anticipate a come back into the previous area of price action the last mve down before price made a new high this is the last High time frame move down before the price made a new
high this is not the last move down before price made a new high not this little move this is intermediate move okay this is Intermediate move for this high and after this intermediate move got broken we expect a bearish continuation in intermediate Trend until we see an intermediate Trend Flip or we take out this slow but because we in the bullish stage because we have this breakout here I'm expecting price to bounce you know around 30% 50% or 70% of the previous range so after we see intermediate Trend flipping bullish this is our sign to
get in and start Attacking these highs and ultimately our goal is to keep going up and make a new high and after we make a new high we anticipate coming back into the range previous price action and if we don't see a flip in here like we didn't see it here and price just traded lower and broke here no problem no trade right we don't have a reversal pattern we don't want to enter the trade so what what we see after that continuation down so this whole bullish Stage is broken now now we are going
down on a high time frame on a bigger picture that's where a lot of Traders going to get tripped up trading against a high time frame Trend a High time frame bias this is what you can use for the high time frame bias for your daily bias so if trend is bullish and we just reversed we we open up here on Wednesday there it might be Asia session we dip down in London make a reversal and continuation in New York and capture This whole move here because we understand that this is a bullish Trend and
and there is a class by day for the ICT guys but the classic bu day is only going to work in a bullish orderflow it's not going to work here classic bu day it's not going to do this here because we are on our way down maybe there is a classic sell day here and here maybe we have a seek and destroy or something but Market moves because of the high time frame structure Whatever the high time frame structure is going to influence these moves so we could be trading this in multiple ways if you
are a scalper you can be sculping these little moves here on the one minute and have your 1 hour as a guide or 15 minute as a guide you can hand one minute as a guide that's what I've been doing and I love it I love sculping I don't have to wait hours upon hours on my entry I can understand the high time frame and if we start moving up I get in On these little pullbacks and I I might catch these little runs if you are swing Trader you could be waiting for the 1
hour High time frame Trend to flip so you see the swing points and now we we have a reversal on 1 hour you short it until we have a flip and you buy it and look for a new high but this could take a long time on 1 hour you know this this could take a long time to play out so it's up to you It's going to depend on personality on your free time I love I love trading I love sculping I I love trading in and out and I used to believe that that
it's impossible but it's quite possible thanks to Dave he he showed me the the way and and um it's quite possible and it's all starts with Market structure all the trade ideas everything will come from the understanding The Narrative behind price and all of the concepts are going to lose against Market structure Because the as I said in my tweet the market structure is the blueprint and the concepts and different indicators describing a how price moves how price gets to this destination so before it's going to break this high it's probably going to pull back
and reverse and then go for the high it's not going to go straight up and I mean there there are markets that that just go straight up but even when they going straight up there's intermediate pullbacks if you're Trying to apply the I breaker over here and it fails it failed because you're not understanding the high time frame picture it didn't fail because the concept didn't work everything works every works but your lack of understanding of the proper narrative is going to trip you up so do never ever blame price action never ever blame different
concepts because they all work Dave Concepts Works ICT Concepts Works everything works you know the the standard deviations the the chaos theory the everything works the time based Cycles everything works but if you apply it at the wrong time time at the wrong place you're going to get screwed and stopped out and and you're going to keep blaming something else that has nothing to do with price action just because it's Monday and a bank holiday the algorithm doesn't stop working the main Thing is that it's doing the same thing over and over but during the
you know Asian session London session New York session we have more volume we have more volatility the price is going to move uh drastically with with bigger volatility it's all going to look little different here and there but the foundation of it is always going to be the market structure and as as long as you understand that you will never blame anything else for for your mistakes but Yourself because Market is perfect it always follows the trend it always has a high time frame Trend that it's following and the lower time frame uh the one
minute is is always delivering to the high time frame prices and and it's always doing the same thing it just doesn't look the same right so it's not that the market wasn't perfect today you were not perfect today you didn't realize the high time frame Trend you you didn't Analyze this properly and we we all humans that's why we we not going to have 100% win rate all the time it's possible anything is possible but again Market is perfect and if we lose the trade it's your fault so let's move on I want to reinforce
this principle the last move down before a new high and the last move up before a new low so we see the price action some some schematic over here so what you have is the last move Down before price makes a new high this is where the opportunity is and as you can see if we were buyer here we would make some nice profits and then price gets into consolidation and like I said we don't care about this consolidation until the important low which this one is broken right so we consolidating and then you see
this intermediate D trend is breaking so here the last move up that's also mitigating this price action area right this is a 50% mitigation here So after breaking these lows and breaking these lows we coming back into the previous area the last move up before the price shifted down right here so then we have come back into this area and we're going down again we don't want to measure this area over here we measuring the last move up before price made a new low and the last move down before price made a new high let's
get a little deeper and these are the important Concepts uh that Dave Teaches and this is what's happening in uh between the two swing points and it's of course it's not going to be the same all the time it's not going to play out the same as as I put it here on the schematic so here we have low and we have high the price comes down makes a new low and then makes a new high so this low came from the this high and this High came from this low so this is what Dave
calls it move origin uh self-explanatory right this is where we We originated this move up then on top of that we had another area here that never tapped in into this original area so this area is unmitigated we we're going to leave it marked up for the future and then we have this area on top and this area is responsible for the structure break you can call it area responsible snd responsible support and demand responsible whatever you want to call it but this is the area that responsible for the break of this Structure so what
you see price do is sometimes comes back and provides us with long trades out of this area I'm not saying it's going to the Moon I'm saying it becomes a a good opportunity for us to buy so the long trades out of this area is going to be high probability because this is the area is responsible for the break of structure so as you can see here what we had we had a top break of intermediate Structure comes back sweeps the lows makes a somewhat double bottom and comes up higher and then it fails and
starts making our way move down to the unmitigated area now I'm not saying that it's going to play out like the solid time the price might keep going after tapping into this area responsible for structure break but we want to leave the unmitigated area for the future because shall the price come back into this area that's where going to be a lot of good Longs if we are still in a bullish trend on a high time frame if this is a bullish stage and it is because we we broke this high and we established that
this is a now a new high so now what we looking is coming back into this previous area of price action and this is where we're looking for our Longs so here we have 30% 50% and 70% % so 30% lines up with this area responsible so this becomes a very good area to buy and hopefully hold It for the longer period of time but if we reverse and break this area responsible then we anticipate to price trade back to the origin to the move origin and if it's unmitigated this move origin becomes a high
probability area that most likely or not it will become a good opportunity to long and again it doesn't have to go break everything up but this is going to be a good opportunity for the long trades this is how we want to pick our areas because we Don't want to just trade anywhere right we we don't want to start chasing this at the top of the range we want to wait for the price to come to the area and then on the lower time frames we're looking for the setups for that reversal pattern on the
lower time frames but because of the structure this becomes a high probability areas where we can be looking for Longs so as soon as we violate this area I'm looking for this area here and if we trade and close below well we broke the high time frame Trend and now we can be looking for shorts but the main components we have the move origin and we we have area responsible for the structure break these two areas become very high probability for us to take Longs out of it and depends where they place in the range
we can get clu right we have 30% 50% 70% so 70% of course is the biggest discount here right so the Biggest discount is where we want to buy our Longs we don't want to buy them in a premium but we understand that we can still buy them in a premium because this area responsible again this could be just a quick scalp here and depends what time frame you you trading this could be quick scalp or this could be a whole day trade this could be weeks of of trade the trade could go for months
depends which time frame you you're trading so after this breakout we anticipate price To come back to our point of interest to our important areas that we marked out before and once they coming there here we can observe what price is doing and a lot of times the price will print this pattern we have a tap break the structure come back provide double bottom for the longer continuation to break this this other high here and again it's not going to look the same all the time but here Here's a schematic for that pattern so we
have initial break of structure right and this is the area here that responsible for the break of this structure so now this area becomes an important area and you can see there's I marked out there's order block so the last down candle that becomes a an order block an Institutional order block whatever you want to call ICT or reclaimed order block it doesn't matter It's all the same you marked out this area and you see what price is doing okay we bounced broke the structure that's a quick sculp well bounce break a structure coming back
double bottom continuation if you see this pattern in the important area you have to identify the area first you can't just look for this pattern everywhere this is where the narrative comes in that's what's most important that's what the Holy Grail is the Holy Grail is not into in ICT Concepts or Dave Concepts it's it's not there the Holy Grail is in understanding what price is going to do next what is it doing right now it's understanding what price is doing and understanding what you're doing do you know what you're doing are you chasing this
upwards do you know that you you need to identify this area and then find Longs in the area do you know what you're doing because if you don't know what price is doing and and if you don't Know what you're doing that's gambling and you're going to lose all of your money I'm going to tell you that right now the same as as if you just watch this video or you watched the Dave playlist and you got excited and you started trading and it didn't work and you lost money what are you doing exactly you
don't know what you're doing get profitable in a demo first and then tell me that this is doesn't work because it works it works for me works For Dave works for a lot of people and you trading this not even realizing that you're doing this you're trading the market structure and you're saying that it went up because of the news or it went up because of Jerome power okay it went up because of structure because of previous structure that gave a narrative here's another schematic where we have a trend going up we broke the structure
and we anticipate a move down into the area you see there is a 30% 50% and 70% Of this last move down before price broke higher we building this trend line liquidity and you can expect after this first break this trend line liquidity getting ran all the way to the origin of the move but you're not going to believe me until you back test this you need to pay attention what the price is doing why once it gets to your area one day it starts coming back into that previous swing what is it doing in
here this is what you need to study and Understand what price is doing once again to the origin of the move once getting to the 30% 50% 70% and this is what Dave teaches in his private mentorship teaches deeper understanding of how price moves in between the swing points what kind of order flow is here what kind of order flow is here and here the rabbit hole goes deep but until you understand the foundations and and you're not profitable with Foundations it's not going to work it's not going to work you need to drill into
your hand here's another schematic I'm going to reinforce some Concepts we have a breakout here right we broke out broke structure here so now after we break the structure we anticipate a comeback into this area the last move down before price went up so we had this move origin origin of the move and price never came back this is unmitigated as you can see price built this snd Responsible this area responsible for the initial Market structure break so what we did we came back into this area right printed our pattern and we took out long
broke this High the while we were getting to the long this is the area responsible for this break so now when we're reversing I'm watching this area because this if we start invalidating this area and we close below it that's a good sign that we might be going for these lows And then going to the these lows and because we're in bullish stage and this area is unmitigated I'm expecting a bounce after this brokes I'm expecting a bounce here and I'll be watching for the price to bounce and if it doesn't give me like pattern
like this on the lower time frames I'm not going to buy it so if you want to get an early indication of the trend is breaking monitor these areas that are Responsible for something responsible for the break there is a move origin for this trend this is a move origin so here you could be watching for the bounce and if we don't have a bounce you you look for the next area which is the origin of the move H happens to be unmitigated and this is going to be a very uh High likelihood that price
might Bounce from here you want to anticipate price coming to you and the bigger time frame the longer you're going to wait for the Price to come to your important areas so with that being said let's explore some rules and some simple uh trading rules that you can back test and and go look into your charts and and try to try it out on the demo on the Demo First like get profitable on the demo first I can't stress this enough because as ICT says if you ignore the demo you're going to hinder your learning
experience because you don't know how to first of all you don't know how to trade and second of All you don't know how to manage risk so what do you think is going to happen in a with live funds what do you think is going to happen exactly what do you think people be asking me like uh are you going to buy when when we tap into the 30% or 50% and you just going to have a limit order there or something I might but after this pattern plays out what do you think what do
you think I'm going to do just put put my risk and just blindly buy because it just got to Some FIB level no there is should be a narrative and rules behind you entering a trade so here's simple list number one liquidity sweep right so this this is assuming that we are in a bullish stage right this is all assuming that we are coming back to the important area assuming that you already identifi that this is important area you already identified this is a move origin and you want to buy you want to be a
buyer in here only after we have a A nice pattern a nice reversal pattern play out so number one liquidity sweep you want to see when the price come in into your area and and starts reversing you want to see some low getting swept so this low was was getting swept and probably you know there is imbalance in below it again everything works ICT fvg whatever inverse fvg could be who knows but then the important part we want to sweep some kind of internal range liquidity first because that's That's where the retail stop losses are
they they keep trailing the stop losses on the trend so we swept the lows that's number one condition number two condition tap into the Zone below so what we usually have is the consolidation on top of the zone you can see we we consolidating on to then we broke it and tapped into the Zone below which is our important Zone then we have a reversal pattern right this is our reversal pattern and we want to enter at Number three and the pullback after this high is broken this is where I would maybe put a limit
order and if I'm not even comfortable with this I will go even into the lower time frames and look for the the same pattern on on a lower time frames and reduce my risk even more and I'm not any more risking this whole thing I'm risking just this little lag in here stop loss below this low so that's already could be a first trade you can take at the reversal pattern but If you want more confirmation you're looking for the violation of the snd responsible for the break of the low so we broke this low
we didn't break this low we broke this low and this is the area responsible for breaking this low so if we violate this area it gives us a clue that we going for this high it gives us a clue that this bearish trend is most likely is over and we already got a indication that this trend is over because we had this bullish flip and This is extra confirmation that price is going higher and it could be another entry here another entry here and goes up but this is only going to work if you understand
the high time frame bias where the price is going are we bullish or bearish on high time frame and it's all the same and I'm not really showing you anything different that you're already doing I'm bringing you attention back to the market structure and your setups are only going to work within the Framework and Narrative of what high time frame is doing so here you have the breaker right you you got the the ICT order Block in there reclaimed order block here or whatever fvg in here trend line liquidity right there there is a bearish
market structure shift there is a bullish Market structure shift another breaker right maybe breaker and unicorn or something there's Elliot Wave 1 2 3 4 5 Elliot wave it's all going to work the trend line right trend line break retest Of the trend line goes down everything works if you can understand where the price is going and then you need to understand what you're doing if you have both you you're going to be golden if you know where the price is going and you know what you're doing you know that you're not going to be
impulsive right you you have rules for the entry you know how to manage risk if you have both you can analyze the trend and you can manage the Risk you're going to be a great Trader but without understanding The Narrative this is not going to work because you you might getting bullish at the wrong place at the wrong time you know maybe you start getting bullish here because we tapped the gain into this unmitigated area maybe you start longing here and then you're upset because you get stopped out that's not understanding what's going on on
the high time frame and all the problems are going to be Solved if you can understand what the high time frame is doing so you don't get tripped up inside the intermediate Trend let's do a top down analysis of NASDAQ and let's see if we can find some trades in here right but uh let's start from monthly so what we have here we have bullish trend on monthly right we have pullbacks new highs new lows and uh see that that candle didn't close about the high high so we we keep Going higher new high right
new low new high close below new low right and we keep going lower it's a high low and now we have closed the bow now we have this High over here so this is what is going on on um monthly time frame right we came back down and that this is intermediate Trend inside the monthly so we have this area this is is also the origin of the move right and we now we came back into it we came back into that origin of the Move right so now what are we looking for we broke
this intermediate Trend now we broke this intermediate Trend we're looking for the reversal inside here right is it going to reverse down and maybe test this area the previous area of price action so shell it turn turn back down we going to here into this area so we're trading between these two right now the last move down before price made a new high intermediate high right so again we Haven't made a higher high yet although I'm bearish on the market I mean I I'm not denying that we can just keep going higher I'm not denying
that because we we still on a monthly you know we're still in this trend I'm not denying that I'm just saying that we might turn lower before going higher which would be a nice healthy movement this area never been mitigated right this is unmitigated area so if area is unmitigated there is a likelihood we Coming back there and this is where the the smart money you know will be accumulating you know do you think the smart Mone is buying here or would they want to have a lower prices I'm not denying the fact that we
might keep going higher and uh there is another quote from Dave I adopt that is uh trade what you see and not what you think so while although I might think that we are coming down to this area I'm going to trade what I'm seeing on the chart I'm Not going to just short it here and wait for this area because I don't know nobody knows we just want to follow the structure right this is the structure right now this trend the big Trend right the big big trend is broken so we had the intermediate
Trend brought us down here and now intermediate Trend broke higher and now we run into this area responsible for the break also a move origin so this is where we are on the Monthly let's submit it to the weekly and let's see what what we have on the weekly so this is a bigger Trend I'm going to delete this this is intermediate trend we had like this right we're just following candle closures highs and lows all right there's another candle closure high and look at this we broke below the protected low below this last swing
low so this is a market structure Break and this is a coming back into the area it's coming back into the previous area into the swing up before the price shifted lower so what I'm expecting is this I'm still going to be trading what I'm seeing but what I'm thinking is this I'm expecting the price to turn lower because we are in a high time frame area rejecting in a high time frame area and now coming back down I believe so this is my analysis again not Financial advice but this this is what I am
seeing On the chart so important thing here is that we broke the structure so we anticipate a pullback right there is an F withg in there you know there is an F with G we we ran into that F withg we ran into the order block there is an order Block in here right it's all confluences stocking upon each other right it's all the same thing but where we are where we came from right so this is not bullish yet I mean The trend the intermediate trend is bullish but if we want to you know
have a higher highs continue we want to close about this High come back in the area and continue so far we're not doing that so far I'm seeing reversal on the weekly chart and now probably we're going to this area first which is responsible for this break so this area is responsible for this break and if we give up this area I have an indication for us to dig in into This previous area and there there is a move origin but move origin is is you know it's been mitigated this previous area been been hardly
mitigated and especially this one that's responsible for the break that one is not mitigated area at all so most likely or not we're coming to 13,000 on on NASDAQ and then we will see if we can continue higher or not so let's keep zooming in into the daily there is the Daily it's the same Trend and see a lot of people think right now we are bullish because because we broke this intermediate Trend but what's important that we broke this trend right we broke this so because we broke this this is becomes a pullback to
get in short so what we have is is this pattern right it's the same pattern all the time break of structure comes back short sanar bull Market's over so this is my projection For the NASDAQ to keep going lower look this is intermediate Trend in here up down up down this is intermediate Trend in here it starts breaking this is broken here and then it comes close below the protected low this is not a protected low in here because this low came from intermediate high this low came from high time frame High created High time
frame high this High time frame High came from this low from the high time frame low and this Low is all the way here so this is becomes a market structure shift and this is why I'm I'm so bearish right now and I think we we we just ran into this previous area of price section over here and this is why I think we we we starts going down now but uh of course we can still go up a little bit and then go down I don't know I'm going to be trading what I see
and that's why I like to trade lower time frames and you know even uh 5c 15 second time frame and and Have a guide with uh 1 minute as a My High time frame order flow and high time frame bias so let's keep zooming in into let's say 1 hour there's 1 hour what do you see on 1 hour we we have a break of structure right on 1 hour let me delete this too well we we know we are in the distribution zone or whatever you want to call it but we have this trend
right we were making lower low and then we reversed so this is a bullish Trend now this is a bullish stage so we came back To the previous area of price action and we bounced from 70% here you see that we bounced from 70% of the previous lag they moved down before the price broke higher so we came broke the area responsible for the break and tapped into the UN mitigated move origin this is the move origin and we tapped into it and mitigated it right we we tapped and fill this imbalance sweeping the lows
right there is your trade that that I was Describing the same thing there is the setup on the chart we have a mitigated area over here this this like this almost stopped into 30% so I guess this is still unmitigated or whatever but uh that's not what important I want to see what price is doing inside here so if we zoom in here you can see the price swept this liquidity tapped into this imbalance and skyrocketed this was enough for the price to tap into the area mitigate it And go higher right once you see
this happening you start looking for the bullish flip so we have low high low high is broken and another low and then eventually this high is broken so this is a intermediate bullish flip on the one hour and we are following the daily order flow right on a daily this is a bullish intermediate Trend right over here so we we had the high low and high was broken Close closure about see the green candle closed above the previous high so now we are bullish so when we coming back down into this area we understand that
this lines up with 70% of the previous swing down so again swing down before the price makes a new high after closing about this High we have price coming back all way down to the 70% and when we zoom in into the 1 hour there is that move origin that's coinciding with the 70% and we have that fvg and we have that top into the previous Zone if we're following our rules we want to see liquidity sweep tap into the Zone below reversal pattern violation of snd and Target high so we're following the same rules
we have the liquidity sweep tapping into the previous area of price action also have a imbalance which is even more Confluence and we have a reversal pattern here right it it flipped bullish Over there and came back into the previous price action area here you see that this is was the area responsible for the break of this structure so this area becomes important and now this area in here can be used for the bounds higher and then we we established another area on top of that we tap into it there is a closure about there
and we skyrocketed taking out these highs if You want to look for the snd responsible for the break you know this this over here is the hidden uh you know fractal on the lower time frames this is going to be a supply and demand Zone and you know that the that wck like that you want to focus on the last move up before price breaks the low so as you can see there there was a move up there you know move up there there's a move up there before breaking lows but that's essentially over there
that that was the Area responsible for breaking these lows over here and this is area responsible for breaking this low so I mean you can use both and see once we traded above that area that's also was a market structure break because we closed about this candle so now the stage is bullish and we're looking for the bullish setups inside important zones right we want to identify important zones cuz you know a lot of you probably wanted to wait for the 50% but he never came back he just Came to the area responsible for the
break of structure and SK I rocketed higher so there that could be a trade on 1 hour this is a one hour setup the high probability setup because we understand that daily is bullish and one hour came back sweeping these lows you know a lot of people going to be screaming like oh my God this is a break of structure we going down and we're going to you know uh Reverse but they not understand that this is a bullish Market structure flip and we only coming back down to go in higher and where we came
down we came down all the way to 70% 30% 50% 70% that's why you don't want to just blindly buy at these levels yeah they might provide some push up you you know little little sculp maybe but ultimately you want to wait for the flip to occur you want to wait for the market Structure flip and then you buy so where to buy this when the price broke the structure and came back down to test the same structure that's where the best opportunity lies so this area now we mitigated this this this lag is mitigated
we came back and test this 70% and we broke out higher right so now we have this area right the last move down before price broke higher so now we coming back down Into this area so again if you don't know what's going on follow the market structure so after we broke out right this is an intermediate Trend right so we we started here uh there there was a high that's broken low over here and now the high is broken we keep going until this high is broken uh there was a mistake there but okay
another high and now we have a shift you see the shift and now we going lower and now we have another shift so We had a market structure shift in here came to the 30% right we came to the 30% in here and reversed so are we going for this high now I don't I don't know we might I don't know and I I really don't care if it bounces or not I'm looking for the opportunity and if it starts bouncing and starts reversing uh this might be a a good buy here right this might
be a good buy but now we need to watch for this if we start Reversing below here then probably we're going to move origin right in here right this Zone in here after we broke broke out in here right this is a low high low lower low and we broke out there is a gap in there of course and most likely we're going to fill this Gap and if we can't bounce from this area well we we going lower okay if we can't flip this area we we already have a flip but we can still
flip back Down because like I said in between the high and low high time frame daily high and low the price can do whatever it wants and we we can follow it on the lower time frames and this is how we follow it so if we break this low in here I would expect price to come back and and start filling this in mitigating this and shall we go down lower there is these lows that could be swept and this is right 70% is is right at this fvg below this consolidation below those Lows this
has becomes very attractive Target for for retail to get liquidated and for the smart money to accumulate positions so if you trading the high time frame this is what you're expecting You're Expecting see now we have a bullish and price will probably come back down to mitigate this area to the move origin and after it comes back down to the move origin we looking for the pattern here to play out to reverse And then we enter on the lower time frames for trying to get out take out this high right this intermediate High then we
hopefully going for this High well first of all we need to break this high and then this high but the trend is bullish and we understand that so our Target is highs and when coming price coming back down our anticipation is reversal pattern and that's where our entry lies to get in and attack these highs hopefully this Video going to bring you even more clarity uh as far as how to understand the market structure again if you want a deeper understanding I highly encourage you to sign up for the Dave's Discord and to go watch
his uh free playlist uh first I'm going to leave you with this a simple pattern and go and back test this pattern because only through the back testing you're going to gain the confidence and you're going to train your eyes and your subconscious uh to Anticipate this p PN to see this pattern play out in real time and that's that's only the one way to learn you're not going to learn by me telling you where to get in and where to get out okay if you have questions and if you have charts for me to
look at just comment on my posts uh on Twitter and I will try to respond you can comment in here asking questions as well I will try to respond to everybody but with that being said guys uh thank you very much again for Watching the first video blew up uh over 50,000 views uh in one month uh I couldn't be more grateful I I really just want to share my experience as a Trader and help uh everybody who uh actually want to trade for a living and actually want to be become a profitable Trader I
believe together we can solve this 95% uh Traders lose problem and this is just untrue the trader loses because of their mentality and their psychology and Because they don't know how to apply the concepts and indicators uh to to their trading and they get frustrated and they they start blaming something else besides themselves and and that's really why Traders lose is because they don't know how to think properly and thinking properly is is harder than you think I probably will make a a third video following up on the trading psychology and uh with that being
said guys thank you very much for watching if you found This video helpful consider sharing with other Traders and investors like I said this works on high time frame also and you can be a a killer swing Trader with this thank you for watching and I will see you in the next one stay safe