[Music] Sleepless nights. 15 indicators glowing like a casino ceiling. Three different self-proclaimed gurus yelling contradictory advice.
Buy, sell, hold, yolo into some meme coin. Absolutely zero certainty, just noise. I lived at chaos.
I was the trader, hunched over charts for 6 hours straight, secondguessing every move, bleeding capital, and losing my grip on sanity. One bad trade didn't just cost me money. It cost me confidence, clarity, and time with the people I love.
But I clawed my way out. And today we are burning that noise to the ground. I'm handing you the one Stoic trading system that set me free.
A system so simple, so repeatable, it's like a mental reset button. Plus, I'm giving you a printable PDF checklist you can tape to your screen, to your wall, wherever you go, to your mirror, so you never second guess again. By the way, if you want more than a system, if you crave weekly trade breakdowns, price action deep dives, and a tribe of like-minded people that holds you to elite standards, visit stoicedge.
com and join the Stoic Traders community. No fluff, no hype, just results. Welcome to the one trading system that you will ever need.
This isn't a sales pitch, a hidden pay wall, or some mystical seven color indicator promising all the riches. This is a framework forged in the crucible of real capital, tested throughout gut-wrenching drawdowns and sharpened by accountability to a community that doesn't tolerate excuses. By the end of this video, you'll have a system you can execute tomorrow, a checklist to keep you grounded, and a mindset shift to cut through the market's chaos.
So, let's get to work. Complexity seduces. It whispers more confluence equals more certainty.
But it's a lie. Fancy indicators or over complicated setups don't deliver clarity. They deliver anxiety.
I used to stack my charts with every tool I could find. MACD, RSI, Ballinger bands. I learned all the trading setups, all the trading concepts.
ICT, supply and demand, Wolf, Elliot wave. I think I've studied almost everything known to man about trading. Sometimes my screen would look like a NASA control room.
But more data didn't make me a better trader. It made me a slower, more confused one. Marcus Aurelius, the Stoic philosopher, wrote, "If it's not right, do not do it.
" Relating this back to the market, if it's not simple, do not trade it. If it's not repeatable, do not trust it. This system is built on one time frame, one market bias, one setup, and a binary outcome.
Win big or lose small. That simplicity creates a mental vacuum where discipline can finally breathe. It's not about being fleshy.
It's about being effective. When you strip away the noise, you are left with stillness. And in that stillness, you find the confidence to act without hesitation.
That's what we are building today. Picture an archer in a silent forest. He doesn't carry a quiver of half-hearted options.
He draws one arrow, aligns one shot, and releases with absolute focus. That single arrow carries a precision the crowd can't match. Inside Stoic traders, we worship this minimal creed.
Simplicity leads to clarity, which leads to consistency. Simplicity means fewer decisions, fewer mistakes. Clarity means knowing exactly when to act and when to stand down.
Consistency means stuck in trades that compound over time, not random bets that evaporate. Today, we are planting that belief shift, that paradigm shift. You don't need a dozen tools to win.
You need one system you can trust. Now, let's stir into the abyss. The complexity tax.
Every extra indicator, every impulsive news headline, every hot tip from a Discord guru adds a cost. Not just in dollars, but in three currencies that matter even more. Number one, time.
years spent chasing the next holy grail, experimenting with tools that promise the world but deliver nothing. How many hours have you burned tweaking setups and your system instead of executing the trades? Number two, capital accounts reset to zero like a cruel video game death.
I've been there watching a promising setup turn into a margin call because I trusted a cluttered chart over a clear rule. And number three, your sanity. Confidence diced into micro losses that bleed into every part of your life.
Doubt creeps in. You snap at your partner. Skip the gym.
Lose the sleep. The market doesn't just take your money. It takes your peace.
Complexity isn't neutral. It's a tax on your future and the bill comes due faster than you think. Meet the market's favorite donor, the DJ gambler.
He chases dopamine spikes, screenshot his wins, hides his losses, and funds influencer Lambos with every impulsive trade. is addicted to the rush, to the result. Every tilt trade, every I'll double down to recover moment rewires your brain for fear, revenge, and self-sabotage.
I've been that guy, blowing up accounts because I thought I could outsmart the market with grit and gut. Spoiler alert, the market doesn't care about your grit or gut feelings. It doesn't care about your intuition.
It doesn't care about you at all. Let me ask you this question. How many more tuition payments will you donate to the market before your dream of financial autonomy goes bankrupt?
The choice is yours, but the clock is ticking. So, what changes when you commit to a bounded system? Well, it changes everything.
Here's what you gain. You will gain decision speed. You check the market environment.
Is it ranging, trending or expanded? And you either strike or stand down. No overthinking, no paralysis by analysis.
You are in or you are out. You will also gain statistical clarity. Every trade is a part of a sample size.
You are not chasing signals or hot streaks. You are building a data set where expectancy which is your edge replaces hope. You also will gain emotional stability.
Confidence grows when you follow rules not stories. Losses sting less because they are planned. Wins feel earned because they are systematic.
And finally, if you follow just one system and stick to it, you will gain scalability. Once the system is muscle memory, scaling up is just a matter of increasing your position size. No guesswork, no mystery, just math.
This isn't theory. I've seen traders in our stoic traders community go from scattered to surgical in months simply by committing to these principles. And you can too.
Inside Stoic Traders, we don't overwhelm you with content. We sharpen one blade from multiple angles. A system without review is a sword without a wet stone.
That's why we journal every trade, grade our execution, and refine weekly. Win or loss, rule following is victory. If you follow the system, you won.
Even if the trade lost. Rule breaking is debt. Every deviation from the plan is a loan you'll repay with capital or confidence.
Discipline compounds faster than capital. Your journal is the ledger of that compound interest. I review my trades every Sunday and it's like a mirror showing me where I'm sharp and where I'm sloppy.
Start journaling today. It's the habit that separates amateurs from the elites. Before we dive into the system itself, here's your first step.
The first link in the description is your stoic system checklist. You can print it out, tape it to your monitor, and remember that guard rails outperform raw willpower every single time. The checklist is your anchor, keeping you steady when the market tries to pull you into chaos.
Grab it now and let's move on to the system itself. All right. So, here's the complete Stoic trading system.
I put this system together myself and actually inside of the Stoic Traders Group, I teach you how to build your own trading systems. So, you can use this system or you can actually put together your own trading system. There is nothing special about it.
And don't let anybody to tell you that they've discovered some special trading setup that is superior and this is the only trading setup that you will ever need. There is no such a thing. It's very easy to put together your own trading system.
And I used multiple concepts here to put this one trading system together. And the only indicator that we're going to be using is the 20 and 200 simple moving average. I use the MA ribbon indicator at pulling up different moving averages.
And as you can see, I only have two moving averages selected. These are simple moving averages. So I'm not using EMA.
I'm using the SMA, which is the simple moving average. That's all I need. I don't need extra calculations from the exponential moving average.
I just need the simple moving average. Keep it as simple as possible. I don't need these values.
Wait for time frame closes. Yes, that's good. Chart time frame.
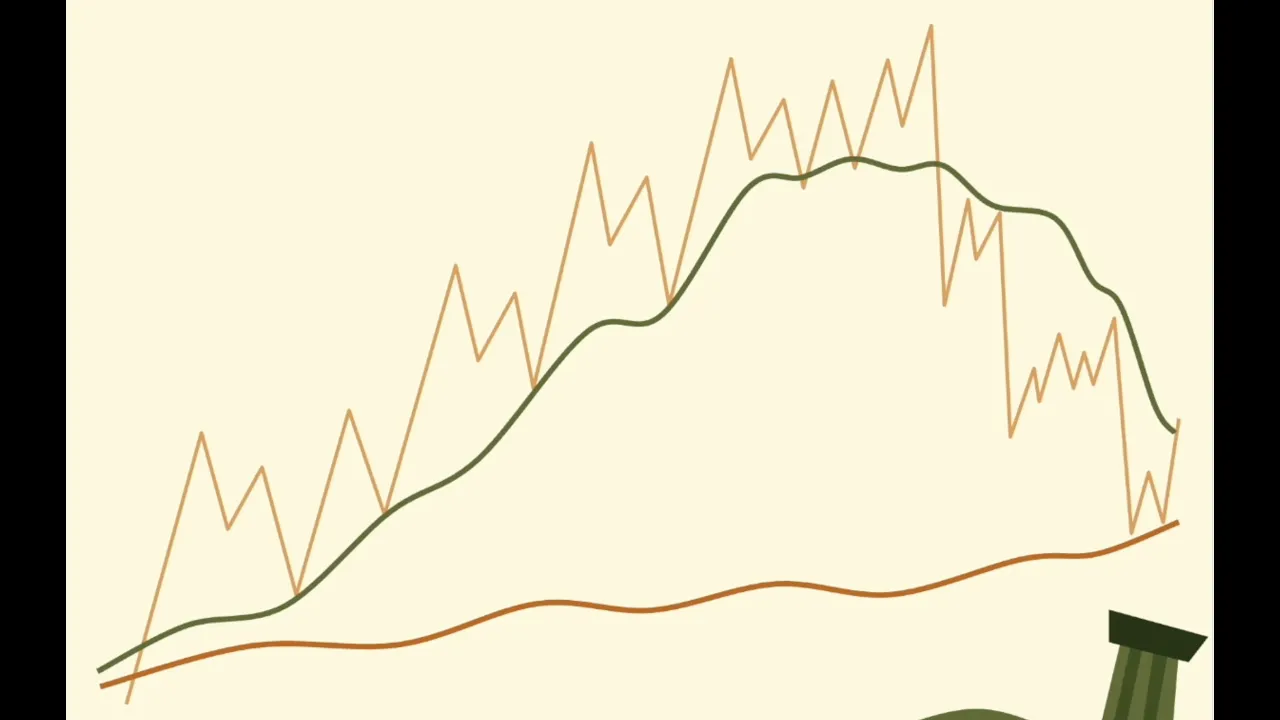
Don't change this. Just keep it as simple as possible. And the beauty about this is that 20 and 200 simple moving average are telling us where the trend is going.
This is currently on a daily chart. we can easily see right away what the chart is doing. So, it's either going to go up or it's going to go down.
And the simple rule is that if the price is above both moving averages and trending, the rule is that it most likely will continue to trend in that direction. It's like a self-fulfilling prophecy because the market is the culmination of buyers and sellers. It's a mass psychology.
So the more people see market go up, the more likely it will continue to go up as a self-fulfilling prophecy. The more people see the market is bullish, the more bullish people going to get and attract more people that going to be bullish. So just a very simple principle here that if the market is trending the most probable scenario is that it will continue to trend.
So as you can see here we have been trending right and now recently the market has broke below the 200 simple moving average and immediately you can tell the market is bearish right you don't have to go through the gazillion steps just to determine the bias of the market what is market is doing as simple as looking at the 20 plus 200 simple moving average and analyzing where the market is going. Well, the market's currently going down. This is so simple that you can teach a 5-year-old to analyze the market.
Okay, so let's go back in the history and see how this played out. So during the Biden administration here, the NASDAQ, as you can see, once we got below the 200 simple moving average, we had one more pullback into it, rejection, and the market stayed down in the downtrend, right? Trending down until it flipped bias over here, right?
when the market broke down below the 200 simple moving average. It took whole year to get back above the 200 simple moving average and you can see that break and retest which is flipping the moving averages. I'm not just talking about the crosses.
I'm talking about the behavior of the price and how the price got above the 200 simple moving average and stayed above 200 simple moving average. Not all the time breaking below the 200 simple moving average will mean that we are in a bare market but it is a warning sign. If we go back to the COVID, this is what happened during 2020, right?
The price went down, broke below the 200 moving average, but then we got above the 200 moving average and stayed above it. And the price continued to bounce here at the 20 simple moving average. And you can see how the 20 simple moving average acting as a intermediate trend and the 200 simple moving average acting as a bigger trend is a more long-term trend.
Right? So currently right now we are below the 200 simple moving average. So based on this simple logic, we're going to observe what happens when the price gets to the 200 simple moving average.
Right now this is uh also adjusted for contract changes. We can switch this be adjusted at the bottom of the chart and we can look that now the price is right at that 200 simple moving average. If we can get break above and retest then I would be expecting continuation to the upside.
But if there is a rejection here and price gets back below the 20 simple moving average I would expect continuation down. So just a little analysis here on the daily chart using only 20 and 200 simple moving average. So we'll see if history repeats.
But the next component of this trading system is a pullback to the 61. 8% of the swing. So as an example, let's take a look at this move down, right?
It was a sharp move down where the price broke below the 200 simple moving average. This is where the move started. And inside of the Stoic Traders Group, I dive deeper on how to identify the proper beginning of the swing and where to anchor the fibs.
But here, this is where the move started. So if we take the fib from the start of the move, from this high, the high that's responsible for breaking the low, right? We take that and drop it down to this first low.
You may notice that price never retrace to the 618. This in here is the 6. 18%.
And all I'm doing is just using the normal fib retracement here. So you can see how this price went down but never retraced to the 618. So I consider this as not mitigated meaning that price hasn't retraced into the 618.
And if it doesn't do that on the first pullback, it might do that on the second pullback where we extend the fib. And you can see how now it aligns right about this high, which is a lot of people might say that there's liquidity there, but liquidity is everywhere. you got liquidity above each high, right?
So, the price went down and went up into the 618. And yet again, I'm not measuring from this because this pullback was shallow and didn't get to the 618. I extend this fib to over here to the low.
So, we're measuring this whole move down, right? Because over here we had move up, we had move up. So this is a pullback and this pullback failed.
It broke the low. Right? So where it started, it started from this high over here.
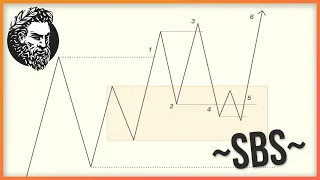
It broke the low and now the market structure has shifted and you can easily see that by looking at the 20 and 200 simple moving average. So another reason why I'm measuring this whole move down is because there is an SBS. For the ones who familiar with my content, you probably can see that there is a SBS.
1 2 3 4 5. And SBS is the manipulation pattern. It's something that plays out in a market over and over again.
And it happens after the break of structure. So first of all, this was a break of structure to the downside. We have a first pullback.
And what happens that a lot of times price comes back and liquidates these people that got in on the first pullback. So everybody can see this 200 simple moving average. And if the people are short, they will place their stops right above that first pullback because they think it's safe.
It's above the 200 simple moving average. But as you can see, price comes back just enough to sweep those first people and continue down lower. So this was a bearish setup here on the daily chart.
And just to recap this trade, first of all, it was a break below the 200 moving average. Second, it was SBS. And third, it was a 618 pullback.
That's all it is. And really, this is the whole system. All we need to do is to identify bias.
The price is below the 200 moving average, right? The best case scenario is when price is below both 200 and 20 simple moving average. Right?
But in this case, the price got below the 20 and 200 simple moving average. The bias was shifted and it was a one pullback into the 200 simple moving average and continuation lower. So once you entered at 618, the stop loss goes above the swing high.
So this is your stop loss. distance and based on the stop-loss distance, you calculate how many RRS you aiming for. You can also trail this price as the trade goes into your favor.
You can trail the price above these highs. Sometimes you'll get stopped out, but it is what it is. That's trading.
You can't make it perfect, but you can make your execution perfect. And that's what we do inside of the Stoic Traders community. So you know the system but you also need to have a system for yourself for the self-management because it's all about execution.
It doesn't matter what system you use. What matters is can you consistently execute that system because if you can't no matter what system you have you will fail. So let's keep going.
We have this breakoff structure right? This is also an SBS. 1 2 3 4 five.
Right. Again, those first people that got in on the short, now we got them liquidated here. This is a 45.
So, where this move started, this is the very start of this move that went down and broke this low. Don't look at the the little moves in inside it. Just pay attention to this trend.
We got the pullback, the new low, and now this is another pullback in here. So, let's see where that pullback has retraced. And we're going to measure from the start of the move to the low.
Big surprise. It's a 61. 8% entry.
When everyone is screaming we are going back to the bull market, the price is still below the 200 simple moving average. So people are very emotional and when you see that the price went above this high over here, people are going to get bullish and they say break off structure, we're going to the moon. But what happened here is the price didn't get above 200 simple moving average.
The price is still bearish. And this is how I can look at one time frame. I don't even use any other time frames.
I don't need to use higher time frame in order to find the trade on the lower time frame. I just need 20 and 200 simple moving average and that's all bias that I ever will need because during this time if you just had the 200 simple moving average on the chart you wouldn't be bullish here. You would be cautious and possibly shorting this because you realize that price got to the 61.
8% 8%. So that's a good short and then if you are not sure you can go on the lower time frames and catch it there, right? You don't have to trade the daily chart.
You can trade any chart you want with just 20 and 200 simple moving average and you will always know what is the immediate bias because you don't need to predict 20 moves ahead. You just need one move, right? You just need one pullback and that's it.
So here we got this thing went down didn't retrace to the 618 right on the lower time frames didn't catch the 618 not a big deal you can go down more this was a perfect trade and there is even a smaller SBS on the lower time frames there right this would be a great swing trade got a short stop about here and it goes into like 4R. This would be a beautiful swing trade on the daily chart or you go in into the hourly chart. And also this is an unmitigated move origin in here.
This is also I teach inside of the stoic traders but you don't really need that right now. All you need to understand is how to identify bias and get into the trade. So with 20 and 200 simple moving averages, you can see the clear bias.
So let's keep going here and see what happens when the price got above the 20 simple moving average. Not all the time it's going to have perfect pullbacks. Let's take a look at this example.
Right? This would be harder to catch, but if we measure from the bottom to the top, it almost retraced into the 618. Sometimes it will retrace into the 50%.
But also, you can see how the price is bouncing from the 200 simple moving average. So, don't just go in right away. You can wait for this first one to play out after the flip.
You can wait for the first pullback to play out and make sure that these resistance points become support and then you can start looking for the bullish moves. These are going to be harder to catch on the daily chart, but on the lower time frames, I'm sure this would be a nice setup here. Like on the hourly chart, the move started here after making this move origin act as support.
Nice pull back into the 618 and it continues higher. Sometimes you're going to have more difficult setups. Sometimes they're going to be very obvious like over here.
This was an obvious setup. One, two, three, four, five. There is an SBS.
You can learn about SBS on my YouTube channel. And also I dive deeper into the SBS setups inside the Stoic Traders community. This one almost retraced into the 618 as well.
Sometimes it perfect, sometimes it's not. But I'm looking at least into the 50% retracement and continuation higher. This was an interesting one here.
As you can see, we built this trend line. The price was holding 20 simple moving average. Then we broke below the 20 simple moving average and price went up higher.
So technically the move started here. We broke the structure. So this was 1 2 3 4 5 SBS.
And if we measure from the low to the high, this was a beautiful retracement here into the 618 and price continues higher. And then even bigger on this big crash that looks like a a market crash, but notice how we found support at the 200 simple moving average. So we can technically measure this.
It went deeper than 618, but there was still a nice SBS. This was 1 2 3 4 5. Absolutely beautiful bounce at 200 moving average.
and continues higher. If you missed this trade, there is another trade here inside. As you can see, the price holding about 200 simple moving average.
So, this is also a move up that broke structure to the left. And if we measure this move up, right, you have a perfect 618 retracement. And this is a daily chart.
It also works on any chart you want. I recommend five minute for day trading and hourly chart for swing trading and daily chart. You can look at any stock, any index you want to buy for the long term.
All you have to do is just buy and hold about 20 and 200 simple moving average. So now since we have this move down, right? Yet again, I'm going to be looking for the retracement just like I was looking during Biden administration.
We're going to see if we have a rejection here. This is now 618. This is also a bearish SBS in here.
1 2 3 4 5. Maybe we can sweep above and go down lower. Or if we can hold above the 200 simple moving average, I would be looking for the bullish price action and continuation higher.
But if we fail, it's going down. So here's the checklist for this trading strategy. We want to identify bias with 20 and 200 simple moving averages.
If the price is consistently holding above the both moving averages, that's a bullish bias. And if the price is consistently holding below the 20 + 200 SMA, that's bearish bias. Then number two, based on our bias, we are looking for the impulsive move in that direction.
And also we're going to be looking for SBS inside of that move cuz sometimes price will do that and a lot of times in fact price will print SBS. Number three we're going to enter on the 61. 8% pullback.
And number four, we're going to target two R, three R, 4R back test and see which one you like better. Each RR will have different win rate. They all going to feel different, but what you can do is you can back test all of them and see which one resonates with you, which one fits more of your personality and style of trading.
But this is it. This is the whole trading strategy. And I'm sure some will say, "Oh, it can't be that simple.
" It's all right. They'll keep hoarding all of these holy grail setups and indicators like talismans against invisible market gods. I used to be one of them, stacking tools until my charts looked like a circus.
The system you just saw, it's very simple, but it's not easy. It takes discipline to stick to one setup and to skip all of the shiny distractions. Complexity is a choice.
So is mastery. Which one will you choose? The stone gates are closing.
On one side stand traders who embrace clarity, accountability and a bounded system. And on the other side there are eternal donors trapped in the casino of chaos bleeding capital to the house. Hesitation is just another donation to the market.
Choose now. Commit to simplicity. Commit to discipline.
Commit to the Stoic trading system because your future self is watching. Download the Stoic system checklist from the first link below. Run the system for your next 30 trades.
Journal everyone. Grade your execution and return to this video with your results. When you are ready for more weekly trade breakdowns, price action deep dives, emotional audits, and a tribe that refuses to let you drift, visit stoicedge.
com and join Stoic Traders. Like, subscribe, ring the bell, and always remember, the only way is up.