hello everyone my name is PT and welcome back to testing indicators feeling overwhelmed by the Sea of technical indicators out there you're not alone but fear not because in this series we put those indicators to the ultimate test today's Target The Squeeze momentum a chart Legend used by over 880,000 Traders we'll unmask it Secrets test it across markets and see if it lives up to the hype want to see the results for yourself if you're new here don't forget to hit that subscribe button and join our trading Community let's get started let's dive in and
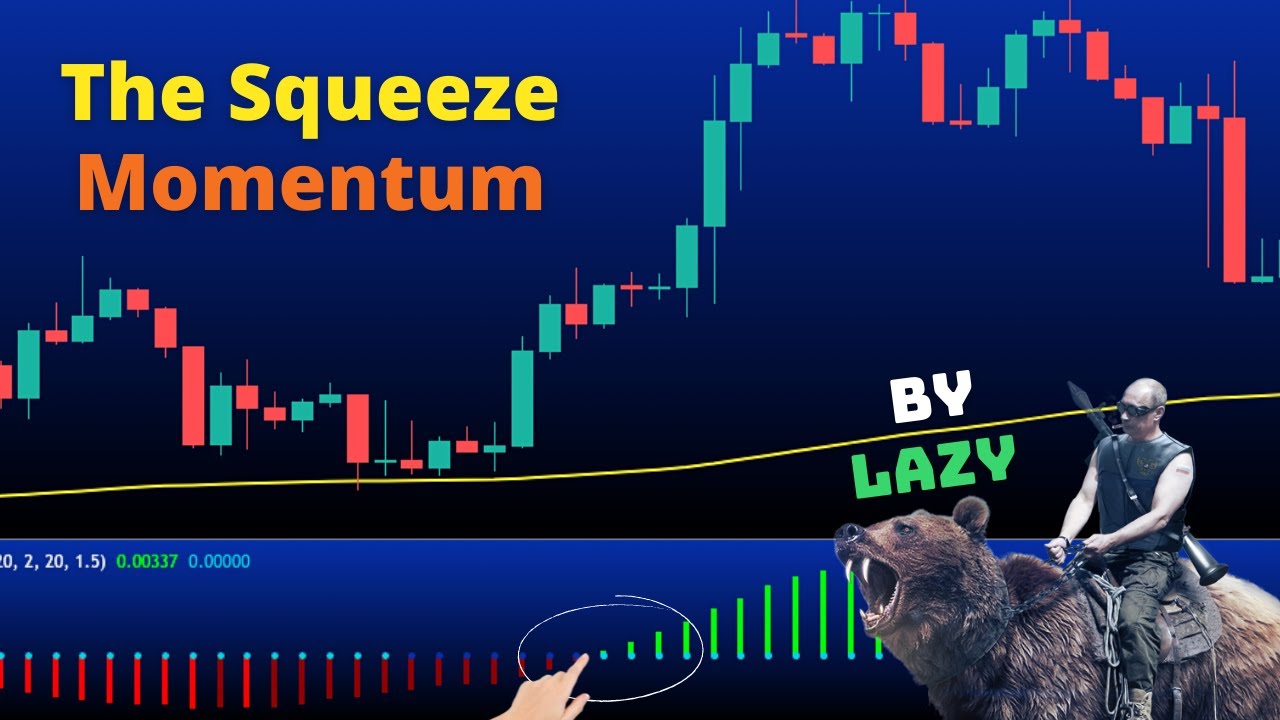
add the squeeze momentum to our trading view charts see that bad boy at the top The Squeeze momentum a free indicator from the awesome lazy bear thanks lazy bear just one click and it's on your charts I want to share something crucial with you if you're new to trading struggling with losses and finding it difficult I've got a secret weapon for you the fast bull AI signal imagine having a season Trader by your side guiding you with precise signals the best part it's free you can check out their complete track record with every win and
loss laid out transparently for you to see but wait there's more the premium charts you usually have to pay for on trading view are available here at no cost plus you can join the trading contest with a total reward pool of $22,500 where the first prize is $10,000 it's absolutely free to enter you'll also have have access to a chat box where you can connect with Traders from around the world fast bull also provides an economic calendar why is that a big deal imagine knowing exactly when Market shaking news is about to drop and being
able to predict its impact all for free fast bull has your back with the insights you need to make informed decisions I've dropped the link in the description don't miss out on this game changer if you're serious about your trading Journey now this indicator combines Ballinger bands and channels to basically tell you two things Direction and strength of the Market's move if you check out lazy Bears page and search for this indicator the Creator suggests using the gray dots for entry but after some testing we'll focus on the momentum itself to avoid missing potential trades
let us know in the comments if you'd like to see a future episode testing entries with the gray dots all right so this squeeze momentum looks like a straightforward momentum indicator green bar appears we buy long position Red Bar shows up we sell short position simple right but hold on is it really that easy to find out if this green and red light show actually makes money we need to backst it properly to do this we need three key ingredients first the technical system that's our squeeze momentum indicator second risk management rules because we all
want to keep our hard-earned cash right third testing conditions this is crucial for fair comparisons across different indicators now to ensure a fair comparison across indicators I always use the same testing conditions so we'll be back testing the squeeze momentum on three time frame 30 minutes 1 hour and daily we'll test it on a diverse range of assets from 2023 to 2024 data think big names like the EUR USD Bitcoin ethereum gold oil even theapple stock will The Squeeze momentum light the way to profits or will it leave us seeing red stay tuned to find
out scalping strategy that's perfect for beginners we'll be using the 5-minute chart for Bitcoin an excellent choice for those quick reaction-based trades first things first let's set our time frame we're going with a 5- minute chart for Bitcoin this time frame is fantastic for scalping because it lets you react swiftly to price movements which is exactly what we want next we're adding a powerful tool to our trading view chart the RMI Trend sniper indicator this little gem is going to make our trading life a whole whole lot easier here's how you add it head to
the indicator section open up trading View and navigate to the indicator section it's like a treasure Trove of trading tools find the RMI Trend sniper use the search bar or scroll through the list to find the RMI Trend sniper indicator found it great now click to add it to your chart with the RMI Trend sniper on your chart we need to tweak some settings to align it with our strategy don't worry it's super easy just follow [Music] [Music] entering a long trade first things first you need to spot the Buy Signal on your trading view
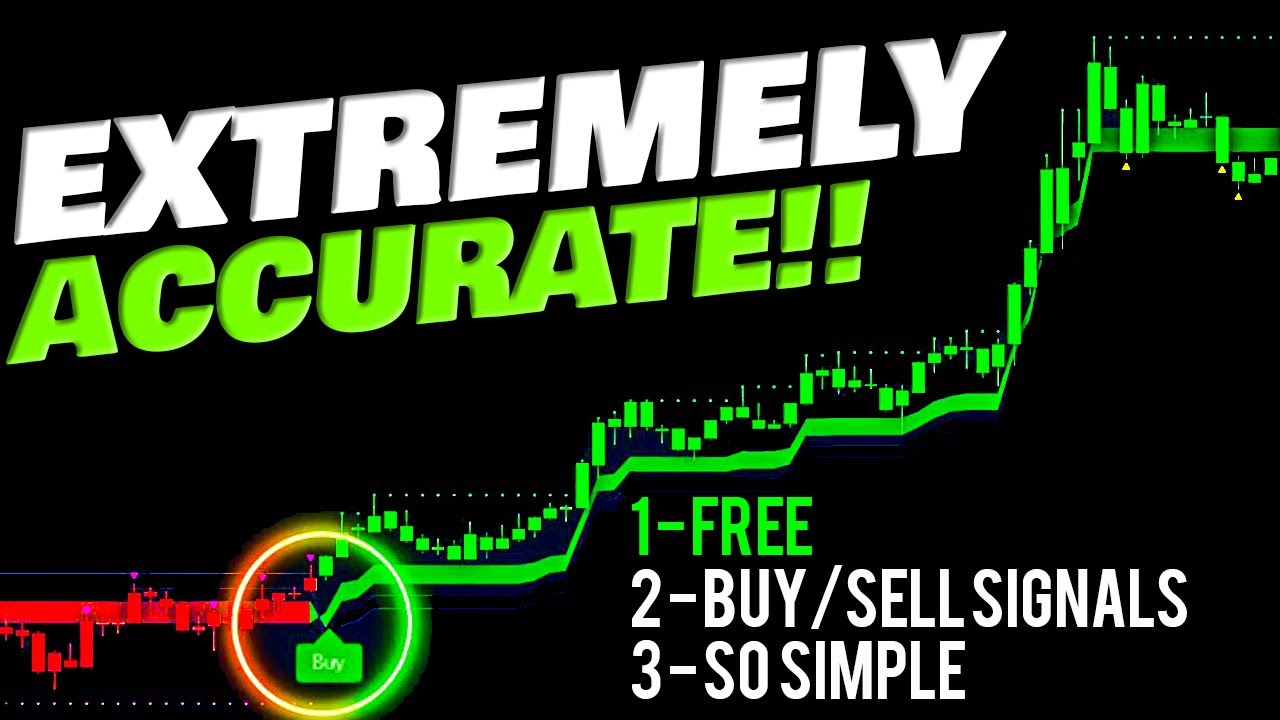
chart this is where our trusty RMI Trend sniper indicator comes into play when it shows a Buy Signal it's a potential opportunity to enter a trade but hold on a second don't jump the gun just yet before making a move check the squeeze momentum indicator for additional confirmation if it's showing green columns it means the market has bullish momentum in that case you're good to go if both conditions are met open a buy position enter the trade confidently knowing you've got solid confirmation set a stop loss protect your investment by placing a stop loss below
the recent swing low this way if the price suddenly drops your losses are limited now for the exciting part taking profits set your profit Target at two times the risk you're taking for example if your stop loss is $100 away from your entry price your take-profit target should be $200 away from it simple right let's look at at another example to understand this strategy better as you can see here the Buy Signal has been given by the trend indicator and a blue line has formed on the chart shortly after the momentum indicator has created a
green column signaling bullish momentum in the market enter the trade based on these signals we execute the trade set the stop loss place the stop loss at the recent market price low this safeguards your position in case the market moves against you target profit and managing stop loss our Target profit will be set at two times the risk so if your stop loss is $100 away from your entry your profit Target should be $200 away now to further protect our trade we will gradually Trail our stop- loss along the Blue Line This minimizes our chances
of incurring losses and helps us lock in profits as the trade moves in our favor by trailing the stop loss we ensure that we capture profits gradually while reducing the risk of a big loss this approach helps in maximizing gains and managing risks effectively [Music] [Music] when using this indicator on shorttime frames like 1 or 5 minutes your stop losses will be very tight this can be problematic with broker offer offering High spreads as even small price movements could trigger your stop- loss prematurely to avoid this issue I highly recommend using IC markets they offer
zero spreads on major currency pairs allowing you to execute pinpoint trades with maximum Precision click the link in the description below to join IC markets and start trading with confidence feel free to explore the custom strategy Builder and experiment with different indicator combinations to create your own trading strategies if you have any questions do not hesitate to ask in the comment section below

![🔴 [98% High Accuracy] RSI-COBRA Trading Course: Ultimate Advanced Strategy Revealed](https://img.youtube.com/vi/EbGK1FF2Q_c/maxresdefault.jpg)





![BEST TradingView Indicator for SCALPING gets 96.8% WIN RATE [SCALPING TRADING STRATEGY]](https://img.youtube.com/vi/2U5VTWBBK8U/maxresdefault.jpg)