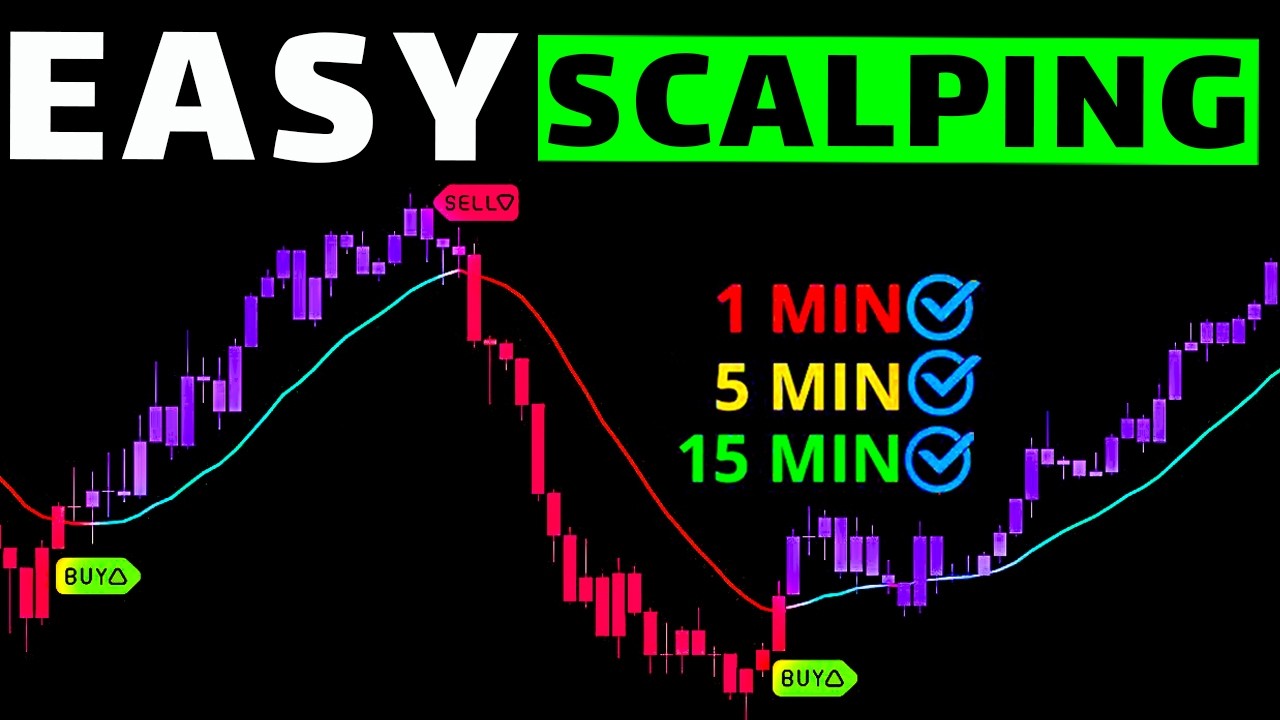
Hello everybody welcome to this video I'm thrilled to unveil a straightforward yet incredibly lucrative trading strategy that anyone can quickly understand and become skilled at once you've mastered this strategy you'll find that you won't need any other complicated strategies and easy to follow rules if you want to see it all stay with me until the end of the video first of all we will search super Trend V in the search box of trading view after that we have to click on super Trend V now we will modify the indicator like this to understand first of
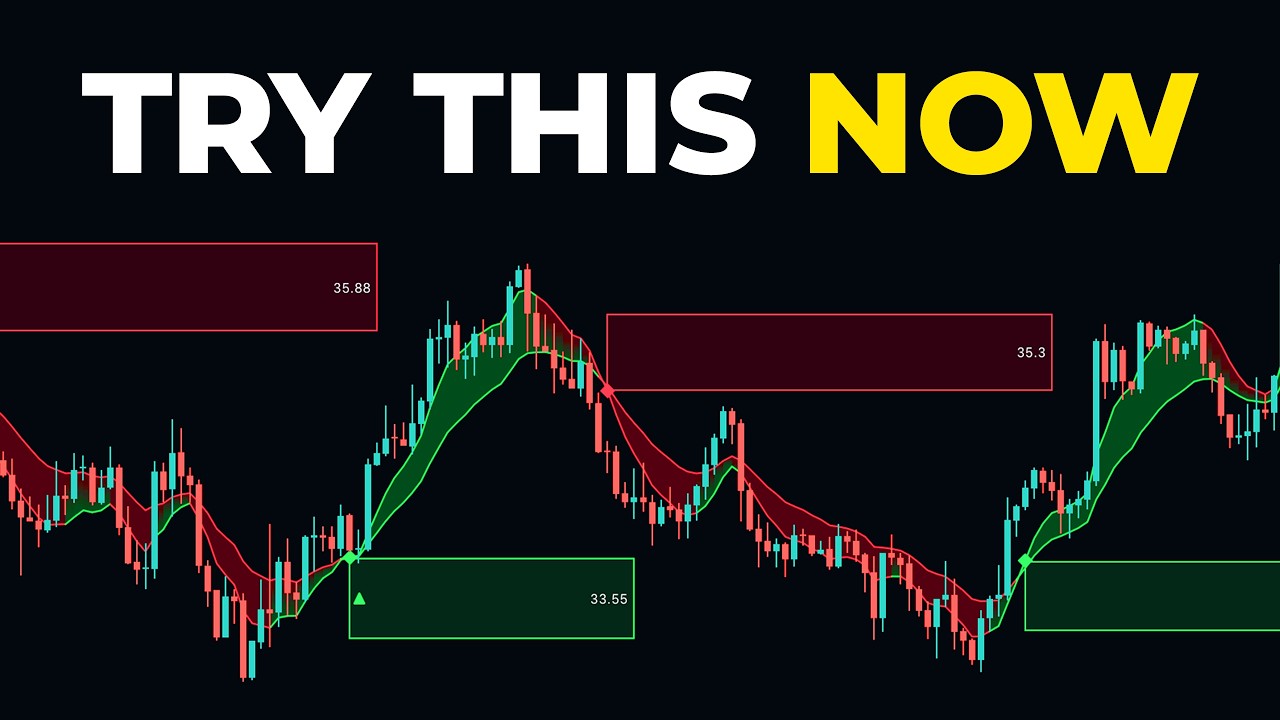
all go to style Tab and he fat increase the both plot lines and uncheck the super Trend options then now go to input Tab and here we have changed TF options 720 to 72 after we change super Trend multiplier 1 to 5 and here we have changed super Trend period 10 to 15 and last we have changed tp2 to four rest everything keep the same and now we will click on okay now we tell you how we want to trade with this indicator this indicator simply give buy and sell signals base on plot lines you
can see here this red and Sky color line called plot lines when super Trend indicator give by signal and market price break up side of both plot lines hence we have take only by trade look further sell signals when super Trend indicator gives sell signal and market price break downside of both plot lines hence we have take only sell trade now let's add second indicator so make this strategy more profitable so go to indicators Tab and search Ballinger bands plus now select this one and add to chart first of all modify setting click on setting
tab first go to input Tab and here we have changed simple moving average candle history 21 to 50 after we have changed home moving average candle history 21 to 50 now go to style Tab and here we have changed something see in this video now everything is right so we will click on okay first see how to use this indicator so hide the first indicator Ballinger bands plus indicator simply trade base on simple moving average line this white line called Simple moving average line when market price goes below the SMA line so we will take
sell trade similar when market price goes above the SMA line so we will take by trade now how to take trade with both the indicators and that is when the thing is going to get cleared first look at Super Trend indicator give by signal and market price breakup side of both plot lines and if we look at the second indicator here market price goes above the SMA line so we will take the by trade from the bullish candle looking the next example of short trade first look at Super Trend indicator gives sell signal and market
price breakdown side of both plot lines and if we look at the second indicator here market price goes below the SMA line so we will take the sell trade from the bearish candle I hope you must have understood this example of strategy if not then it doesn't matter we are going to see examples of test trades so that you will definitely understand now we will see sell trade on GBP JPY chart and 15-minute time frame first look at Super Trend indicator gives sell signal and Market break downside of both plot lines and if we look
at the second indicator here market price goes below the SMA line and now for the final confirmation there should be two bearish candle here you can see here that all the conditions have been matched so here we will take cell trade and stop losses will be placed above the SMA line and Target is 1 is to 1.5 risk to reward ratio let's see how to play out this trade we can see that this trade does not reach the Target and stop losses this trade is easily hit the target I hope you must have like this
trade now wait to next trade here's C Gap by trade first look at Super Trend indicator give by signal and market price breakup side of both plot lines and if we look at the second indicator here market price goes above the SMA line and now for the final confirmation there should be two bullish candle here so all our conditions are being fulfilled so we are placing an order to buy and stop losses will be placed below the SMA line and Target is 1 is to 1.5 risk to reward ratio let's see how to play out
this trade this trade running in profit this trade is completely hit the target I hope you must have understand this trading strategy now let's take another by example here first look at Super Trend indicator give by signal and market price breakup side of both plot lines and if we look at the second indicator here Market price goes above the SMA line and now for the final confirmation there should be two bullish candle here so all our conditions are being fulfilled so we are placing an order to buy and stop losses will be placed below the
SMA line and Target is 1 is to 1.5 risk to reward ratio let's see how to play out this trade we can see that this trade does not reach the Target and stop losses this trade is completely hit the target I hope you must have liked this trading strategy now wait to next trade here C got sell trade first look at Super Trend indicator gives sell signal and market price break downside of both plot lines and if we look at the second indicator your market price goes below the SMA line and now for the final
confirmation there should be two bearish candle here you can see here that all the conditions have been matched so here we will take sell trade and stop losses will be placed above the SMA line and Target is one is to 1.5 risk to reward ratio let's see how to play out this trade we can see that this trade does not reach the Target and stop losses this trade is easily Hit the Target and one very important thing when you use this indicator on 5 minutes or 15-minute time frame then your stop loss will be very
small so it may be that the broker you use they provide you very high spread due to which your chances of hitting the stop loss will be high so I would request you to use xus broker which will provide you zero spread account and you will be able to execute pinpoint trades in the market Link in the description join now that's the end of this video always maintain your money management and trading psychology as no trading strategy is perfect and guys please leave a like And subscribe the channel for new more very profitable videos take
care goodbye thank you for watching our video [Music]