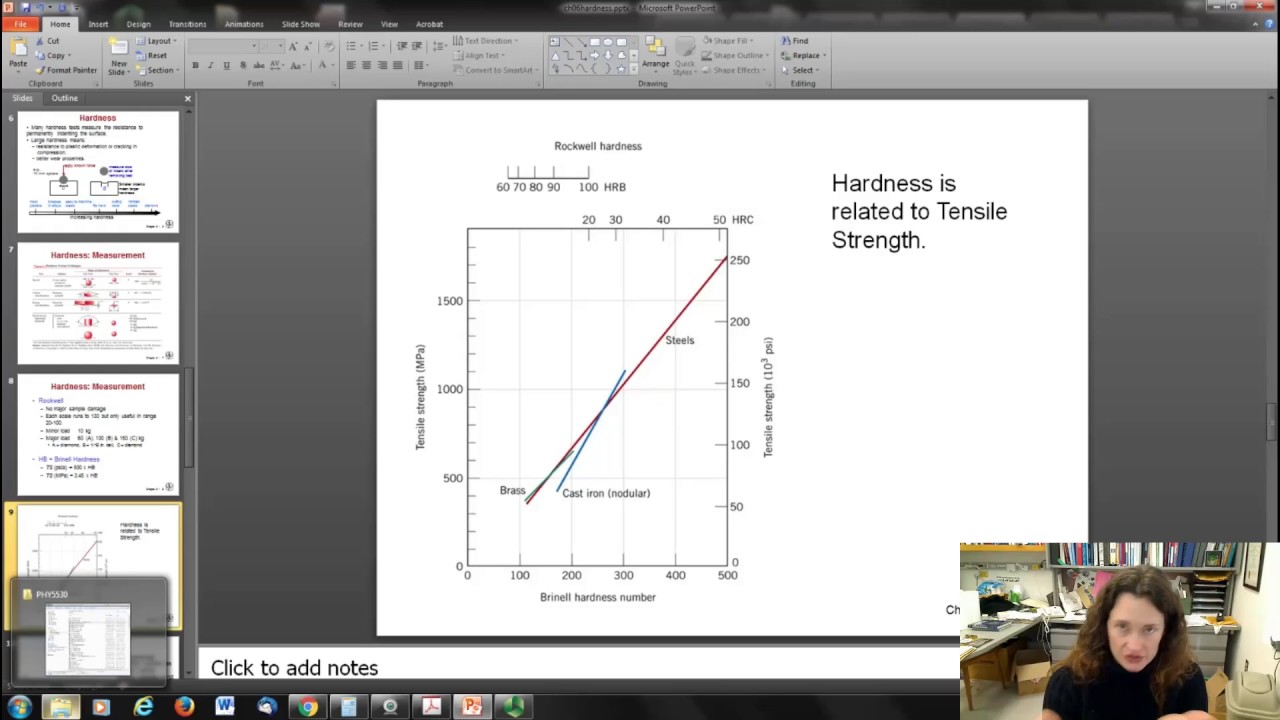
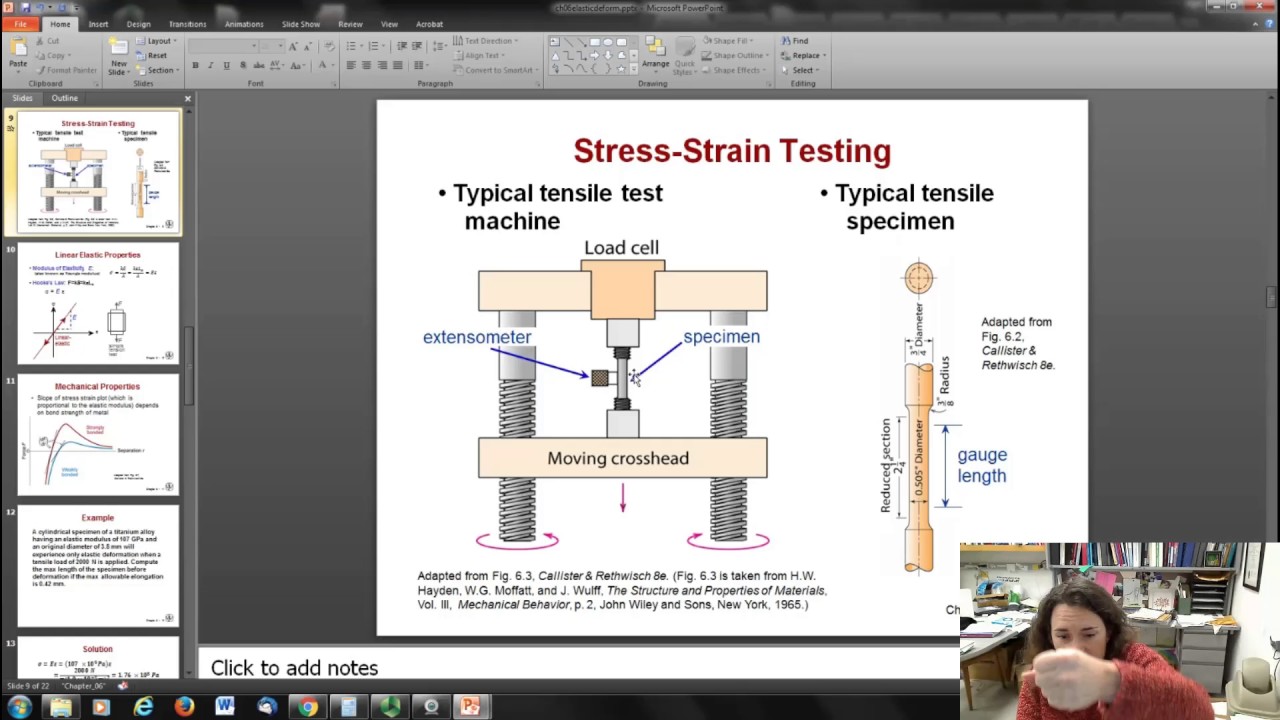
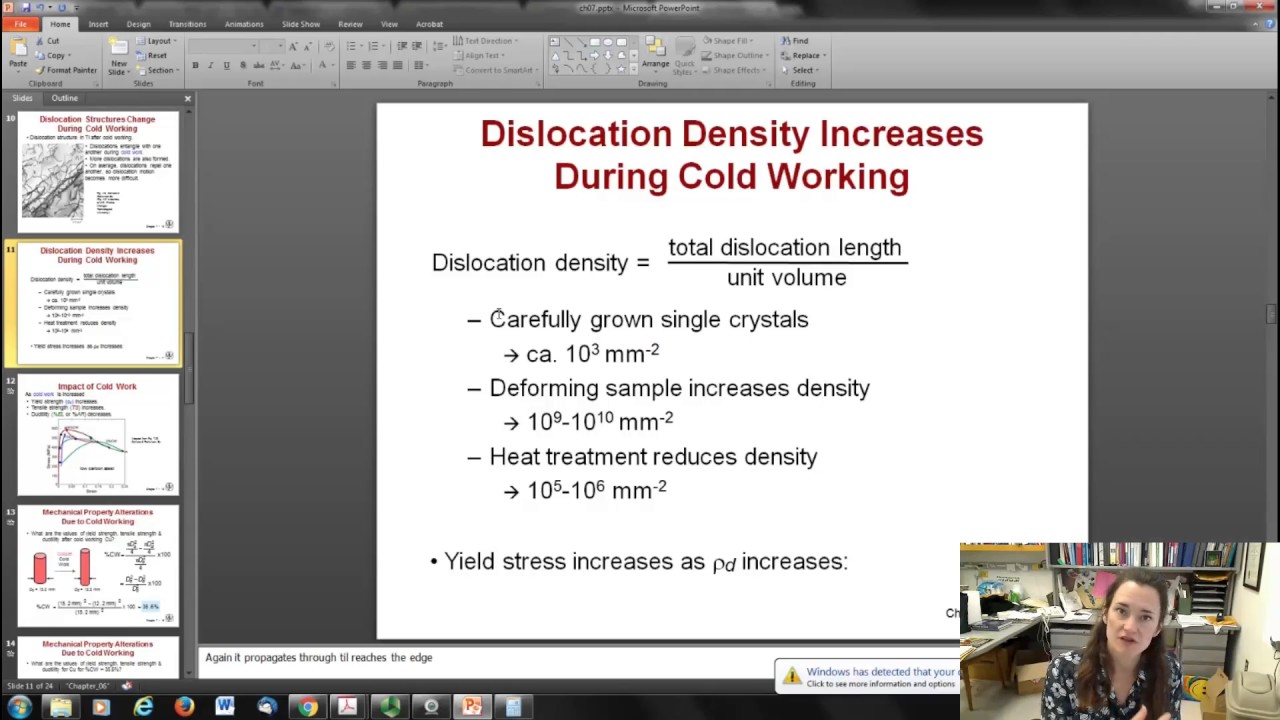
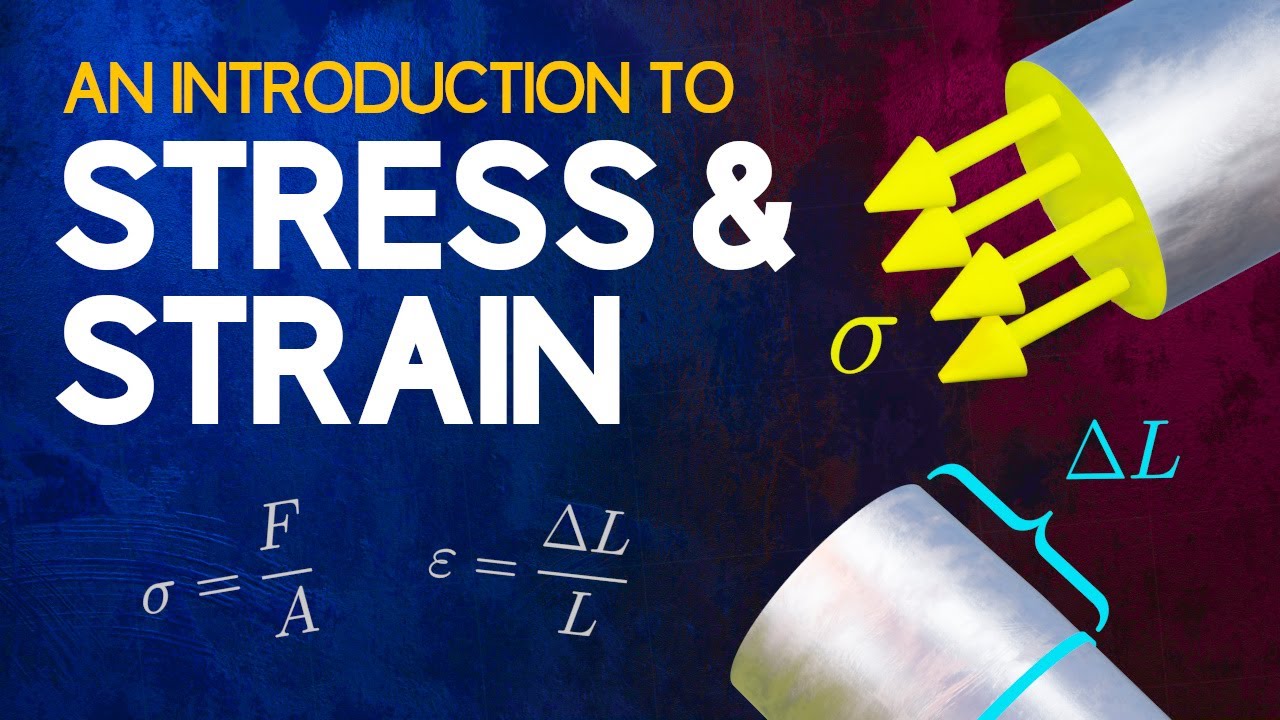
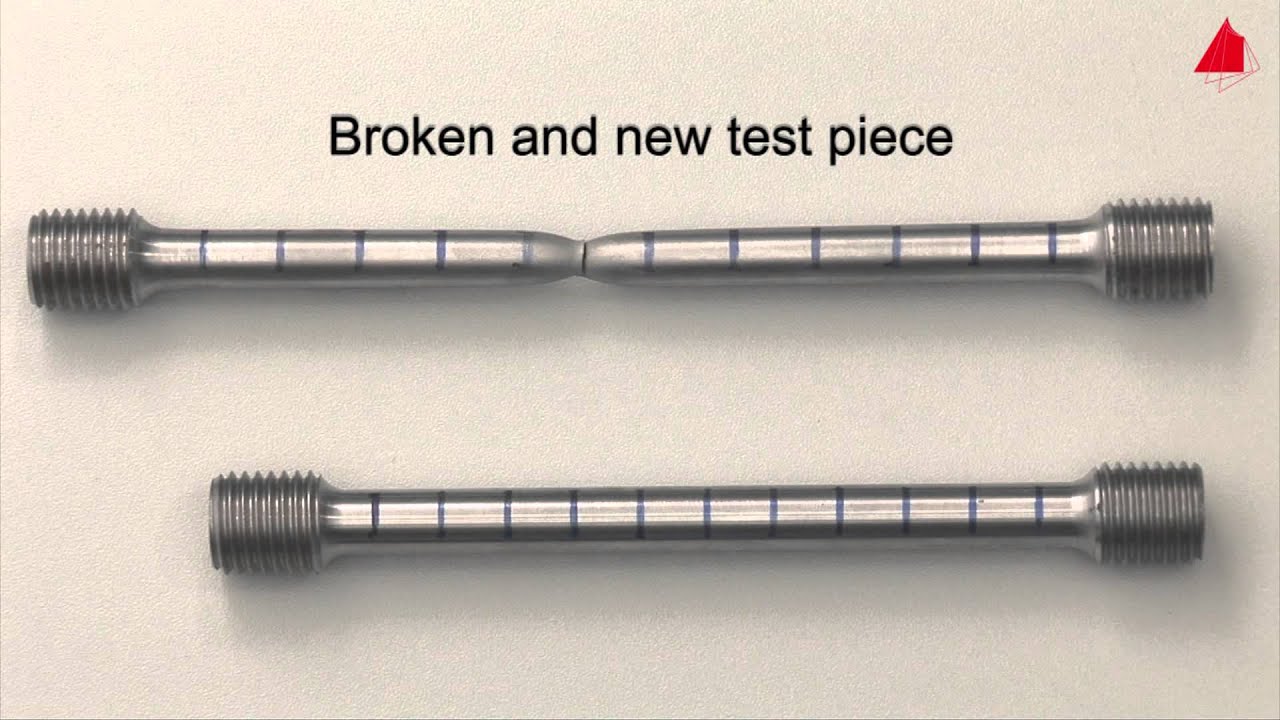
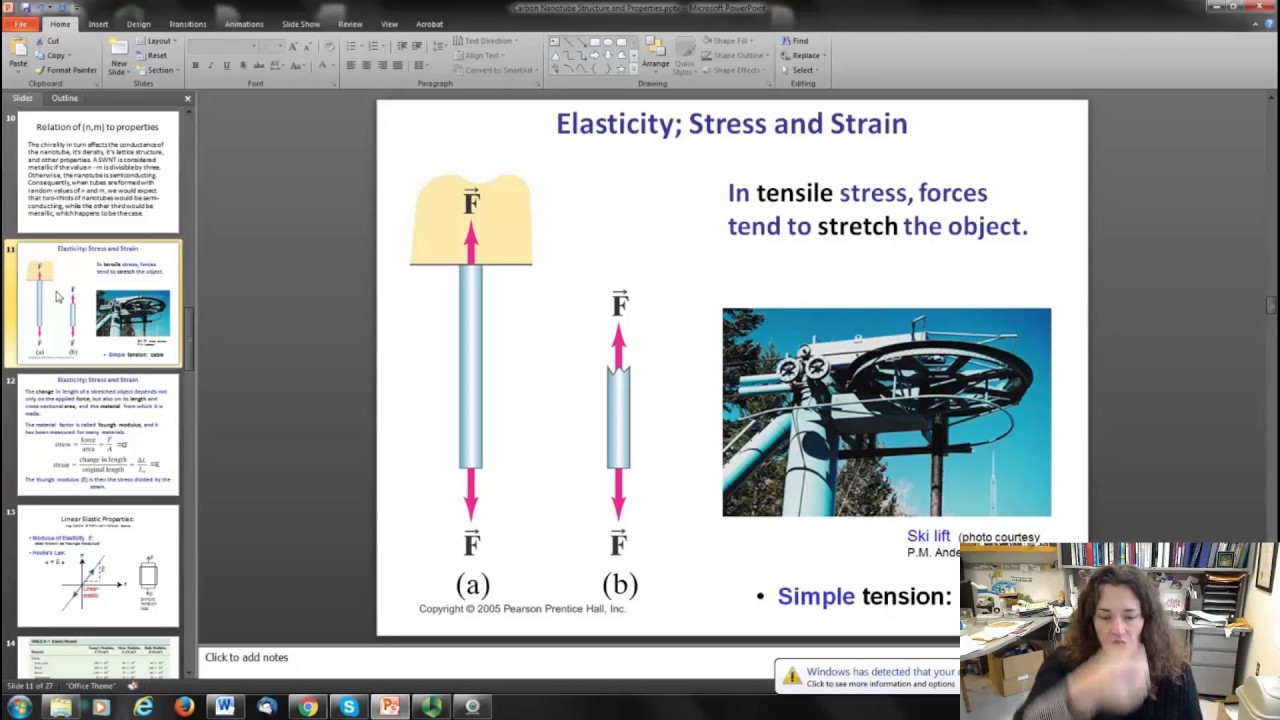
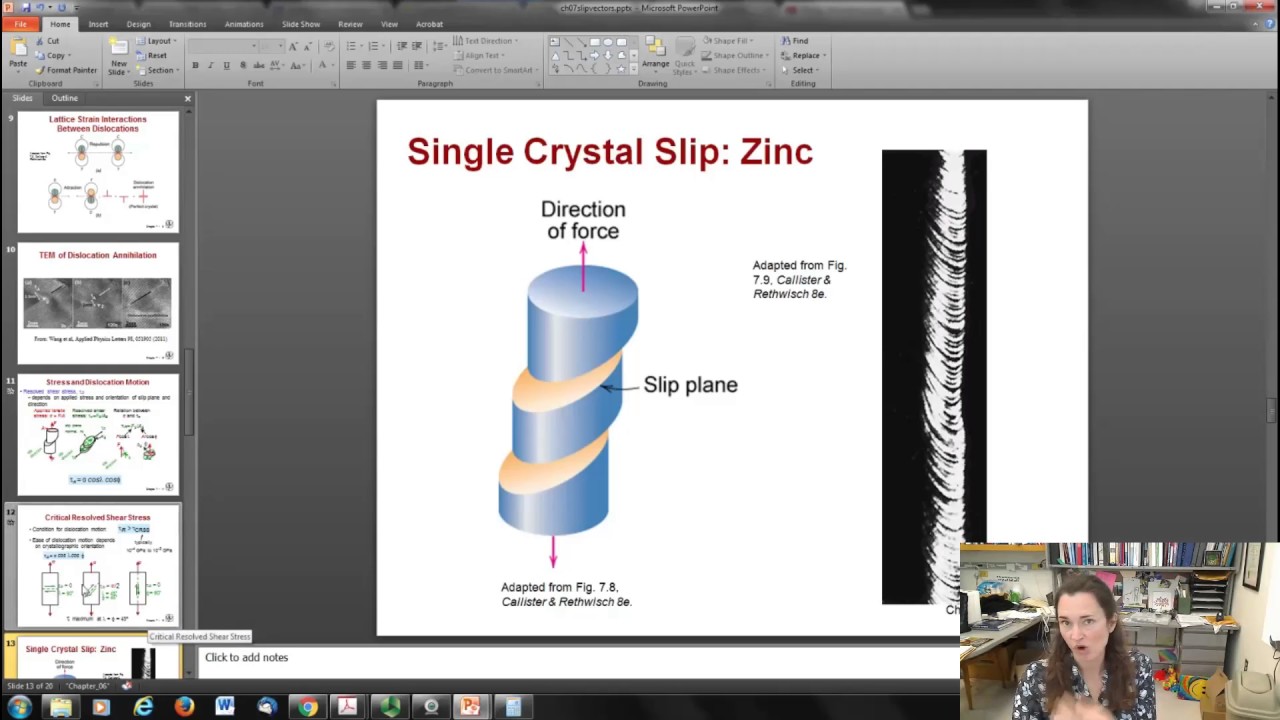
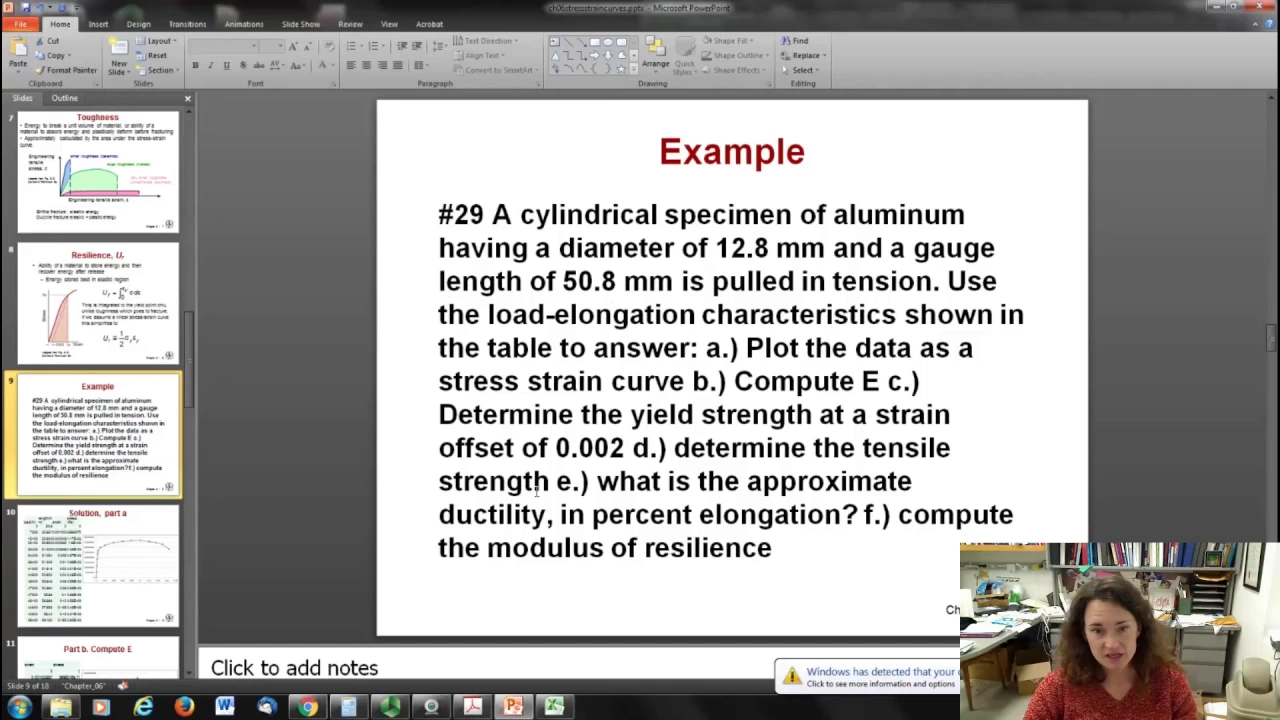
hi the next topic in chapter 6 is plastic deformation now of course this is defined as the permanent deformation of the material in other words you stretch the material out and then atoms and round their slippage and the planes and things don't go back to the way they were before when you release the load there's a few things that we want to define here first of all today I'm going to be talking about this classic or permanent deformation at lower temperatures if you increase the temperature the material of course it's easier lots of times to get it to plastically deformed so what we're going to be talking about is sort of room temperatures or temperatures that are say a third less than a third is a melting temperature of the material so I'm again still discussing what happens when you're doing a simple tensile strength test where you're taking material and you're pulling on it like this and in that case we're going to define the plastic deformation as watching this stress-strain curve and it turns out in a test all stress test okay so what happens is you pull on it and then you've got the elastic regime so we talked about in the last lecture but then once you exceed sort of the stress that can be returned to normal after you release the load and it begins to pop plastically deform if you release the stress then you'll have some permanent deformation of the material and you'll have a plastic strain sometimes to find with epsilon 2p there okay so you have a plastic strain right now there's a number of different parameters that engineers have defined over the years to sort of define how well a material responds to stress or to quantify those those things so you're going to learn a little bit of new vocabulary today the first set of new vocabulary that you're going to learn is called the yield strength often symbolized with Sigma Y this is defined as the stress at which noticeable plastic deformation occurs so since noticeable is kind of subjective what they've done is they put a limit on it and what they're saying is that noticeable deformation occurs when the plastic strain is 0. 002 okay so that's basically a point two percent change right in the length okay so what you do to find the yield strength is you have your curve right and then you do a fit to the elastic or linear region okay and then you construct a parallel line that intersects your strain axis at point zero two and then you go back to where your straight line constructed fit intersects your stress-strain curve and that will give you your yield strength so that's all there is to it okay if you compare the yield strength for different materials then it's really hard to measure that for ceramics because they just break right as we discussed last time you put a ceramic material under a stress and it'll fracture once it gets past that elastic regime and so you just can't measure it at all but yield strength for metals and alloys can range into the gigapascal range up here for strength steel and then all the way down to very low values for something like Tim interestingly there's overlap in the yield strength between some of the stronger polymers and some of the weaker metals so of course the yield strength for polymers is much lower than most metals but there you have it and then of course for composites you're also going to mix your your metal alloy with say a ceramic or something like that in which case a lot of a break on just like the ceramics breaks so it's kind of difficult to measure for that the next new bit of vocabulary you're going to learn is the tensile strength sometimes abbreviated TS the tensile strength is defined as the maximum stress on an engineering stress-strain curve so first of all let's talk about what a full stress strain test looks like and what the resulting curve looks like what you've got here is you've got a material that you're pulling on in one of those tensile testing machines and you measure the resulting strain and then you plot that stress versus the strain so you start off and you're in the elastic regime and it's got kind of a linear trend then you begin to plastically deform the material now up here near the maximum occur maximum of this curve something happens a neck begins to form in other words the material starts to thin out noticeably in one region of your sample okay and it forms this little neck and then it continues forming that Mac the necking region gets longer in center until fracture occurs and then basically the tensile test is stopped so basically in a tensile test you pull on something with increasing amounts of force until it breaks and then you plot the resulting strain that comes out and this is what they look like they go up linearly they come to a peak and then they start going back down with a neck form until fracture occurs now in metals this maximum stress is when the noticeable necking starts in polymers that occurs in this polymer backbone chains are aligned and they're about to break so if you compare the tensile strength of various materials you can of course measure for ceramics where the maximum on your stress-strain curve occurs all right it's usually going to be right before it breaks oftentimes though I have to tell you you don't usually stick ceramics glasses things like that in a tensile testing machine it's just not safe what happens is you pull and pull and pull and then it shatters and then shards of glass and ceramics lie everywhere so usually when you test the tensile strength of ceramics you do it in a different way and not in a tensile testing machine but you can see that the maximum values for the tensile strength for metals and ceramics are kind of comparable up here and of course it's much lower than polymers and unsurprisingly composites span the range between metals and polymers ductility another new vocabulary word ductility is defined as the plastic tensile strain at failure or the percent elongation of the material all right so the percent elongation is the change in length from fracture point the length right before fracture to the initial length divided by the initial length and then times 100 percent - that's ductility you can see here that they're sort of backing it out and doing the fitting extrapolating but remember that yield strengths are comparing the yield value here to get the plastic but oftentimes that yields is not a very high number it's like point zero zero two and so you can usually ignore that for the tests that we'll do in class okay another way to measure the ductility is to calculate the percent reduction in area we talked about how if you have a lengthening of one direction then of course you have a constriction in that lateral direction so the links gets larger the cross-sectional area gets smaller and smaller so if you want to compare it that way then you can compare the initial area to the final area subtract those two and then divide by the initial area and multiply by 100% and you have percent reduction in area that's another way to calculate ductility brittle materials usually fracture at less than five percent so they don't change their length or their area very much at all the fourth fracture toughness is the energy that is required to break a unit volume of the material or the ability of a material to absorb down energy and plastically deform for fracturing and you can calculate this by calculating the area under your stress-strain curve remember we're sort of likening stress-strain curves to force versus displacement curves for Springs and if you integrate a force versus displacement curve you get work or energy so it's the same kind of deal so an energy would be the area under that stress-strain curve so if you want to calculate your toughness you just calculate the area under your curve the resilience is the bility of a material to store energy and then recover energy after their release so this is um when you calculate the area under the curve but only in the elastic region okay now since the elastic region is usually that straight line bit then the area under the curve is a triangle okay and so you can approximate the resilience as one half the plastic I'm sorry the yield strength times the plastic strain at that point okay let's do an example problem and this example problem will really help you get through the lab that we're going to do on tensile testing because this is how you'll analyze your data this is from your textbook a cylindrical specimen of an aluminum having a diameter of twelve point eight millimeters and a length of fifty point eight millimeters is been pulled under tension in a tensile testing machine so use the load elongation characteristics shown in the table they give you a table of values to answer the following information plot the data is a stress-strain curve compute the elastic modulus determining the yield strength of strain offset of 0. 00 to determine the tensile strength find the approximate ductility and percent elongation and compute the modulus of resistance now in the problem what they gave you was the load versus the links and this is usually what outputted by a tensile testing machine and then from the load you can calculate the stress by comparing it to dividing the load by the cross-sectional area and you can calculate the strain by dividing the links the change in length divided by the initial links okay so here if you start out at a load of zero the initial length of the material was fifty point eight millimeters in the data that I was given in the problem and here's the load so I used this initial length and the information given for the diameter of twelve point eight millimeters to calculate the stress so I took this load column and divided it by PI R squared to calculate the stress here which is in the last column and then for the strain I took the final link I took the link at any given point and subtracted off the initial links and then divided by that additional links okay so for example four right here fifty point eight five then the string would have been calculated by fifty point eight five minus fifty point eight which is point of five in the divided by fifty point eight that gave me the value in that column and then I plotted the stress versus strain here okay I did this in Excel and I got a stress strain plot that I plotted an excel in sit out here underneath the lecture I give you the excel file in which this data is output it okay so that's part a a wanted the stress-strain curve now in part being it asks you to compute the elastic modulus so what you do for that is you take the linear portion of your stress-strain curve and you sit that using whatever routine you like to a straight line so I just took the first one two three four five six data points okay I took the first six data points fit a line to those in in the excel and got a got a straight line fit and then from that straight line fit I can use the slope and that slope in the trendline will give me the elastic modulus and I got sixty gigapascal for that elastic modulus so that's how you do that part next it said determine the yield strength at a strain offset 0.
002 okay so this is the point at which plastic deformation occurs so basically the strain offset line is going to have the same slope as the elastic portion of your curve and then it's going to intersect that strain axis at whatever point it defined here 0. 002 so that means that your y-intercept for your line is going to be minus sixty giga pascals times point zero two okay so that's B and your slope is of course sixty gigapascal so your equation for that straight line curve is going to be sixty to give pascal's times the strain minus 60 big giga pascals times point zero two your y-intercept and then what you do is you plot on the same plot this straight line curve that you got versus the stress-strain curves and you look at where that data intersects and where the data intersects you read off you stress and so that's what I did i mouthed over that point on the line and I got 0.