[Music] okay colle uh profess uh as I said I'm going to present data on the global burden of disease study What It Is What It shows and how one can use it um so what is the global burden disease study it's a systematic scientific effort quantify the comparative magnitude of Health loss due to diseases injuries and risk factors by age sex and geographies or specific points in time uh in terms of where it came from it was originally sponsored by the World Bank and the World Health Organization in 1990 uh after several years of work
preliminary results were published and then in 1997 more finalized results the first version was published in the lanet covering eight regions 107 diseases and 10 risk factors and then the next big jump was in 2007 with the creation of the institute for health metrics and evaluation which is funded uh very generously as in hundreds of millions of dollars by The Bill and Melinda Gates Foundation so things have changed from then to now uh the current version of the global burden of disease 2019 investigates 369 diseases and injuries 87 risk factors covers the period from 1990
to 2019 uh is divided into 23 age straa covers 204 countries parator both separately for men and women come a long way um how does the gbd perform its analysis bottom line is it's very complicated I've been working with the gbd for about 10 years now and there are plenty of things that I still don't completely understand and will never understand um when those uh calculus symbols show up in the in the explanation it's too far for me but basically the gbd assembles epidemiologic descriptive data about diseases and risk factors from around the world it
does systematic reviews uh going for prevalence instance mortality um excess risk or relative risk of given diseases and risk factors for outcomes and then puts all this into their computers and applies very sophisticated modeling processes and techniques with the objective of estimating basic disease metrics or indicators and to fill in the blanks what are the blanks well the blanks are more than what's there because uh they're estimating things for these indicators these metrics for every year for every local and for example diabetes a prevalence study Brazil has a nice uh prevalence study of Brazil in
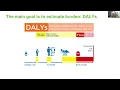
2013 in the PESA National ofi another in 2019 but between then our blanks that need to be filled in um Brazil has very good data Paraguay not so good so Paraguay borrows data from Brazil and the other countries around it to make its estimates of disease metrics so that's to say the gbd borrows data from the countries around it to provide data for Paraguay um so that's at a very high level how it works the main goal of the gbd is to estimate burden and the main metric for burden is delies the delies are disability
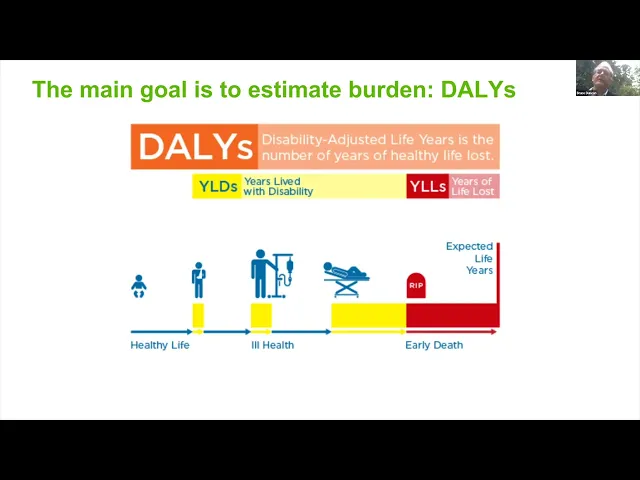
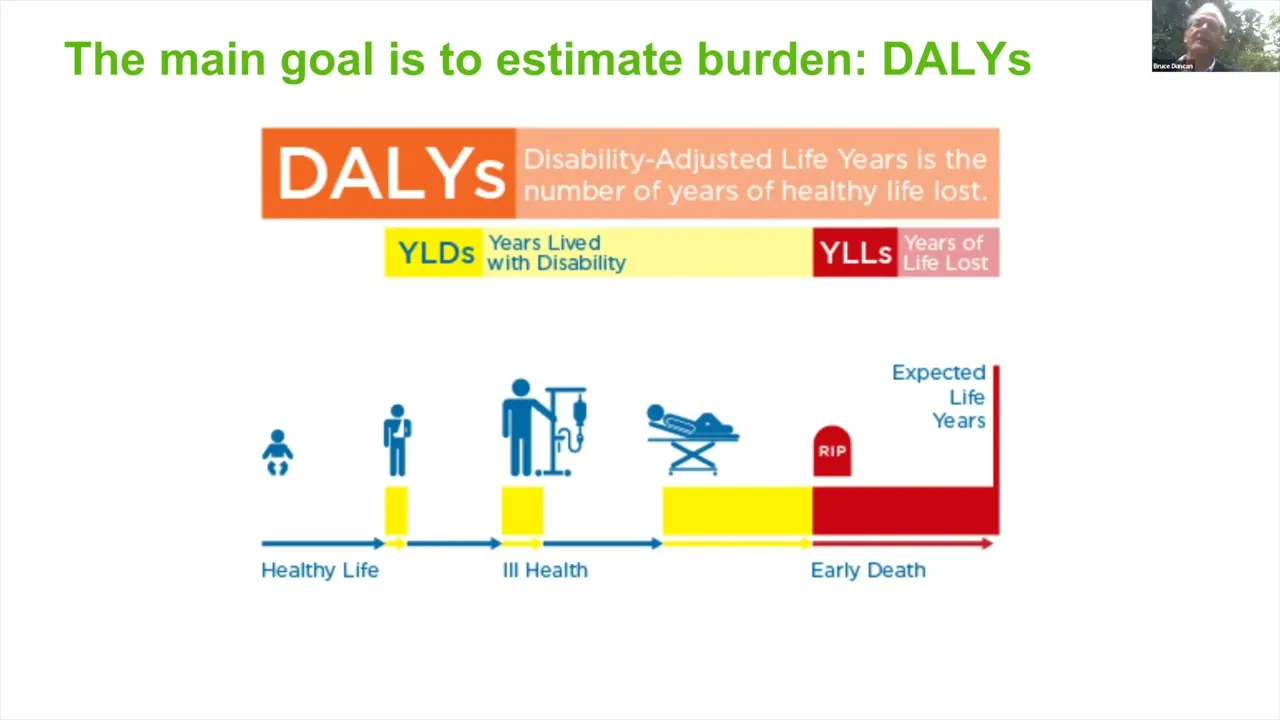
adjusted life years that's to say disability adjusted life years lost to disease it's the number of healthy years of healthy life completely healthy life lost delies are made up of morbidity and mortality on the left you have yds or years live with disability which cover the morbidity part to the right you have Ys or years of life loss which cover the mortality part if you look at the graph below we have a life course of a person who began healthy had a bout of a broken arm and then had a bout of something more important
maybe a cancer that he was cured of uh and then toward the end of his life had some incapacitation which left him bed rest uh the gbd sums these events uh to create Wilds the number of years he lived uh with uh with disability or more specifically the the full number of years equivalent l lost of Life due to the fact that he was living with disability and then to the right uh he died in early death uh he died uh with some life expectancy still present um and this difference between when he died and
his expected life expectancy um is calculated as years of life loss which is the mortality part uh going into a little more detail uh gbd to with respect to the mortality part and the yls uh created a standard life expectancy table which is shown on the right of the slide on this table second this table shows for each age or for each age straa uh the expected number of years uh forward before death um it's the same for both sexes All Nations and regardless of socieconomic situation it's estimated as the life expectancy of the country
around the world with the longest life expectancy for each of these straa and then to calculate Ys we have deaths in a given population for example taken from the Brazilian if it's Brazil taken from the Brazilian mortality information system if someone dies at five as you can see from the table uh his life expectancy was 81.8 years when he died so his death contributes 81.8 y L's years of LIF law if someone died at 50 it produces only 37.6 Ys thus more weight is given to deaths that occur among young people and Ys for a
population are the sum of all their deaths times the number of years uh premature to the standard of life expectancy that these deaths occurred and Ys can be calculated for a given disease say diabetes a given risk factor like high body mass index or overall for our country like for Brazil um the rules for calculating ylds and morbidity or disability as it's called in the gbd are the following they're a bit more complicated each person as shown in the diagram before can be sick many times in his life and it can be due to multiple
diseases each of these diseases can have multiple sequel uh direct complications of the disease um for example someone with diabetes could have diabetic retinopathy each theel can be a combination of one or more Health States um for example the the diabetic retinopathy the person has low vision um but the examples here could be someone with type two diabetes undergoing dialysis with the moderate anemia and the other effects of uh living with renal failure uh someone with diabetes could be amputated uh someone it's not just diabetes obviously in the gbd someone could suffer the disfigurement due
to leprosy or the problems living with a metastatic phase of St stung cancer stomach cancer the sequella list is mutually exclusive and any short or long-term Health loss produces disability Health states are any unique type of disability they reflect key differences in symptoms functionings or health loss an example the health state would be undergoing dialysis due to type two diabetes with moderate anemia um and the effects of renal failure the gbd has developed 440 unique Health States into each of them is applied a disability weight a disability weight is a number on a scale from
0 to one reflecting the severity of Health loss associated with a health State resulting from the selum um here's an example of a scale of disabilities on the left is perfect health which has no disability weight zero on the right is death uh with the disability weight of one if someone has mild distance Vision impairment that's not such a big deal so the disability weight of mild distance Vision impairment is very close to zero on the other hand if someone suffered a spinal cord lesion at the neck which is not treated it's getting pretty close
to death in terms of the quality of his life so it's a high disability weight and all of the all the health States receive a disability weight so to calculate the ylds or the burden due to disability or morbidity for a given disease and can be done separately for a given risk factor within each of the age sex strata because everything is done in gbd and stratas of age and sex of a given country location X here first you start with the prevalence of disease or the risk factor for example diabetes say the prevalence of
diabetes in the age straight of men from 60 to 64 years of age is 20% and then one of the complications of diabetes is diabetic retinopathy with the vision loss so we need to estimate for diabetes what's the prevalence of uh of vision loss a sequel um in this population let's say 10% so the ylds are then calculated multiplying the sequella prevalence diabetes in this in this age traa times the disability weight associated with it not with I'm sorry multiplying the aquello which is diabetic retinopathy with with the moderate vision loss times the disability weight
associated with the moderate vision loss due to diabetic retinopathy then the disabilities are summed so if we're talking about vision loss here the the vision loss due to diabetic retinopathy is summed across all the age sex trated to get this the sum of this equal in terms of wildd for the population um and then diabetes is more than diabetic retinopathy is a sequella you need to sum all of the sequella of diabetes amputation neuropathy um vision loss due to diabetic retinopathy and so on uh we need to sum the Wilds for all of them to
get the wildes for diabetes and then if you you wanted to know the Wilds for a given population then you have to sum the Wilds across all the diseases or if you're using risk factors against all of the risk factors uh to get the Wilds or the sum of disability the estimate of disability in population X and then to get di now it's simple you just sum the Ys and the ylds and you have an estimate in years of life lost due to disease for a given disease for a given population or a given risk
factor there other details in the methodology one of the details is the gbd has divided the world into seven super regions which is shown a key below for example East Asia Pacific or Latin America Caribbean uh these super regions are divided into regions the Latin American Caribbean region has a Caribbean Central Latin America and there the colors on the map here tropical Latin America and Latin America andian there's also a high income region which is not geographically uh specific it takes the high income from the southern cone from North America from from Australia New Zealand
from from Asia and puts them all together into one region so there are 21 there are seven super regions 21 regions 204 countries and territories and then 519 geographical locations because some of the countries are broken down for examp for Brazil we have more than Brazil we have uh each state has has these estimates um these uh Regions locations are shown on the map uh and gbd also created something called the socio demographic index which is a measure of development um you could think of as equivalent of a measure of poverty say but it's it's
development uh they created a number for each um locality going from zero to one one being most developed to zero being least developed and then uh stratified them into five uh SDI straa going from low through Low Middle Middle High middle to high and this is a map slightly old of uh these regions you can see that the North America is is all high Africa is mostly low with some low middle and a little bit of middle and high middle um Brazil for example is almost uniformly middle although there some of the northeast states are
low middle at least they were when this was published which I believe is 2016 okay let's move on to products what has gbd produced well gbd has produced a tremendous amount of stuff um 28,000 Publications in counting um free country visualizations which I'm going to talk about a bit more and also profiles which you can find on the internet for your country if you're interested uh the main Publications are called capstones they come out around every two years although the pandemic has thrown things a bit off um and uh they are put together they're published
in the Lancet they're put together to a a a single issue um and they emphasized the main findings of gbd on that round because it's important to realize it's an intive process all is recalculated every two years now um So currently if you went on the internet you would find gbd 2019 hopefully in two months if you went there you'd find gbd 2021 which is the upcoming version which is basically ready and will be published shortly when the capstones all have come out um and when this renovation this reiter this iteration happens and all the
data are new all the data are reestimated uh aside from the capstones there are international Publications dealing with spe spef specific subjects like pollution alcohol diabetes chronic ridle kidney disease um sort of virtually anything and then there are a series of based Publications which I'll talk about a little bit further further on um it's interesting to note that gbd has ad adopted the attitude of being very open and soliciting participation of collaborators and around the world now more than 10,000 people have said yes I want to be a collaborator uh being a collaborator permits access
to um co-authorship on certain Publications and and possibilities to contribute in any means of ways to making the gbd better um what it doesn't do is pay um so you can see countries like Brazil and Colombia and Mexico in in Latin America have a large number of collaborators upwards to 200 um and then some countries have a tremendous number of collabor ators I think Ethiopia apparently has more than 1,000 collaborators um so let me talk now a little bit about a an organization of this collaboration in Brazil Brazil uh has a large number of columb
collaborators has for several years now and in 2014 created a local network hedge JB Brazil or Brazil gbd network uh you can see here it's composed of currently 150 researchers from 27 institutions around Brazil from 10 of Brazil States and also with the support of the uh Ministry of Health um what does the uh gbd Brazil Network do well it does to a certain exent everything the gbd does it does uh it's translated the uh gbd basic course which is produced uh in Seattle uh into Portuguese and apparently coming up into Spanish um for use
uh for better use by Spanish and Portuguese speaking populations uh its main activity has been to produce Publications mostly dealing with the gbd data in Brazil uh there have been three um supplementary issues of journals the first revie epidemiologia about four years ago and then population Health metrics about two or three years ago and then most recently in the revista assed to Medicine tropical all of them with approximately 20 articles um it has stimulated production of several other uh articles some of which are the topics of which are mentioned here here for example analyses uh
in countries of meros and so publication is probably the the main activity of the network but the network does a lot of things uh above and beyond that um it's involved in advising uh The Institute of Health metrics the home of the gbd of of uh data that exists and it's not currently Incorporated in validating the the metrics that are produced uh uh uh of Publications not just within the network but that uh stimulates uh Brazilians to participate in the international Publications also um uh the last uh supplement uh was had contributions of 89 authors
and 22 who came from 22 Brazilian and international institutions so you can see it's a very collaborative activity um and uh me speaking of Permitting collaboration in international articles this is an article that we published Everton cousin who currently works at in Seattle with the gbd um was the lead author this is a doctoral work of his we published on uh diabetes in the Americas for example showing that the there are hot spots for Di IES are hotspot regions uh Central America and the Caribbean have have much more diabetes much more Del due to diabetes
much more burden um than say the southern cone or North America um and surprisingly uh this is the previous Slide the color coding here with red being a larger percentage change in delies due to Diabetes Type 2 diabetes from 1990 uh is occurring basically in countries which did not have the highest uh burden originally in 1990 or or or currently um so what that means is that the the burden is large because we also demonstrated that this burden is in in the region is 20% greater than the world's burden um it's growing as you can
see here the vast majority of countries only the the purple and blue didn't have an increase in burden all the rest did um and it's expanding in a sense that it's uh affecting more countries which were less affected in the past um so if you who are listening are interested in using GB data and don't have much experience yet let me talk a little bit in the close here of how you can use the gbd data first of all you can use it to get a better understanding of a descriptive epidemiology of different diseases and
risk factors their instance prevalence complications risk factors and and burden if you're involved in Health Systems you can use gbd data for plan and also for evaluation of how things are going um if you're a doctoral student say or any person who publishes for that matter you want to establish context for your Publications in the background of your paper you can go on the gbd and talk about the uh and get the the severity of the condition that you're dealing with to to to place as a citation in the introduction and you can participate in
Publications Publications come in two flavors those within the collaboration and those outside of the collaboration although the data is freely available and people around the world are publishing outside of the collaboration uh those within the collaboration uh suggest that it's best to publish within the collaboration um and if you're interested in becoming a collaborator you can put uh gbd collaborators into Google and you'll come up with this link here which will tell you how to become a collaborator um in terms of tools that if you if you want to use the data you need to
get access to it so what are the uh means of access uh first is the global Health Data exchange which is uh uh repository of well in 2016 there were 55,000 data sources so in 2023 there are probably certainly more than 100,000 data sources uh which the gbd has assembled Publications uh micro dat from service the uh mortality data from the mortality Data Systems around the world uh Etc which is the basis of the of their estimates and then their visualization tools um uh the most important of which is gbd compare uh which I'm going
to show some screen slides from now uh if you're interested in knowing about disease metrics of a given country or the world where you need to go is gbd compare uh gbd compare has uh presentations that deal with causes that's uh diseases or injuries and also with risk factors uh there are various measures that can be expressed deaths yds Ys delies instance prevalence estimates of uh prevalence of of risk factors um you can do it for overall for regions for countries for states in the in the countries that have broken down into States you can
do it for a given year you can do it for an age straa for men women or both um and uh using these different um presentations laterally here you can get a dozens if not hundreds of different presentations this one here the heat map presentation shows the relative prevalence of disease the main causes of here uh we're looking at delies I believe um the main causes of Del globally um uh for both sexes all ages that's to say not age standardized and you can see that the main causes are SCH scheme heart disease stroke neonatal
conditions lower respiratory infections uh and so on The View here um of the is a ranking so here I have Peru we're looking at D we're looking uh at all the age trra from both sexes and you can see that in 2019 the main causes of uh b or in Peru where Mal nutrition these are risk factors not diseases a risk factor malnutrition and then three metabolic risk factors associated predominantly with chronic diseases high body mass index High fasting plasma glucose and high blood pressure then air pollution and then so on and you can see
the changes in these risk factors you can see that for example the metabolic risk factors have uniformly increased as chronic disease has become more important over these uh three decades and and several of the risk factors that lead to problems with infections or Maternal Child Health have decreased you want to compare countries you can use this parameter uh pyramid here males on one side females on the other I've pulled up the Latin America and the Caribbean uh we're looking at let's see Ys years of life lost for all causes and you can see that uh
ru proving men have the least uh number of Ys uh Haiti and for men the interestingly the US Virgin Islands have the highest Ys so you can it's the gbd is particularly good for making comparisons between countries and you can see Trends uh here we're down at this here we're looking at changes over years going from 19 9 to 2019 this is not for Brazil this is for rran to my State uh you can see that over time uh the uh deaths have decreased uh types of deaths are shown here each of these colors represents
a group of deaths for example cardiovascular disease this has gone down considerably cancer not so much and the the group of Maternal Child Health in diseases nutritional deficiencies has also gone down considerably over this period so accessing um gbd compare is is very good for doing this you can download the data um you can download the graphs you can download the data it's a little bit more complicated you need to go to another tool and downloaded but it's it's available um to do so that's basically how you get on to the to the gbd and
I stimulate all of you to uh to get on and who haven't done it before to get on and try it's a very valuable resource and that's it thank you very [Music] much