hello everyone this is Mark Linwood and I was looking for a video on calibration methods for our class and I found this excellent video by dr. crowler of Georgia Southern and so we're gonna watch his video and I'm gonna have a couple of things to add as we go along but the bulk of this is his video that I found on YouTube at the link on the screen hello in this video we're going to talk about calibration methods that are used when people use instruments to make chemical analyses we're going to talk about the external
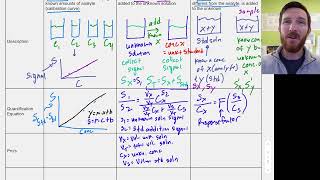
standards the internal standards and the standard edition methods of calibration instrumental methods of analysis require calibration and they have signals signals that usually can't simply be related to the analyte concentration or the analyte amount by an equation so the signals are often something electrical like the voltage or current from a detectors circuit signal the information that you're using could be the height or the area of a peak in a chromatogram or spec the signal from the analyte in the unknown must be compared to signal from the analyte in standards that's where it's different from the
classical analyses the comparison is that you have to make is mathematical in nature and so the signal ideally will have you know be able to have an equation between the signal and the concentration of the analyte but that equation has to be determined using standards so we get into the standard to use standards in different ways and I mentioned that there's three different main methods of calibration and the one that you'll actually use will depend upon the exact analytical situation there's so there's two main types of error that could guide your decision sample the sample
variability will say more about these sources of sampled sample variability in a few minutes that's the main that's one main class of error and let me jump in to say for just a second that if you were doing an extraction step and you potentially lose some of your sample during extraction I'll categorize that also as a sample preparation error and I'll jump in and add that again when he explains it more the second other class of error is errors associated with interference effects if the analyte is present in a complex a sample matrix when when
we really boil it down your choice of which calibration method to use depends upon whether you expect errors of one or the other type okay so if you do not expect sample the sample variability and nor do you expect interference effects to be happening well then you can just use the external standards method of calibration which is the first the most basic the first calibration method that people learn about usually so let's say if you did expect sample to sample variability but not interference effects well then you would use the internal standards method of calibration
if you did not expect that sample that variability but you did expect interference effects well then you would use a standard addition method so let's talk about this the most basic one first external standards method of calibration one that you probably you already know most people learn about this one first so you have your unknown say it's an analyte in solution at some unknown concentration which will mark with Max well then for the analysis for the purposes of the analysis you would make up a stock solution of the analyte it's some known concentration that we
make up as accurately and precisely as Boston then you have a set of flasks into one flask you would put only the unknown and into the other flasks you would put variable amounts of that stock solution so this is a basic point you already know but it's a real important point the unknown goes into one flask only the stock solution of the analyte then goes into the other flasks they're not mixed they're kept separate fill them to the total volume analyze let's take a look at some data some example data say we've got a set
of standards which includes a blank varying amounts of analyte in there this one actually had no analyte but then we recorded signals probably absorbance measurements and B you can imagine that this would actually be in a absorbance value but basically absorbance that signal would be directly proportional to the analyte concentration well then you know don't forget that we made up a little solution of the unknown we measure its absorbance don't forget that we're up to figure out that concentration of the unknown so we measure its absorbance and then just rearrange this equation and plug that
absorbance of the unknown into there and to solve for that unknown concentration okay but you already know this now let's talk about internal standards method and now we'll say more about sample to sample variability and I often like to think of it sample to sample variability in terms of if I was trying to make up say a set of solutions say three or five solutions that I tried as much as possible to make them identical and actually then also analyze them in identical ways on the same instrument try to make the solutions and the data
that signals that get from them as identical as possible but let's talk about a few things that could make those samples and the signals a and or the signals that you get from them different even though you tried your best to make them the same say for example during your preparation of those solutions you needed to do some material transfer like say pipetting loops and as try as you might the pipe adding technique just is a little bit variable and you just get different amounts in each solution say for example if there's a chromatographic technique
and a very important part of the analysis was the injection of a bit of that solution into an instrument then chromatographic injections especially if they're manual they're really difficult to keep constant especially you know for people who are just starting out and learning how to do them say something else within the instrument could possibly be happening to like say that sensitivity of a detector might be going up or down on the timeframe of you know the analysis of one sample to the next so by the time you do one solution and then go to the
next one maybe something inside the instrument just changed a little bit making the signals that you get just slightly different from one sample to the next so those are sample sources of sample to sample variability so let me jump in again another time when you would really want to use an internal standard again like I mentioned before is if you do an extraction like solid phase extraction or even just a classical liquid liquid extraction where you have an aqueous and an organic phase and you shake them up if you say lose 10% of your analyte
during the extraction process then that is going to dramatically affect your measurements however if you put an internal standard in before the extraction then you would also lose 10% of your internal standard and then the ratio between your analyte and the internal standard is still the same and then you can get a proper measurement that way so that's another important time to use internal standards an internal standard is a substance it's a material it's not the same as the analyte but it's got similar properties it might have a similar molecular weight similar structure but it's
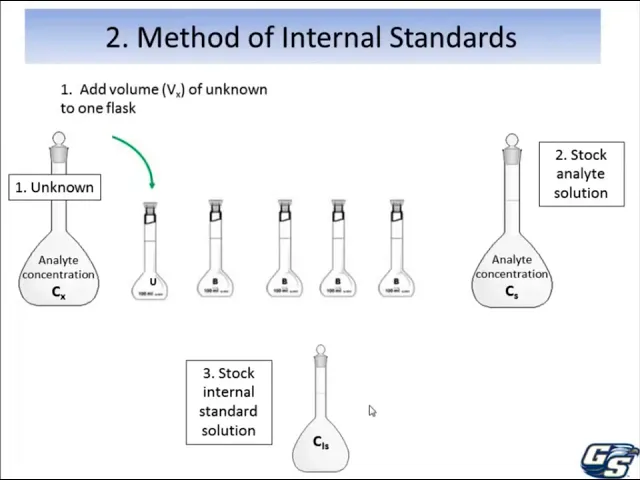
not exactly the same so it generates a signal that can be kept separate from the signal coming from the analyte but it will generate the same type of signal fundamentally but it will have a different enough wavelength or something something about the signal that it can be kept separate from the analyte this is what it looks like looks a lot like the external standards solution of calibration until you bring in this stock solution of the internal standard at some known concentration okay so then you have the same set of flasks add some of the unknown
to one flask add the stock solution of the analyte in varying volumes to the other floss well you know this still up until this point looks a lot like the external standard methods until now when you add a constant amount of the internal standard to each flask fill all the flossed to the volume and analyze them okay so here's here's some example data that's generated Georgia Southern University when students do an analysis of gasoline for the analyte toluene which is present in university president basically all brands of gasoline in a pretty large amount say around
10 percent or so so we're analyzing for toluene but it's a chromatographic method gas chromatographic method with this manual injection which is a pretty large source of sample to sample variability we have an internal standard chlorobenzene it had a little higher boiling point comes out a little bit later quite a bit later certainly can keep it keep it separate from the toluene yet signals for both in terms of we use the areas of those Peaks so when you use the internal standard approach actually you plot on the calibration curve on the the vertical axis the
ratio of those signals so you would for each each solution which gave a chromatic Ram you would take those two peaks and you would plot the ratio of the area of the toluene peak divided by the area of the chlorobenzene peak then you would plot that as a function of concentration of the toluene here we use volume percent okay what do you do with that data well that calibration curve is a line again but plotted on the vertical axis is the ratio so it just looks different right here because you're plotting the level the ratio
it's always the ratio of the in light divided by the signal from you analyze you the unknown that you make up you get your ratio from the unknown you plug that into this equation and then you solve for the concentration of the analyte in your unknown straightforward enough well how does it work remember we we went to this little bit of extra trouble because we were worried about sampled sample variability so how did this additional complication of the internal standard method actually compensate for some of those errors in each solution that you've analyzed whether it's
your your actual unknown or any of those standards you had both the analyte and the you got signals from and if say for example something happened that caused you to have you did an injection that was 10 percent larger then you really wanted it to be he got into the instrument in generating signal you got 10% more analyte than you wanted to but the internal standard was in there as well so if you got 10% too much analyte well then you would have got 10% too much internal standard this is an example and the signals
from both would have been about 10% higher than otherwise expected however when you plot the ratio that variability that extra 10% factor that's in there will cancel out and you'll get improved data now your improved data will be as if this sample to sample variability never existed and that's wonderful so internal standards are very commonly used method in instrumental analysis for the reasons we just described however both internal and external standards rely on the rest of the stuff in your solution not complicating your measurements and this is all well and good in a number of
different solutions but say you're in some complicated biological mixture like blood or plasma and the other stuff in the blood affects how your analyte reacts to your measurement so your internal or external standard solutions that are in water or something you have in the lab the measurements you get out of those just won't compare to your analyte measurements in a more complicated matrix and so this is called a matrix effect and neither internal or external standards can really compensate for that so the way to get around that is through something called standard edition which we'll
get into next so here's how it looks okay you've got your solution of the analyte and your solution of the standard analyte that's unknown concentration now you don't have an internal standard here but you make up the solutions a little bit differently let's show you how okay you add a constant volume of the unknown to each flask not just one but all of them constant volume say if these are like 10 ml flask or something like that say for example would be 1 mill 1 mill 1 mill 1 mill constant amount to all of these
but you add variable volumes of that stock solution to all flasks but one say if these were say this is like 2 3 5 mill or something like that variable but into 1 0 mill of this you just don't add it to so this is what the data might look like and something you could do is determine the equation of that line by linear regressions least squares analysis and then seal C taking the ratio of the intercept taut over the slope would cause some nice mathematical things to happen certain factors would cancel out because they
appear on both the top and the bottom so on the right hand side of this equation you just you boil it down there's only 4 variables 4 parameters three of those are constants and one is is the concentration that you want to solve for so you just after that simplification rearrange and just solve for that unknown concentration there's actually two ways that you could solve this two ways of handling the data they seem to be both equally common you could use them both that should give you the exact same answer but anyway something else you
could do with this data so you could take this equation of the line that you expect where the parameter on the horizontal axis is the volume of the standard remember two three five mils something like that it's a variable you're adding different amounts to each okay so you take this data and he plotted out determine the equation of that line and you realize that it extrapolates back and crosses the x-axis at some point here where the volume is negative asked the signal he would plot in zero and for the volume you would plot stick in
this volume volume with Nick with a zero signal okay then you'll notice that you can take this equation rearrange it and simplify it so certain things cancel out again and you've got all constants and one unknown that you want to solve and so you can rearrange and solve for this unknown and so this volume was negative so you'll understand why there needs to be this negative sign because it's a negative times a negative if you end up with something that's positive how does this work in terms of how did it compensate for interference effects it
did not stop interference effects from occurring and in fact if you have a complex matrix it's it's really next to impossible to stop the interference effects from happening and it's also really really difficult to try to replicate interference effects try to rebuild the sample matrix or something it's just usually more trouble as the interference still happens but it occurs to the same extent in all solutions the interference effects are occurring to the same degree in each and every solution then you can compare Solutions one to the other say for example if he went back and
thought it with the external standards method of calibration we had kept the unknown and the stock solution completely separate and then we ended up with like apples and oranges in a way if there was interference effects happening in one they would not have been happening say say in in the external standards but in this case the interference is happening in all solution that finishes this video it's been a little bit long and I apologize for that but really what I wanted to do was just cover talk about these three main methods of calibration in instrumental
analysis talk about how you choose them and I thank you for listening as well take care