so once you're done with literature search and review then you need to convert your research hypothesis into statistical hypotheses which is a pair of refined research questions to be tested with a statistical model again not every research question is subject to this process um if your research is mainly descriptive or qualitative in nature in setting up statistical hypothesis you need to formulate two competing hypotheses so that they are mutually exclusive and exhaustive here the mutual exclusivity means that there should be no overlap between the two statements so that only one of the statements can be
chosen after a statistical test and mutually exhaustive means that the two statements should cover all conceivable possibilities so let's just take a look at an example and so let's consider the following research question whether or not taking lutein supplement is good for vision so lutein is a chemical known to be concentrated in the macula which is responsible for the most accurate vision um in the back of your back of the eye so in some big studies on amd right age-related macular degeneration where the data suggested that the chemical may have some beneficial effect on slowing
down the progress of the disease however it is not very clear if the substance will be beneficial to normal vision in general well let's assume that you think it will be and you want to conduct research and in this case your research hypothesis will be that routine is good for good for vision right and now um to have a complete statistical hypothesis you need another hypothesis which is called a null hypothesis to complement your research hypothesis in this case the null hypothesis going against your research hypothesis saying that routine is not good for vision so
you can think of the null hypothesis as a kind of a devil's advocate now the null and research hypothesis are mutually exclusive in that they both cannot be true at the same time and also they are mutually exhaustive because together they cover all the possibilities so the routine will be either good or not good right so this actually covers all the possibilities basically so if you think about the research question again is latin good for vision then it sounds too general for a practical investigation and does not capture what we want to do to test
the hypothesis so you probably remember i briefly mentioned this before about the opera operationalization right and so if you think about this uh if we go back to this question again is looking good for vision you know what do we mean by good or bad and what do we mean by vision is it something measurable at all so you need to make your research question more specific and suitable for statistical testing by way of operationalize operationalizing the relevant variables you want to measure so what is operationalization this process can be defined as a process of
detailing your research question further to a practically testable or measurable specification so this process enables abstract or general ideas or concepts empirically observable or measurable by breaching them with relevant measurements that are thought to represent the ideas or concepts so in doing so we need to consider the most optimal or relevant variables to measure to answer the research question for example um visual acuity can be one aspect of vision then we can say that you know having a better visual acuity can be a good thing for vision or vice versa so i just mentioned the
variables and then the variables are basically the things or constructs that change in either a set of attributes categories traits or qualities and if the things are changing this kind of properties then we can call this variable as qualitative variables examples of such variables are sex or color of someone's hair or i because the values you can assign to these variables are qualities right or categories so sometimes the qualitative variables are called categorical variables on the other hand if a variable changes in a characteristic taking and taking on different amount or numerical quantity then we
call this kind of variable quantitative variable so the visual acuity measured in log mark can be an example of quantitative quantitative variable because we assign numbers at the numerical quantities to represent visual acuity in log more unit and it is very important to identify these variables in a study because you know goal of many studies is to show if changes in [Music] one variable one or more variable would change or affect one or more of the other variables and we have special name as some other special names to indicate to differentiate these two different variables
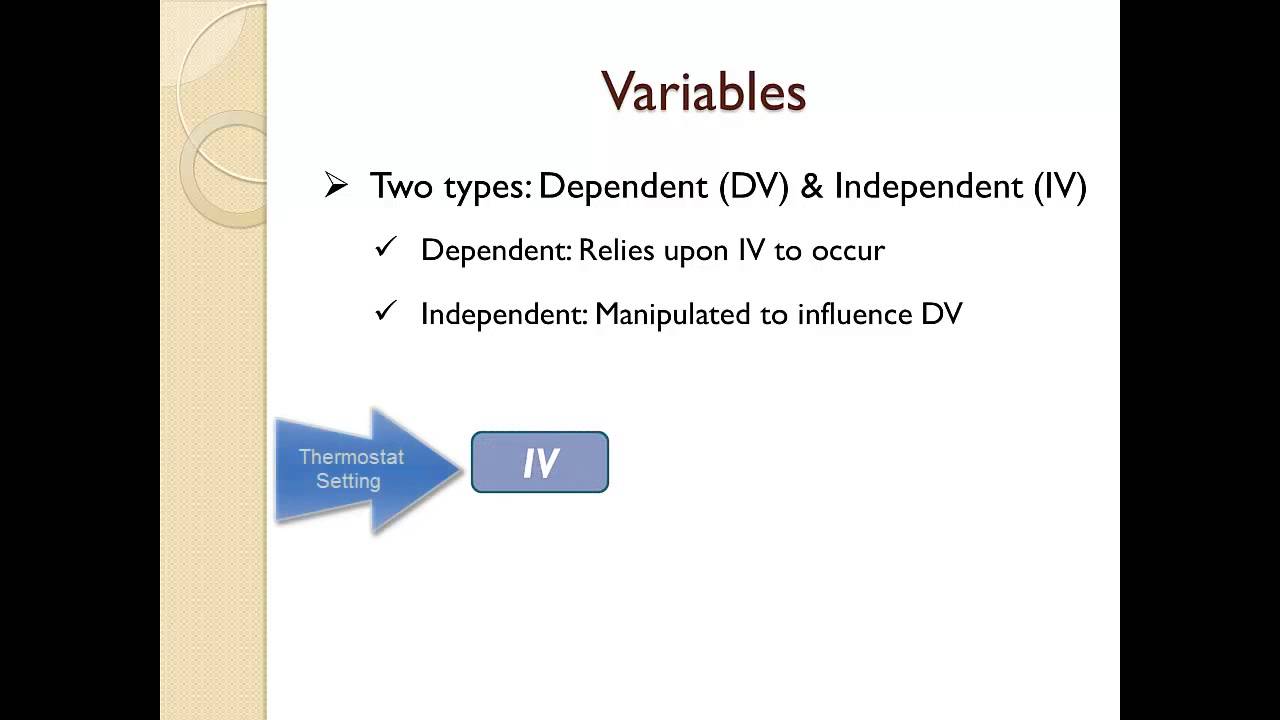
which are called response or explanatory variables so when the goal of a study is to examine the changes or relationship between any two variables each has different names depending upon the role they play in the investigation so the response variable measures an outcome of a research or study so if if you think about this the example of the routine the response variable will be the visual acuity right so this variable is assumed to change as a consequence of changes in explanatory variable in the latin example it will be the taking routine or the routine will
be the explanatory variable right and the response variable is um sometimes called in other names such as outcome measure or dependent variable okay so this is dependent variable because the response or the the measurement of this variable is dependent upon the changes in explanatory variable so the explanatory variable basically explains or influences changes in a response variable so this explanatory variable may or may not be one of the direct cause of the changes in the response variable the explanatory variable also has different name called an independent variable now let's take a look at the following
sample studies to see if we can identify response or explanatory variables in each of the study the first one is to investigate the relationship between the typical amount of alcohol a person consumes per day and the change in the level of alcohol in blood after an hour of drink so this study is um you know the the response or explanatory variable is quite um obvious when they are looking at the relationship between the two variables so in this case the response variable will be the change in the level of alcohol in blood after an hour
of drink because this is an outcome or the consequence of drinking a typical amount of alcohol right so in this case the typical amount of alcohol a person consumes per day will be the explanatory variable right so this variable is responsible for the change in the level of alcohol in blood after an hour of drink which is our response variable right so let's move on to the next study where it says the nhs collects information across uk population regarding body height and weight to document the overall characteristic of the population so in this case it
is not very clear if there is a response or explanatory variable because so in this case what they are measuring what nhs is measuring uh is two variables right they are measuring um body height and body weight so these are the two variables they are measuring but they are not necessarily looking at some kind of dynamics between these two variables such as relationship or if there's any change between these two variables so their goal is to just to describe the characteristic of the population and they're not necessarily looking at some kind of a relationship between
the body height and weight so in this case we do not have a specific response or explanatory variables okay so they're just measuring these variables by the way these two variables are quantitative variables because the values of height and weight we can assign the numerical values for those measurements and this is the same as the first study those two variables are the numerical variables too now let's move on to the final study where the study is to examine if patching on amblyopic eye for six months will improve the visual acuity acuity in the eye so
in this case two variables are being measured so one is the visual acute in the embryopic eye and the other variable is basically the patch right so this study is looking at the effect of patching on the visual acuity of the amblyopic eye so this study will measure the visual acuity in the amblyopic eye and to see if the change in visual acuity is the consequence of patching so um the explanatory variable in this case in this study is patching an amblyopic eye whereas the responsible variable a response variable is be a change in the
visual acuity or the improvement of the visual acuity in the amblyopic eye right so um we've been talking about the statistical hypothesis and this pair of statistical hypotheses have special name so the null hypothesis is the statement about the values of a known response variable when no effect is assumed so when you're setting up a null hypothesis um typically no change no difference no relationship is expected or assumed and this is the hypothesis you want to refute in favor of alternative hypothesis or h1 and this is typically your research hypothesis you want to support and
sometimes the null hypothesis is called h naught or h0 so if we just go back to the our lieutenant example then the corresponding null hypothesis for that study will be like overall taking latin will make no difference in visual acuity so this is going to be the null of that latin study so this is an example null hypothesis you can set up on the other hand the alternative hypothesis is basically the opposite statement against the null hypothesis h naught so typically you assume a change difference or relationship in the response variable when you're setting up
a alternative hypothesis and as i said this is typically a research hypothesis that you want to support against the null hypothesis so in the lutein example the alternative hypothesis will be overall taking latin will make a difference in visual acuity






![Hypothesis [Research Hypothesis simply explained]](https://img.youtube.com/vi/G4LPPS-8Co0/maxresdefault.jpg)