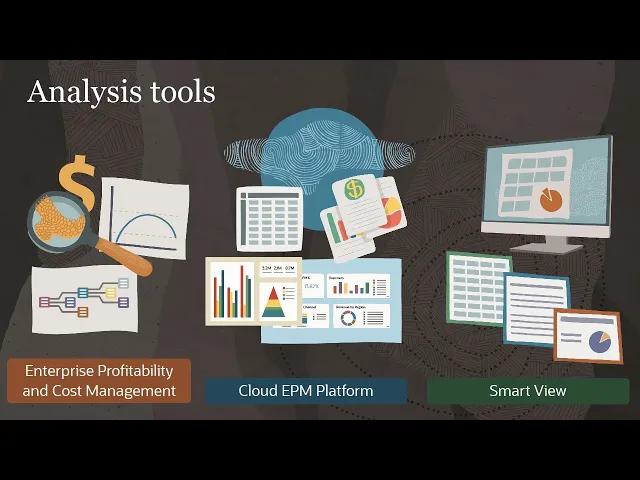
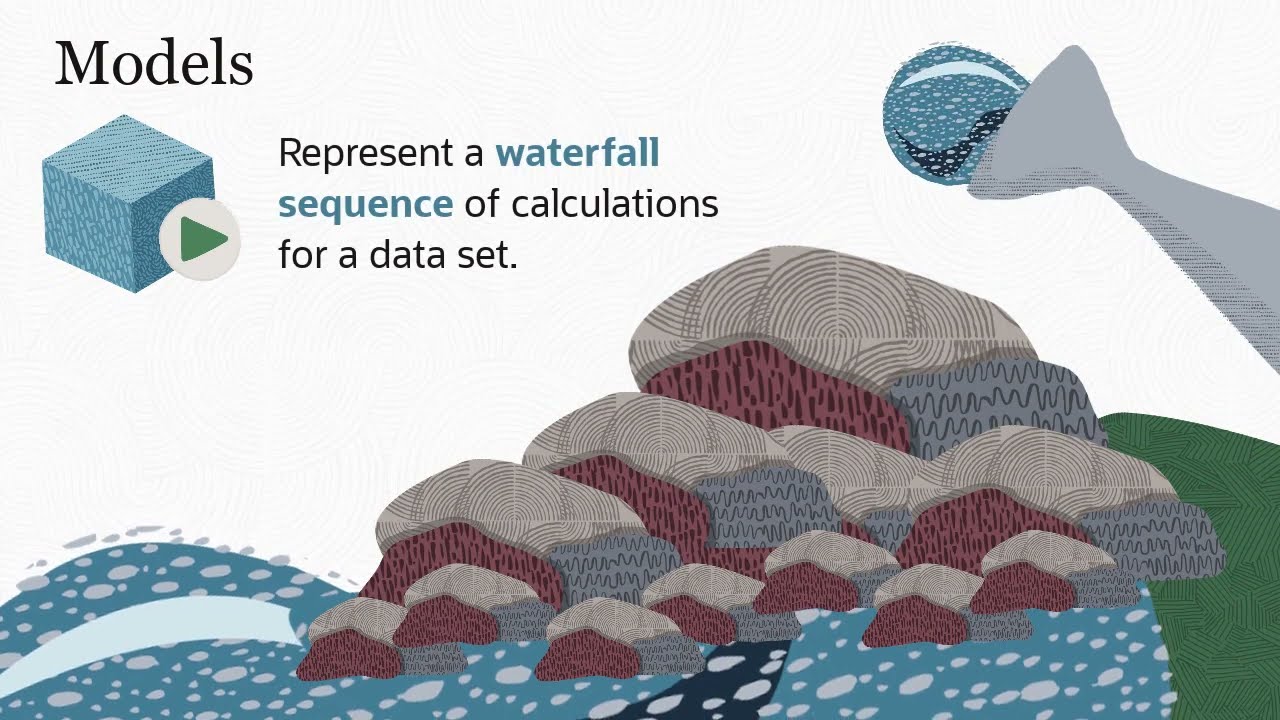
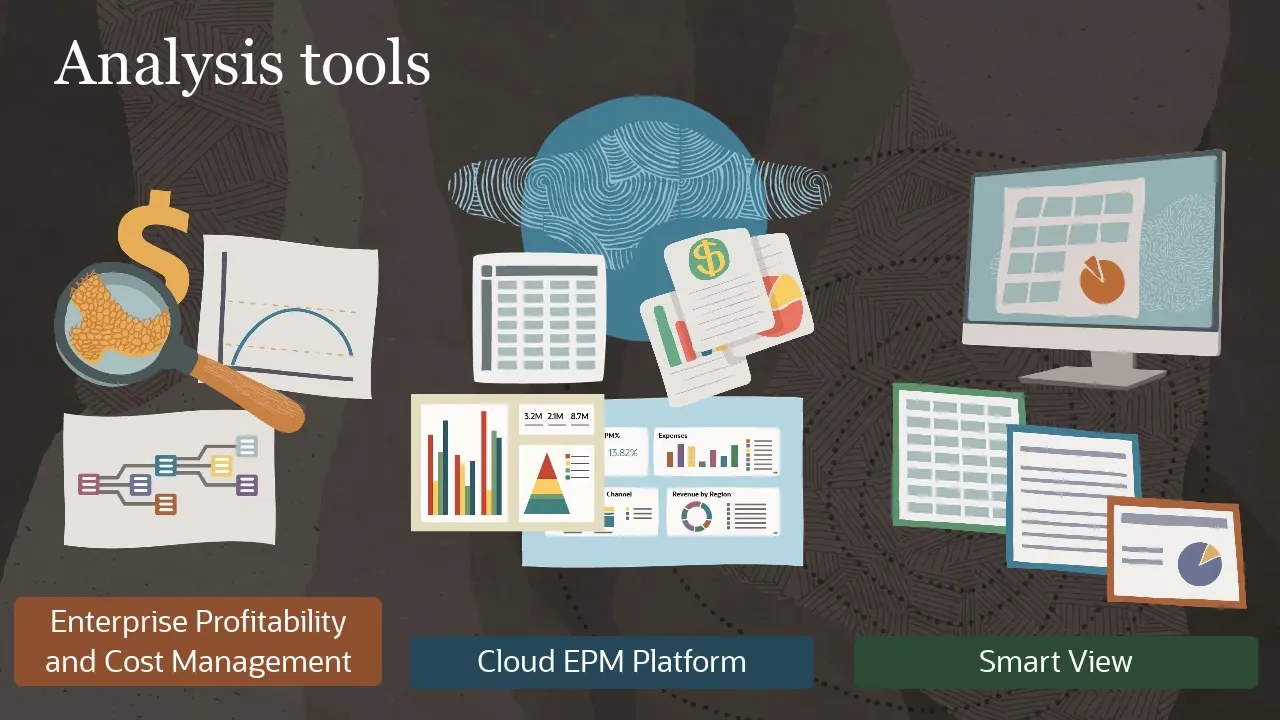
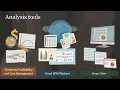
Enterprise Profitability and Cost Management gives you sophisticated modeling tools to transform your financial data using multistep allocations and calculations. But after you run your allocations, how do you analyze your results? The Oracle Cloud EPM platform provides customizable data forms, reports, dashboards, and infolets that can cover everything from detailed analysis to high-level management summaries.
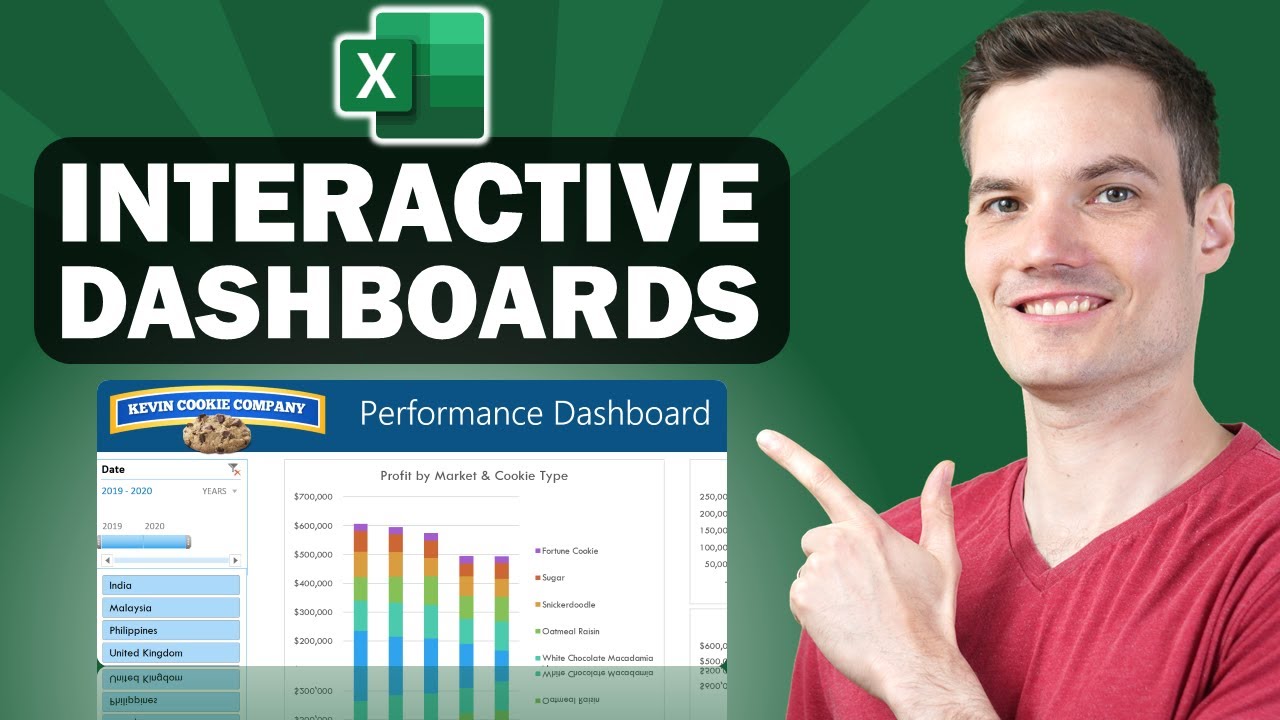
If you prefer to work in Excel, you can use Smart View, our Microsoft Office add-in, to work with live data. Smart View can also embed live data into Word and PowerPoint documents. And Enterprise Profitability and Cost Management has built-in intelligence tools for creating Profit Curves and tracing your allocations.
Let’s take a closer look at each tool. Data forms are used in many places – they’re used for data entry and are the foundation for dashboard and infolet components. They’re also the query tool behind rule balancing, profit curves, and allocation traces.
See the description for links to more videos about designing and creating data forms. Reports gives you a user-friendly and robust report development framework for creating dynamic, highly formatted reports. Drll to content lets you add links for users to drill to a target report, passing applicable context from one report to another.
For example, you can set up links to drill from summary data to a report with more detail. For Enterprise Profitability and Cost Management, where you have a lot of allocation detail, you can set up chains of linked reports where users can drill back through the allocated data to its ultimate source. The designer interface lets you add grids, charts, images, and textboxes to your layout, create formulas to calculate grid values, add text functions to dynamically retrieve metadata, add drill-to-content links, and add custom formatting.
Reports also includes books and bursting. Books let you group one or more reports, books, and other documents into a single PDF output. And Bursting lets you run a single report or book for multiple members of a dimension.
You can publish to PDF or static Excel workbooks. Additionally, with Bursting you can send emails with the published output attached to a list of recipients. Dashboards give you a versatile way to present and analyze summary data.
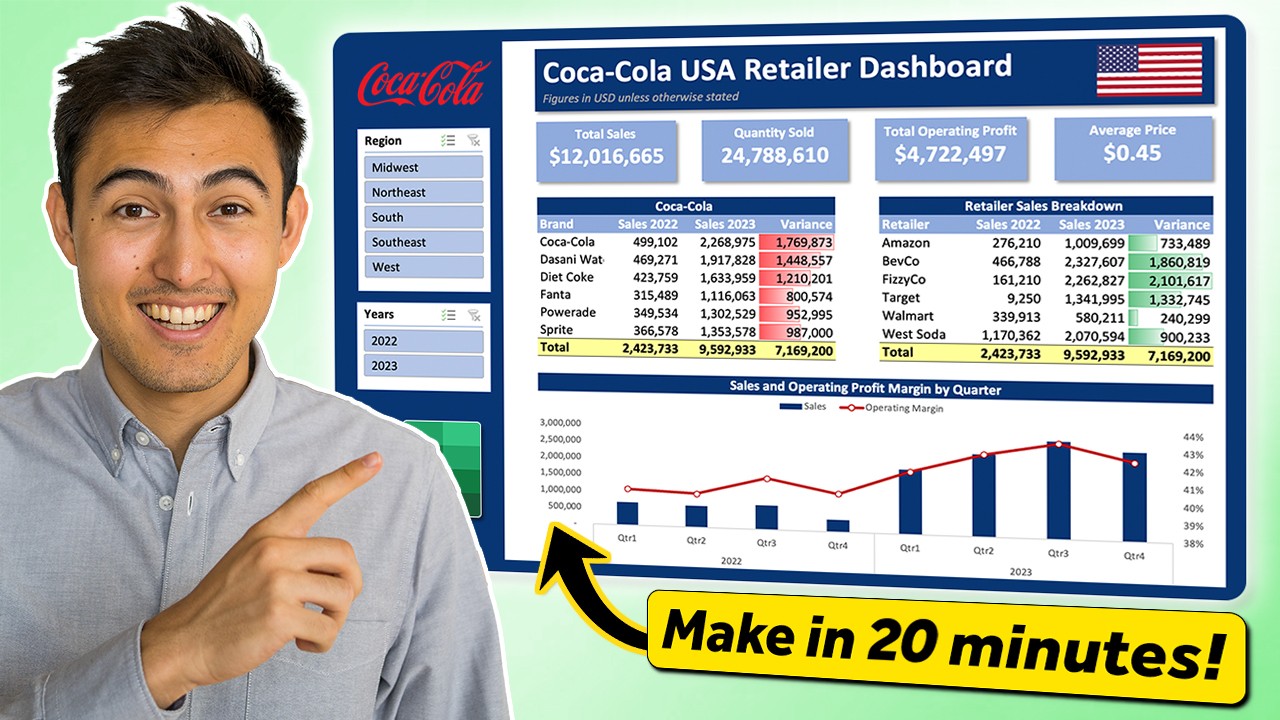
You can display a combination of data, charts, and information tiles in a single dashboard. You arrange and customize your dashboard components using a simple drag-and-drop interface. You can easily switch between design and runtime mode to verify what your users will see.
Infolets are interactive containers where you can display high-level, essential information. You can use infolets to group key information in ways that help your users quickly assess and prioritize their work. Smart View is a Microsoft Office add-in for Oracle EPM Cloud.
In Excel, you can view data forms or create ad hoc reports where you can pivot data and drill down for more detail. You can keep or remove metadata, and apply Excel formatting to your results. And in Word and PowerPoint, you can embed refreshable data points in your documents or slides.
Profit curves are native to Enterprise Profitability and Cost Management. The graph analyzes the profitability of a population dimension such as Customers or Products. The top of the curve shows the point where profitability starts to become negative.
You can quickly see what percentage of the population is profitable and unprofitable, see the proportion of the population that contributes to profit or detracts from it, and compare your potential profit to your actual profit. Finally, the allocation trace tool in Enterprise Profitability and Cost Management lets you follow the results of an allocation and see both upstream contributions to and downstream allocations from a member. With all of the tools available for analyzing data in Enterprise Profitability and Cost Management, you can start gaining insights into your business right away.
To learn more, visit docs. oracle. com.