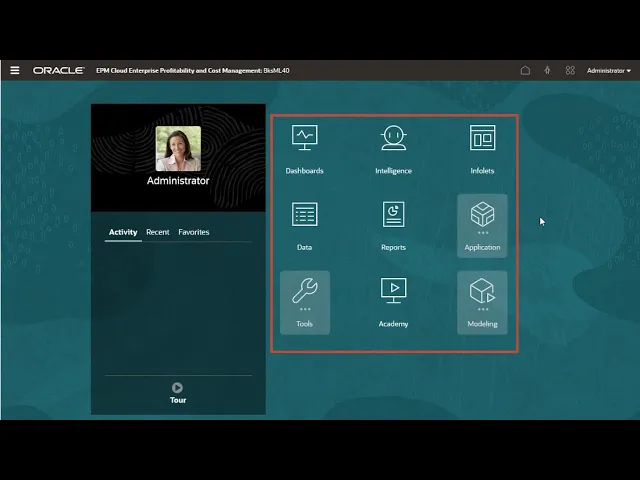
Welcome to Enterprise Profitability and Cost Management! On the home page, you’ll find all of your most common tasks and tools represented as home page cards or in clusters that group related cards together. The Application cluster contains tools to manage and integrate metadata and data for the application.
Among other things, this is where you’ll view cube statistics, build and maintain application dimensions, load data from external sources, and copy data between cubes in the application. Models in Enterprise Profitability and Cost Management contain rules for allocating and calculating your data. The Modeling cluster is where you’ll do all your work with models, from creating model logic to monitoring calculation results.
When you open a page, related cards are displayed along the top so you can easily get to them without returning to the home page. The Models page is where you create and manage models, which are containers for organizing sets of rules. You can create, edit, delete, copy, or inspect models here.
The Designer page is where you manage rule sets, allocation rules, and custom rules. The Waterfall Setup tab shows you at a glance the calculation sequence of the rule sets and rules for each model. On this page you create rule sets and rules for models.
You can also edit, delete, or copy rule sets and rules. Before running models you use the Model Validation page to validate the rules in the model. Validation checks for things like incomplete rule definitions and makes sure the system can run the rules in your model.
The Calculation Control page is where you perform calculation and data-related tasks. You can: Create data POVs to run models against. Edit the status of existing POVs.
Delete POVs, which removes their data and calculation history. Clear data from POVs. You can clear input data, adjustment values, and allocated values.
Copy POV data to a new POV. For example, you can seed a Forecast scenario with Actual data. Run models against one or more data POVs.
For example, you can run a forecast model against twelve months of POV data. You can also run all rules or just selected rules for a model. You can track the progress of calculation jobs and other actions on the Jobs page.
Calculation Analysis stores a detailed history of POV calculations for you to audit how the system calculated your results. You can inspect a POV calculation to view its performance details. The calculation history preserves a snapshot of the model when it’s run.
From the Actions menu on this page, you can rerun calculations for the selected POV, using the same model snapshot. You can also create a new model from the snapshot, run reports to document the snapshot or compare it with the current version of the model, and run a report that shows calculation statistics for each rule set and rule in the model. By selecting multiple POV calculations, you can run comparative reports on their calculation statistics and model snapshots.
The Rule Balancing page is where you review your calculation results at a high level, on a rule-by-rule basis. This top-down look at your rule progression can help you identify where data may not have been allocated correctly, so you can adjust your rule definitions accordingly. Clicking a link on this page opens a context-sensitive ad-hoc report in Smart View.
The home page also has a variety of cards for entering data and analyzing it after you run your models. You can use data forms for data entry, but they are also the foundational components for rule balancing, dashboards, infolets, profit curves, and allocation traces. The Data page is where you access all data forms— including data entry forms—and create Ad Hoc Grids.
The Reports, Dashboards, and Infolets pages are where you view, manage, and create custom reports, dashboards, and infolets, respectively. On the Data, Reports, Dashboards, or Infolets pages, click Create to see creation options. Click an item in the library to view it.
The Intelligence page is where you can create, manage, and view Profit Curve reports. This is also where you’ll find the allocation trace tool, which lets you view upstream contributions to and downstream allocations from a member. Another important analysis tool is Smart View, our Microsoft Office add-in for Oracle EPM Cloud.
Smart View lets you work with your data in a familiar Excel interface. You can also embed refreshable data in PowerPoint slides and Word documents. For more information on analysis tools, see our related overview.
To download Smart View, access the Settings and Actions menu from your user name and select Downloads. You can also find a link to download EPM Automate, a command line utility for Service Administrators to automate repeatable tasks like importing or exporting metadata and data. The Tools cluster contains useful administration tools.
Among other things, this is where you manage connections to other EPM systems, create custom navigation flows, and create and import backup snapshots of the application. You can access every feature in the system from the Navigation menu. And finally, you can open the Academy page for links to important videos and documentation.
To learn more, visit docs. oracle. com.