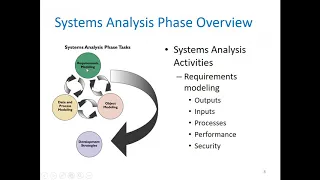
okay good day again to all of you so uh chapter four is all about requirements modeling and the specific task in requirements modeling is here in chapter five we have data and process modeling so what are the steps or what are the diagrams that we're going to create in order we could represent the data in process modeling so let's start our discussion in chapter five so the chapter objectives describe data and process modeling concepts and tools including data flow diagrams a data dictionary and process descriptions describe the symbols used in data flow diagrams and explain
the rules for their use draw data flow diagrams in a sequence from general to specific explain how to level and balance a set of data flow diagrams describe how a data dictionary is used and what it contains use process description tools including structured english decision tables and decision trees and describe the relationship between logical and physical models so for the introduction so starting from this chapter in chapter 6 you will develop a logical model of the proposed system and document the system requirements so the logical model shows what the system must do and then the
physical model describes how the system will be constructed so overview of data in process modeling tools systems analysts use many graphical techniques to describe an information system and one of them is the so-called data flow diagram or dfd this uses various symbols to show how the system transforms input data and into useful information okay data flow diagrams or dfd for short shows how data moves through an information system but does not show program logic or processing steps a set of dfds provides a logical model that shows what the system does not how it does it
so actually the process the processes that we're going to discuss here are called black box because uh it shows what it shows how it uh what is done but not how it is done so these are the following dfd symbols okay we're using two types of symbols we have the gain and sarson symbols and the jordan symbols for me the most commonly uses i've seen in the books is the game and sarson symbols but then again they can be used but they cannot be used as a mix-up no if you're going to use gain and
sarson use gain and sarson if you're going to use jordan symbol then use jordan symbols exclusively so let's uh have a um let's have a an agreement it's better to use it's better let's use gain and sarson symbols for uniformity and standardization of the dfd symbols that we're going to use so let's forge a discussion let's just see the difference so the process is this is for the gain and sarson symbol and then uh a circle for jordan symbol and then data flow of course it has an arrow and the data to be transformed or
to be transformed from one process or from one entity to the other just like the same with the jordan symbol for the data store they are similar it's just that uh for the left side of the gain and sarson you will put here the number of instance of the data store and then for the external entity so customer has a shadow a square with a shadow and then customers just plain flat square so again for uniformity of using symbols let's use gain and sarson symbols okay first we have the process symbol the process symbol receives
input data and produces output that has a different content form or both because of course it's like in a computer data and then when it's processed it becomes information so the data will be transformed to another form and then it contains the business logic also called business rules and referred to us black box as i've said black box it does not show you how it happens or how it how it's done but it only shows you what is done okay so we have another one we have the data flow symbol okay let's just see for
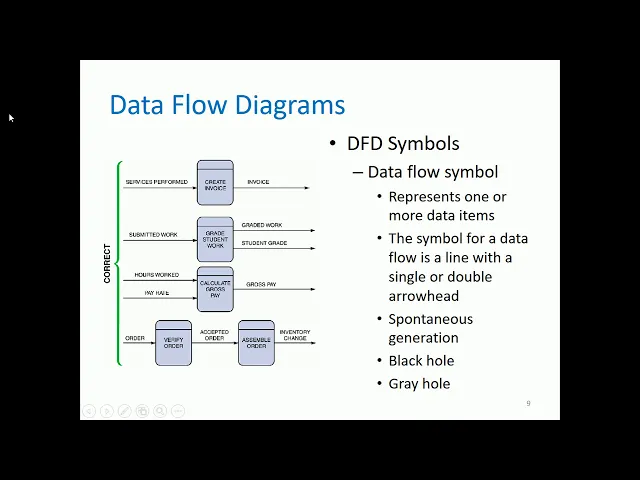
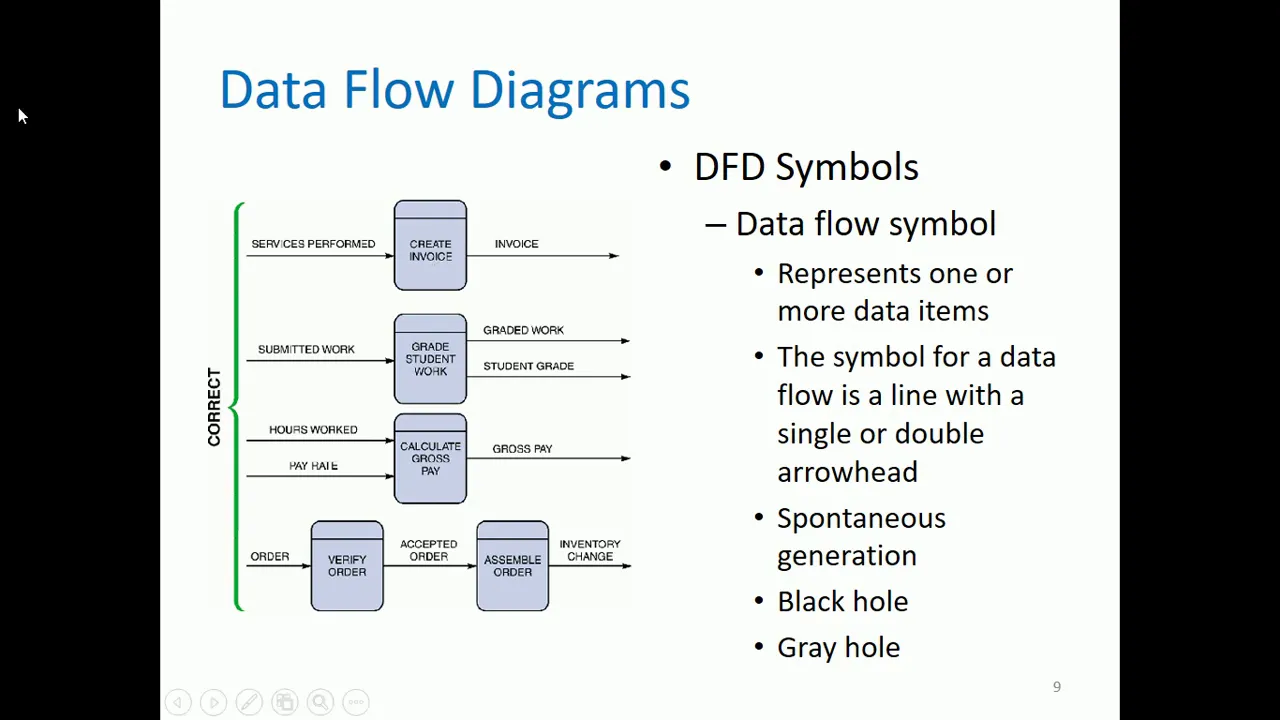
example these are the correct implementations of using a data symbol and a process symbol but let's just finish the description for the data symbol then let's go let's go back with the illustration so the data flow symbol represents one or more data items the symbol for a data flow is a line with a single or double arrow head single it's unidirectional and then double arrow head if it is bi-directional then it has a spontaneous generation meaning you have one input data but the process can produce many uh data flows outside are going out from the
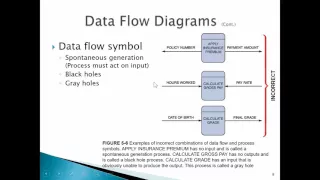
process okay we have this black hole all right black hole means as you can see for scientific in science black hole means if you entered a black hole there's no way out for this um type black hole means you have an input for the process but that process does not have an output so that is an example of a black hole so what is a grey hole so a gray hole is example you're going to calculate the employee salary that's the process the input is student's grade and then computed salary for the output that's already
a great hole why why do you need a student's grade for for you to calculate the employee salary so that's an example of grey hole wrong data but the information that is uh going out from the process is correct okay so we also have another it's not just uh it's not mentioned here but i read in an article about tfd there is also so-called miracle miracle is opposite of black hole you don't have any input but you do have an output from the data flow symbol meaning you did not put any information any data but
then the process has an information going out so that's a miracle so again let's go back with this one so these are the correct implementations of using the process symbol and the data flow so okay for the data flow uh what we are going to put here are nouns or this one services performed this data will be will be transferred to create invoice and then as you could notice for the process symbol since this is a process you it should have it is a transitive verb a verb and then with a direct object create invoice
and then you're going to um it's not imagine you're going to analyze if the process create invoices finished what is its by product so we have invoice there are many instances that what is written for example create invoice what is written in here will be the output but it's not always the case but i'm saying majority of the output or the information or the byproduct of the process came from the process labe a symbol label itself so this is an example this is correct next is our process is student a grade student work so our
data flow is submitted work of course you need the data of submitted work for you to grade the student work and then after you're you finished a grade student work you will have degraded work for the output or by product of the grade student work and the student grade it is two so that's why that's the so-called spontaneous generation so this is also this is an example that not it's not the case that if you do have the student work it will be also the uh the output of course because grade student work student work
here is not yet graded so of course if you're going to analyze if you are finished with the student work what will be its output of course it is already graded and that graded work has a corresponding student grade so this is another example okay nexus we have the process calculate gross pain so what is the data that is needed for the calculate cross pay we have hours work and pay rate okay so you need that uh two data house hours work and pay rate and then what and then you're going to ask again what
if calculate gross pay is finished what is its by-product so we have gross pay just like the first example um the gross pay will also be the output okay nexus we have this is also a correct implementation so the data flow again always remember for the data flow you should put noun so the data for order and then you have to verify order of course after you verify order what will happen or what's it's by product so its output will be since it's already verified verified the order is already accepted and then this data would
be the input for assemble order and then what will happen or what is the byproduct of assemble order is we have inventory change inventory change meaning that you're going to add additional product because you have um assembled the order okay these are correct implementations of process symbol and data flow symbol okay next we have the data store symbol it represents the data that the system stores the physical characteristics of a data store are unimportant because you are concerned only with a logical model because data flow model is a logical model so again you don't care
if if it's stored in a server in a blade server or just in a hard drive in a computer what is important is the representation again because it is a logical model so this again are the correct implementations for a process symbol with the data store and data flow uh hi we have this process do not assume that uh this is the only uh the only dfd there are only uh snippets of a dfd so that you could have an example so not the generic or very big dfd that you're going to show so for
simplicity example we have a process process which is post payment and then it's byproduct is customer payment and then this data will be stored of course in the data store daily payments and then this daily payments what are the by-products or what information does this uh this data payments data store has we have the daily payment and it will be a need the needed data for prepare deposit another example is we have create invoice of course what is the by-product or what is the finished product if create invoice is finished then you will have the
invoice and this will be stored in the accounts receivable and then as you can see we have uh we have eight uh two directions one going to accounts receivable going to post payment and then the data flow is invoice detail and then another one from post payment we have the payment detail and it is stored in the accounts receivable and then for admit patient another example after you admit the patient what information you will have we have the admission form and then this admission form will be stored to patients data store and then from this
data store you can view the in the data for symptoms and this will be an input for the diagnosed patient and then for treat patient then uh what is the uh what is the byproduct of treat patients we have treatment and then it will be stored in the patient's data store so these are examples of data store symbol and how it is done all right we have the entity symbol the name of the entity appears inside the symbol so entity symbols are the names of it are nouns okay there are so-called terminators because they are
sometimes the last uh the last um receivers of information then it is already the end example you are the customer and uh if you already done the process of for example paying and then you accepted the receipt so that's the end of the whole logical model process and then you are the terminator if your can the entity symbol can also be called a source because for example if you're the customer if you're going to pay so to start the transaction is you have to pay so that's that's why you are called the source for the
information and of course sync sync is you are accepting the output of the process but not necessarily you are already the terminator sometimes the one that you accepted as a data or information it is the input to the next process so in this on the left side you can see the correct and incorrect examples of data flows so it is correct process to process then we have this data flow another process to external entity this is also a correct example or process to data store this is also a correct example so what are the wrong
implementations for data flows first is external entity to external entity external entity to data store and then data store to data store so how are we going to correct this wrong implementations actually the only technique here is for two entities they must have a process entity or process symbol in the in the middle also for the entity and the data store a process symbol in the middle and for both data store a process symbol in the middle because if it is connected entity to entity or entity to data store or the same as data store
what will happen what is the process so that's why this is wrong for every entity for every uh data store and for every data store connected to another data store there must be a process between them they cannot be connected directly so how are we going to create a set of dfds so create a graphical model of the information system based on your fact-finding results first you will review a set of guidelines for drawing dfds then you will learn how to apply these guidelines and create a set of dfds using a three-step process so what
are the guidelines for drawing the efts so draw the context diagram so that it fits on one page so a context diagram must be fit to one page only and then use the name of the information system as the process name in the context diagram or the process the process zero then use unique names within each set of symbols do not cross lines because the more complex your dfd is it's difficult if you're going to cross lines for the data flows and then you're going to be confused where is this where is the actual label
of this data symbol is it this one or that one if they are crossing lines and then provide a unique name and reference number for each process and then obtain as much user input and feedback as possible okay before we go into uh draw or create tft you have to remember that it's better or it's easier to create the edfd if you already have a list of steps for a business process it's difficult if you're going to create a dfd while imagining it it's bad again if you're going to create a set of dfds you
have to have already a step-by-step process or procedure of how this business process is done okay so for these examples it is assumed that it has a documentation a step-by-step procedure okay so draw a context diagram um actually um in my in my own case as us i know how to how to create dfds uh i have another technique i always start with the diagram zero and then last is the context diagram but but mind you but in presenting the of this it's always the context diagram to be presented first um i'm going to show
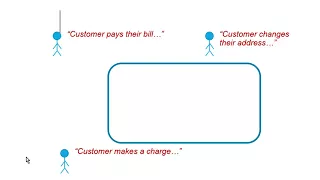
you why i'm doing the diagram 0 first and then last is the context diagram so again let's go first with a context diagram so this is an example of a grading system so it is said that the grading system it has already has a process and then its id is process zero okay so we have external entities or entities student record system okay entities can be persons can also be a separate information system or an institution so that that these are the common entities and then of course another entity we have a student and instructor
so from the student record system it will provide the information of class rooster as input to the grading system and then the student as input it will submit uh its work and then it will be in uh it will be a place in the grading system and then we have we have this one instructor grading parameters it's their input to the grading system because the grading parameters example 50 is for the major exam five percent for attitude five percent for project so and and so forth that is the grading parameters and then coming from the
grading system is we have the final grade which will be stored in the student record system and then from the grading system also after submitting the work there's a graded work to be given to this back to the students or return to the student and then for the instructor since he or she has provided the grading parameters the grading system will provide a grade report to be given to the instructor so process zero represents the entire grading system okay again context diagram contains the process zero that's why i'm emphasizing because uh in the next slide
maybe you're confused i just want to clarify that that is process zero the process that is contained inside the context diagram okay so we have step two draw a diagram zero dfd so this is already the context diagram from the previous slide okay again process zero is different from diagram zero do not be confused okay it uh diagram 0 is not context diagram that's a very very big mistake that's it's already been the mistake of those who are creating information systems as their thesis projects but then when i review their document they are always mistaking
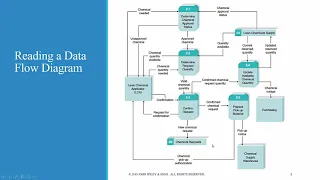
that the diagram 0 is the context diagram it's a different diagram how it is how is it differ okay let's go back again to the context diagram so the context diagram is this one it contains as i've said process zero which is the grading system this grading system if you're going to expand it or you're going to explode process zero you're going to produce diagram zero which is this grading system it's expanded or exploded version is this one the process one process two process three and then process four and then we have the great book
okay so again context diagram is different from diagram 0 because context diagram contains d process 0 and if process 0 is expanded or exploded it will produce this diagram which is the one it is which is called the diagram 0 dft okay so this is again the exploded version of the process zero um disregarding of course the entities because it is included in the context diagram okay so this one okay um why am i saying in the previous discussion that um in my practice i always start with diagram 0. um for me it is easier
because as i've said it's easier to create dfd if you do have already uh step-by-step procedures you're going to analyze if the step-by-step procedures can be combined can be omitted or is it the original step-by-step procedures and then for example if it's the original step-by-step procedures uh for example for the grading system okay what are the identified step-by-step procedures okay it is identified they have four procedures we have established gradebook for process one process 2 is assigned final grade process 3 is grade student work and then process 4 is produce grade report so again for
student record system it will output its class roster that will be needed by process one establish gradebook and then since class roster and then we already have the gradebook what will be its by-product the class gradebook and it will be stored in gradebook which is data store 1 or d1 okay then the instructor will input its grading parameters to establish gradebook and then for process number two assign final grade so how are you going to assign final grade it's by getting grading detail from the grade book and then also assign final grade this will be
the byproduct of assign final grade is of course the final grade it will be stored in the student record system and this final grade or also as you can see this will also be stored in the gradebook data store and then for the process number three grade student work so after grading the uh the students work you will have a grade student grade and then this will be stored in the gradebook and then another one is we have the uh uh again in the process grade student work the output is graded work and it will
be given back to the student and of course before before it is graded the student must submit the submitted work and then for the fourth process produce grade report it needs the class detail for the input and then after uh the produce grade report it will have a byproduct or an output of grade report and it will be given to the instructor so this will this is an example of the diagram zero as i've said why do i need to create first the diagram zero because if you already have a step-by-step procedure and then you
have already identified the data store it is easier to assign the data flows from that you're going to make to the from the uh on the context diagram example student record system because it's the same with the context diagram you're going to identify so from the student record system uh it uh it outputs the class roster so as you can see this is the class rooster and then also from the grading system um it needs the final grade as input as you can see this is the final grade four as input student record system and
then for the instructor as you can see in the diagram zero we have an output grading parameters going to the process so these processes are included in the grading system so as you can see it is also going to the grading system and then another um it will accept the data grade report so as you can see from the process it's included in the grading system so we have the grade report and then for the student uh it will um it has an information it will output an information to be submitted to the grade student
work so we have submitted work so for the student submitted work going to the grading system and then of course it uh the grade did work from the process number three will be returned graded work will be returned to the students so as you can see the graded work will be returned since process 3 is also included in the grading system so for me it's easier to create context diagram after identifying at least the diagram 0 dfd okay if the same data flows in both direction you can use a double headed arrow if same data
flows okay but if there are different data flows of course you cannot join them in one data flow symbol diagram 0 is an exploded view of process 0 as i've said and then we have the so-called parent diagram so let's go back to the context end um diagram zero so process zero this is the parent diagram of diagram zero okay and then vice versa process one two three and four all the chart child diagrams of grading system and then we have the so-called functional primitive dysfunctional primitive means example let's go back again example establish gradebook
if this established gradebook does not have any more um separate sub steps for example how to establish a great book number one get the class roster number two then so on and so forth if you can still identify sub steps for this process it means this process is not yet a functional primitive you have to explode it to another diagram okay if you explode process 1 process 2 or process 3 process 4 the exploded version of process one will be called diagram one okay diagram one dfd alright next is draw the lower level diagram so
must use leveling and balancing techniques so leveling examples use a serious series of increasingly detailed dfds to describe an information system so we have the exploding partitioning or decomposing so this is an example of this is already an exploded or lower level diagram because as you can see as as you can see the previous from the previous example it is for example one process one two three and four but for this example we have one point one one point two one point three meaning that this is an exploded version of the process one okay but
in our case um it's just enough that you you we know how to create context diagram in diagram zero at least the basics of creating dft is important to be to be learned in our case okay for balancing techniques ensures that the input and output data flows of the parent tfd are maintained on the child the fd so that's what have been saying you have to make sure that the data flows with a child and parent are just the same with the same that i demonstrated in the context and context diagram in diagram 0 dfd
okay i'll provide a separate video tutorial of how to create an actual dfd because it's already made in our discussion so that you will be guided and how to um how to create and then you're going to think and analyze based on the list of steps that you will be having so again a very good tip for creating the fd you must already know the step-by-step procedures of the business process that you're going to model using the fd all right let's go with data dictionary so a data dictionary or data repository is a central storehouse
of information about the system's data an analyst uses the data dictionary to collect document and organize specific facts about the system it also defines and describes all data elements and meaningful combinations of data elements so a data element also called a data item or field is the smallest piece of data that has meaning data elements are combined into records also called data structures a record is a meaningful combination of related data elements that is included in a data flow or retained in a data store so for data dictionary you could use you can use case
tools for documentation the more complex the system the more difficult is it is to maintain full and accurate documentation so modern case tools simplify the tasks and in a case repository ensures data consistency and then case tools in part 2 of the systems an analyst toolkit is included for this for the book of ross and black and then we have documenting the data elements you must document every data element in the data dictionary the objective is the same to provide clear comprehensive information about the data and processes that make up the system so this is
an example of a data dictionary so it is indicated here the system which is payroll and then the data is november 15 2011 for example and then the label is social security number alias or short term for social security number is ssn and then type and length is nine n so n means numeric nine digits default value is none source is employee application form acceptable values any positive number so that's why 9n and then security payroll department so there are the ones whose go who can only access the uh this data and then user responsibility
is also the payroll department and then description and comments if they have any um comments and description okay then the following attributes usually are recorded and described we have the data element name and label alias type and length default value and acceptable values domain and validity rules it acceptable values is used for data validation and then also the source security responsible user or users description and comments as you can see in the table so the typical attributes are as follows we have data flow name or label description alternate name or names origin destination record volume
and frequency data offer for that is for the uh the uh for the data flows and then for the data stores is we have the typical characteristics of a data store are data store name or label description alternate name or names attributes volume and frequency and then documenting the processes so these are the typical characteristics of a process process name or label description process number and process description and for the entities so the typical characteristics of an entity include the entity name description alternate name or names input data flows and output data flows and for
the records the typical characteristics of a record include record or data structure name definition or description alternate name or names and then attributes so next we have data dictionary reports so many valuable reports an alphabetized list of all data elements by name a report describing each data element and indicating the user or department that is responsible for data entry updating or deletion a report of all data flows in data stores that use a particular data element and detailed reports showing all characteristics of data elements records data flows processes or any other selected item stored in
the data dictionary so data dictionary report is composed of many various vulvable reports okay so we're already finished with data dictionaries next is we have the process description tools a process description documents the details of a functional primitive which represents a specific set of processing steps and business logic it should be noted that this chapter deals with structured analysis but the process description tools can also be used in object-oriented development which is described in chapter 6. so for modular design based on combinations of three logical structures sometimes called control structures which serve as building blocks
for the process so process description tools can be in sequence can be in selection or can be in iteration or looping if if you can remember your programming subject sequence they are done in in order and then selection you're going to process a certain line of code depending on the condition or the selection and then of course iteration you're going to repeat a certain block of code depending on the condition okay next we have structured english must conform to the following rules use only the three building blocks of sequence selection and iteration use identity identitation
for readability use a limited vocabulary including standard terms used in the data dictionary and specific words that describe the processing rules so structured english might look familiar to programming students because it resembles pseudocode against pseudo code means pseudo false false code you cannot really use that sudo hold in any uh programming language because it only deals with the logic not actual not the actual syntax and semantics of the programming language and then the primary purpose of structured english is to describe the underlying business logic example we have the structured english version of the sales promotion
policy so we have this condition if customer is a preferred customer and another condition or nested condition if customers order more than 1000 then apply a five percent discount after applying a five percent discount and if customer uses are charged card then apply an additional five percent discount so a person who orders more than one thousand dollars and uses the charge card total he or she will have a ten percent discount what if this customer who orders more than one thousand dollars but did not use the charge card what will happen so it will fall
to this one else award a 25 dollar bono bonus coupon so again the order because the customer orders more than one thousand dollars so you're going to apply a five percent but does not use a charge charge card so uh the customer has a five percent discount and a 25 uh dollar bonus coupon but what if a customer is just a preferred customer but did not order more than one thousand so uh his uh the customers only um award or perk or freebie is award a five dollar bonus coupon so this is how you're going
to analyze the structured english version of the sales promotion policy okay another one is we have decision tables shows a logical structure with all possible combinations of conditions and resulting actions it is important to consider every possible outcome to ensure that you have you have overlooked nothing okay for decision tables i don't know if you're familiar with your digital electronics if you can remember constructing truth table and how to construct for example if you have two variables you need four combinations because a two raised to two is equals to four and then if you have
three variables so the possible combination that you should have in the truth table is eight because two raised to three is equal to eight and then another one if you have four variables in your boolean equation um how are you going to represent it in the truth table you need 2 raised to 4 is equal to 16 16 possible combinations so decision table is also like that for this one these two characters are these two descriptions here this are the conditions credit status is okay product is in stock so one two since you have two
conditions again just like the principle of identifying how many combinations you have to have in the truth table so you are going to use the exponential two so two raised to two is equal to 4 so that's why you have 1 2 3 4 possible combinations and then just like in truth table but it's not represented as 0 and 1 change 1 to y and change 0 to n or no so that's why the possible combinations here is y y n n and then y n y n so that's the uh combinations for these conditions
so for example in this um number one if credit status is okay and product is ins in stock so the resulting action is you have to accept the order okay what is the second condition the credit status of the buyer is okay but the product is out of stock so that's why it is no would you accept or reject order of course you're going to reject order because the product is out of stock another one the credit status of the buyer is not okay but the product is in stock would you accept or reject order
of course again you're going to reject the order because the buyer does not have enough fine finance or not it has does not have enough money to pay for the product and of course the last condition the credit status of the buyer is not okay and the product is out of stock so it's the same no so of course are you going to accept or reject the order of course it will be reject the order so this is how you're going to create the decision table so to create the decision table you should have conditions
and resulting actions and then the number of the number of the combination of conditions depending upon the number of conditions again you have to follow the if it is two two conditions two raised to two is equal to four and then if you have three conditions two raised to three is equals to eight and then if you have four conditions 2 raised to 4 is equal to 16 so that will be very large and then you also have the resulting actions so the number of rules doubles each time you add a condition as i've said
two two then four four eight sixteen it always doubles each time you add a condition can have more than two possible outcomes and then often are the best way to describe a complex set of conditions okay we have another process description tool which is called decision trees so this is actually the decision tree version of the structured english so um for me it's easier to understand than the structured english okay so we have you must create a question that is uncerebral by yes or no okay preferred customer if it is no five percent bonus coupon
and then preferred customer if it is a yes okay ordered more than one thousand okay if it is no you'll just give him or her a 25 bonus coupon but if the customer which is a preferred customer ordered more than one thousand so it's a yes so did he or she used our charge card if it is no you have a five percent discount and then if he or she use a charge card it is a yes five percent discount and additional five percent discount so that is the decision trees it is always too to
weigh uncerebral by yes or no so we have logical versus physical models while structured analysis tools are used to develop a logical model for a new information system such tools also can be used to develop physical models of an information system a physical model shows how the system's requirements are implemented so the sequence of models so many systems analysts create a physical model of the current system and then develop a logical model of the current system before tackling a logical model of the new system uh why are they doing this so to for uh to
further identify what are the persisting problems in the information system first create the physical model and then the logical model of the current system and then you're going to create the corresponding logical model of the new system already removing the problems that you have identified from the current system and then performing that extra step allows them to understand the current system better so it is an advantage though it's very uh taxing it that it it will uh have a more workload but but by doing that extra step there are the the systems analysts can better
understand the current system and then we also have this four model approach how is it done so develop as a physical model of the current system a logical model of the current system a logical model of the new system plus a physical model of the new system the only advantage of the four model approach is the added time of course because she's still going to create the physical model of the new system okay so we have already finished with chapter five so let me read the chapter summary so during data and process modeling a systems
analyst develops graphical models to show how the systems transforms data into useful information the end product of data and process modeling is a logical model that will support business operations and meet user needs data and process modeling involves three main tools the data flow diagrams a data dictionary and process descriptions data flow diagrams or dfds graphically show the movement and transformation of data in the information system the fds use four symbols we have the entity we have for the process the data flow and the data store and then a set of dfds is like a
pyramid with a context diagram at the top the data dictionary is the central documentation tool for structured analysis each functional primitive process is documented using structured english decision tables and decision trees structured analysis tools can be used to develop a logical model during one systems analysis phase and a physical model during the systems design phase okay so we're already finished with chapter five so if you do have questions feel free to comment and ask and then this chapter is very important because if you are going to develop an information system um this is important because
you're going to create of course a logical model of the system which uses the data flow diagram so again if you do not have any questions so thank you very much for listening so i hope that you could watch for the additional video tutorials that i will be providing and please like and subscribe this video thank you very much good day and stay safe