as news outlets all around the world continue to publish articles about the upcoming great recession and the fact that the s p index has dropped almost 21 percent year to date should we as investors be concerned with our current strategy of dollar cost averaging into the s p 500 index in this video we're going to be looking at this question and whether it's a good idea and what are the risks so what is the s p 500 well essentially the s p 500 is just a market tracking index of the top 500 companies that are listed on the us stock exchanges this approximates to about 80 percent of the market capitalization of all u. s listed companies according to sp global the s p 500 index was created in 1957 making it the first u. s market cap weighted stock market index as of the 31st of december 2020 sp global estimates that there is approximately 5.
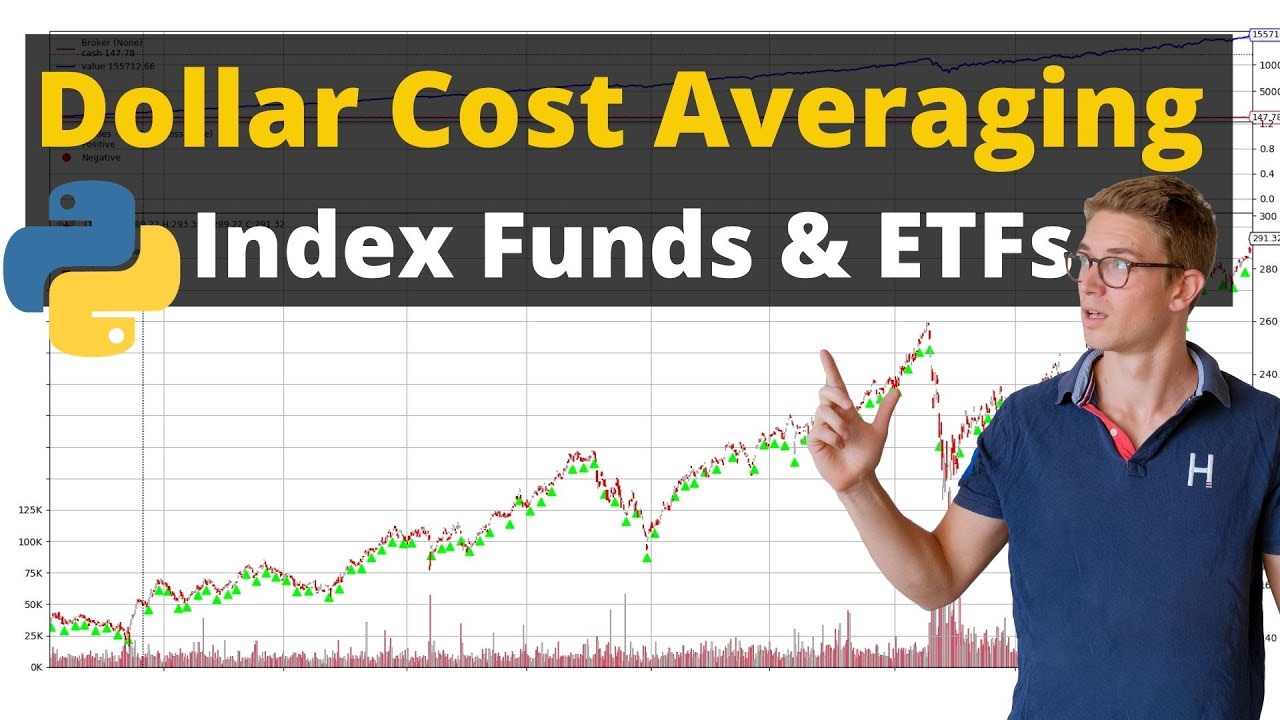
4 trillion us dollars that's invested globally into products that actually track this index there are over 165 index listed products listed on the s p global website alone although the s p 500 index was officially launched in 1957 the valuation goes back all the way to the 3rd of january 1928 but it's important that you understand before 1957 this is only a hypothetical back-tested index and therefore it's not actual performance of you the u. s 500 top listed companies but instead based on an index methodology that was actually established at the time of listing this index now one of the products that's actually listed on the sp global website as tracking the s p 500 index is the spy now the spy or spider s p 500 etf trust was the first etf listed in the us according to state street global division launched in january 1993. now the fund objective is like all other funds that track the s p 500 index so this instrument's main goal is to provide exposure to the price and then the yield performance of the s p 500 index before expenses according to statista as of the 21st of june 2022 the spy is the largest market etf in the world by assets under management with approximately 336 billion us dollars under management but despite being well diversified across a number of industries and the fact that this index is actually built from the top forming companies within those industries in the us during periods of economic distress and uncertainty the s p index and related etfs can and will go down substantially this happens as businesses and analysts across the financial industry re-evaluate and re-estimate their cost basis going forward and therefore their cash flows and growth prospects into the future now one of the most common pieces of advice i see around the internet for people of our generation is that we should be doing dollar cost averaging into the s p 500 into a market tracking index even warren buffett recommends this strategy to investors who don't want to devote the time to do their own business analysis so i really wanted to question this general knowledge and actually instead of looking for papers on the internet telling me that it's the best thing to do possibly for passive investing i wanted to go through the numbers and look at the historical s p 500 index create a synthetic spy like investment product and then consider a 25-year holding period for different age individuals looking for retirement over that period we're then going to look at all the results and judge whether lump sump investing or dollar cost averaging is better and what the risks are associated with each of those strategies so to kick things off let's look at the performance of investing in the spy etf over the last 25 years two individuals one is a 25 year old in july 1997 who comes into 300 000 us dollars now he is going to lump sum invest into the spy the other 25 year old at the same time only has 10 dollars to his name however he's just begun working saving and plans to invest 1 000 us dollars per month on the first trading day of the month in the spy etf now we're going to be quite harsh on these individuals every trade they make we're going to make the assumption that they're paying 10 in brokerage fees which is uh very conservative we're also going to make the unrealistic assumption that they're able to buy on the closing price on that particular trading day now we're going to track both of these strategies through to today at when they're 50 years old and see how they've done over the last 25 years now unsurprisingly the 25 year old who came into hundred thousand dollars and invested in the spy has done extremely well he has just under 1.
24 million dollars at the end of the term with a total return of 924 000 in comparison the person who's been dolocos averaging finishes up at the age of 50 with 772 000 for a gross return of 472 000 although they have made a positive return there are periods where they had contributed more money than the value of those current uh spy etf shares and this is important to remember that despite being short-term fluctuations that over the long term in both of these scenarios we have actually got a positive result with quite a good annualised return now if we consider this in terms of gross percentages the lump sum investor received a 313 gross return while the dollar cost averaging investor received 157 return this is slightly unfair because really the person who was working and contributing 1 000 every month did not have that capital to invest at the time so what we actually need to consider is what was the fund value return for that particular investment now calculating the fund value return methodology is simply just with respect to the cash flows and the actual number of units of the underlying so for example when the first investor buys x amount of shares in with one thousand dollars and then comes back into the market and buys another y units of shares then all you're doing is you're accounting for the time differences between those two investments to get a weighted average cost of capital for your total units of share consider it this way essentially each time you're buying x units of shares you're buying it for a certain price and those units make it all the way to the end of maturity if you hold on to them and the return for that particular investment over that time period is calculated then you then come back into the market in one month time and then you buy x units of shares or y units of shares it could be different for a different price and now you need to consider how many units of y shares returns over that time period all the way until your holding period and then you do this continually for the next 25 years so the fund value return takes into all these cash flow considerations and extra units of shares into consideration now when you look at the fund value return of this second investor who dollar cost averaged in essentially he gets and converges to on the money that he's invested the actual percentage return that the lump sum investor got into and that is 312. 5 now it's not exactly because of course there is time in differences and inefficiencies over the long run now for both the lump sum investor and the dollar cost average investor their then adjusted annual return equates to about 5. 84 so now what happens if you weren't 25 and started investing dollar cost averaging into the market in july 1997.
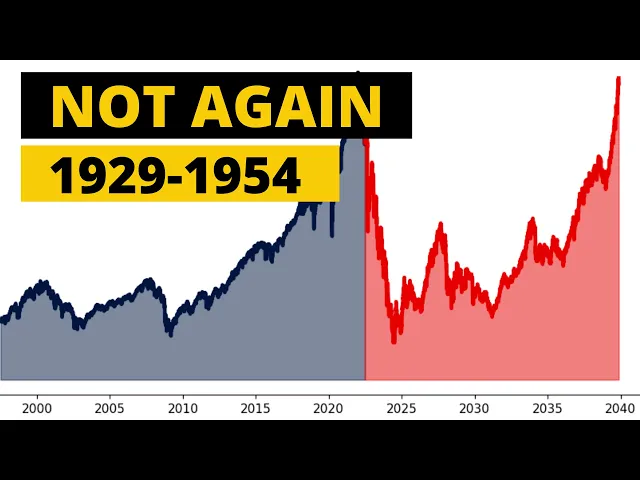
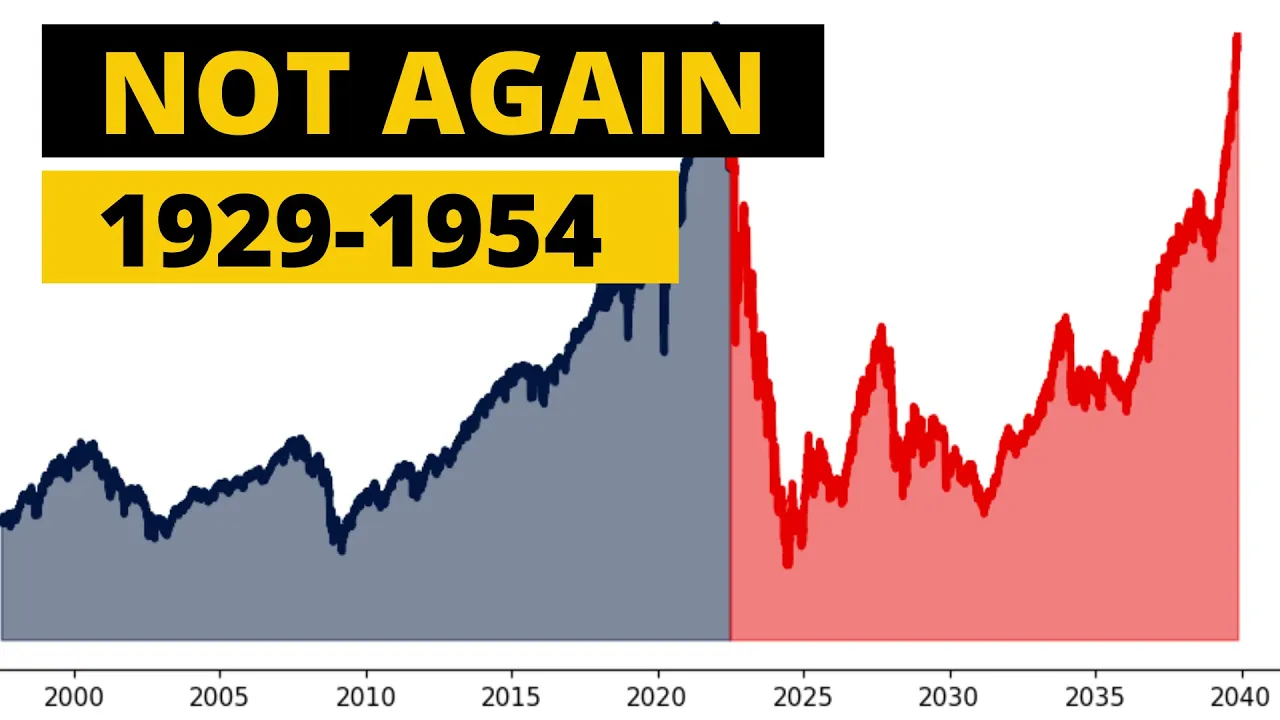
what happens if instead you were 25 in june 1997 or what happens if you were in uh 25 and you wanted to invest over the next 25 years in the january 1928. so we're going to look at all the permutations of a person who comes to the age of 25 begins working and then investing 1 000 dollar cost averaging into the market for the next 25 years we're then going to compare that to the lump sum investor who comes into 300 000 and we're going to look at the results so the number of 25-year periods that we have for a person who starts investing at a particular month from january 1928 all the way through to today would actually only be 833 and again that's with the last date that you could have invested is in july 1997 to get that 25 year holding period to today so let's now consider those 833 scenarios and look at the distributions and the returns so now going through the assumptions that we have related to creating a synthetic etf going back all the way through to 1929. the first is that we can actually buy for the closing price on a particular day which is complete bogus but it's going to do for this analysis two we have no fees and or management fees connected with this etf so no expenses now this is somewhat netted off by our next assumption which is that we do not take dividends from these investments over time and obviously etfs do incorporate the dividends that they get from the 500 companies within the etf now this is the important one the synthetic etf is holding the one tenth of the value of the index and this is in line with how the spy index and etf is created now the other assumption we're making is that we're not going to be adjusting for inflation these are going to be nominal values so now i'm going to show you the gross returns between the two strategies now the first thing that i want you to notice is that on the y-axis of both of these plots i am showing you the gross total returns as a dollar figure and i want you to notice the sheer difference between these blue bars over time from one strategy to the other i also want to make it clear that this is the 25 year holding period where uh it's recorded at the end so the investor is 50 years old and you realize your p l and that is where the bar is shown now the second thing that i really want you to notice is that there are negative returns in the lump sum investment strategy now these are occurring in january 1929 and then also when you started investing in september 1929 now these were the real high points before the great depression hit in the united states now the great depression was from 1929 through to 1933 but obviously the economy didn't really recover until after world war ii during this time period unemployment rose to 25 and the gross domestic product the gdp of the usa decreased by 30 now other than starting at these two individual points in terms of months for your lump sump investing essentially with both strategies in any other month period you would have had a positive return over your 25 year holding period now looking at the distributions let's look at the lum sump distribution and what i want you to realize is that it's highly volatile with a minimum of minus ten thousand dollar return over a 25 year period all the way up to 5.
9 million dollars but historically over time we can see that the absolute gross return of the lump sum investing strategy with 90 confidence intervals are between 470 000 to 3. 2 million now this is with a median return of 1. 4 million and a mean return of 1.
56 million now let's compare this to dca which we can obviously see never produce negative returns we have a max of 1. 99 million nearly 2 million and a minimum of 96 000 we can say with 90 confidence that over this given strategy that the dca approach is between 160 000 to up to a gross return of 1. 4 million dollars this is with a median of 560 000 and a mean of 610 000.
now let's talk about the risk essentially what happens in the worst five percent of cases i want to know what my expectation is the mean of the five percent worst cases in both scenarios so in the five percent worst cases for the lump sum essentially this would equate to a hundred and eighty thousand dollars whereas in the dca strategy these five percent uh worst case outcomes would be on average a hundred and thirty thousand dollars now this is amazing to see that even in such low probability odds of this investing strategy that over time you'll still expect in five percent worse cases to receive quite a positive return on top of your 300 000 worth of invested capital over time now lastly we're just going to compare the annualized returns for all these different scenarios now you obviously hear that everyone says hey look the s p 500 is going up at seven percent over time but that's the line and that's for the lump sump investing what about for the dollar cost averaging approach well essentially the dollar cost averaging annualized returns when considered as the fund value return approach considering when the cash flows happen and the returns are those individual investments over time when you consider those annualized returns you you eventually converge upon the lump sum distribution as you can see here and essentially we can say with 90 confidence interval that the annualized returns of both of these strategies are between 3. 85 to 10. 3 percent with a median of 7.
2 percent and a mean of 7.