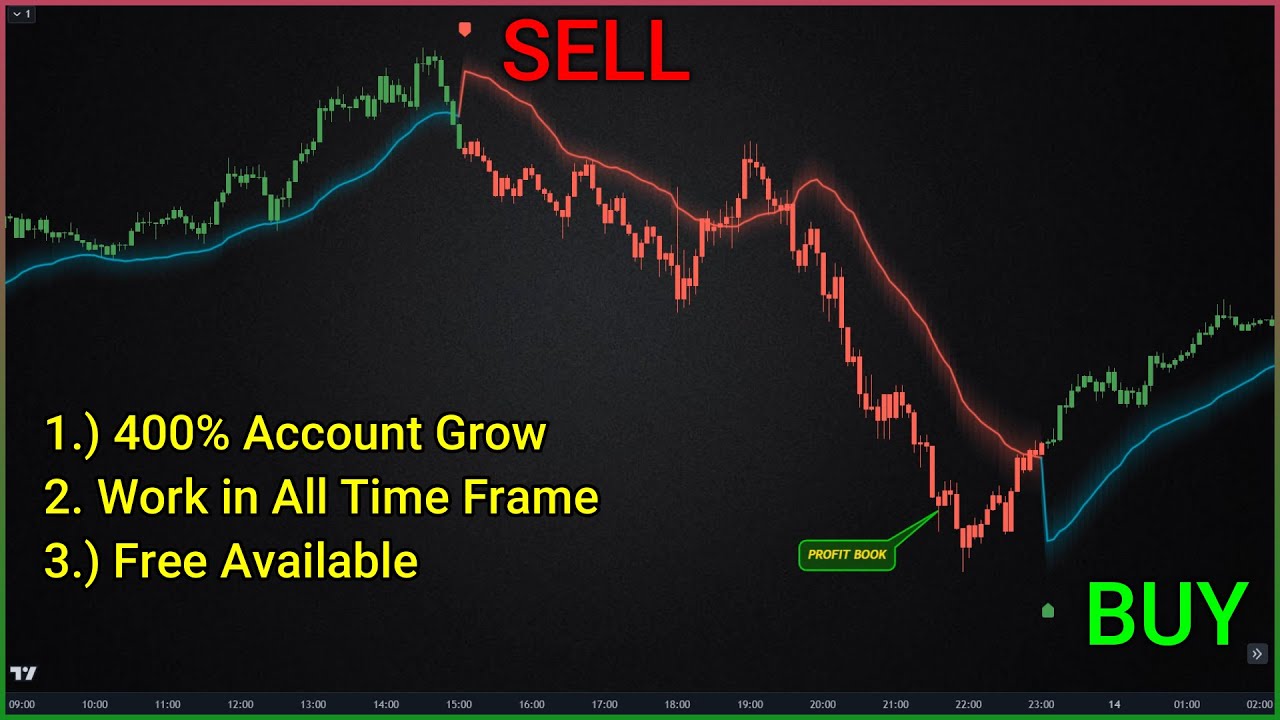
ever missed a market turning point that could have been a GameChanger frustrated with unreliable indicators today we're about to change that get ready to discover a Hidden Gem that can help you predict Trend reversals with uncanny accuracy I'm talking about the enhanced wave Trend oscillator a powerful tool designed to pinpoint Market turning points we'll dive deep into how it works share the best settings and show you how to combine it with other indicators for a winning trading strategy to truly understand this indicator we'll be using visual examples throughout the video all right let's break down
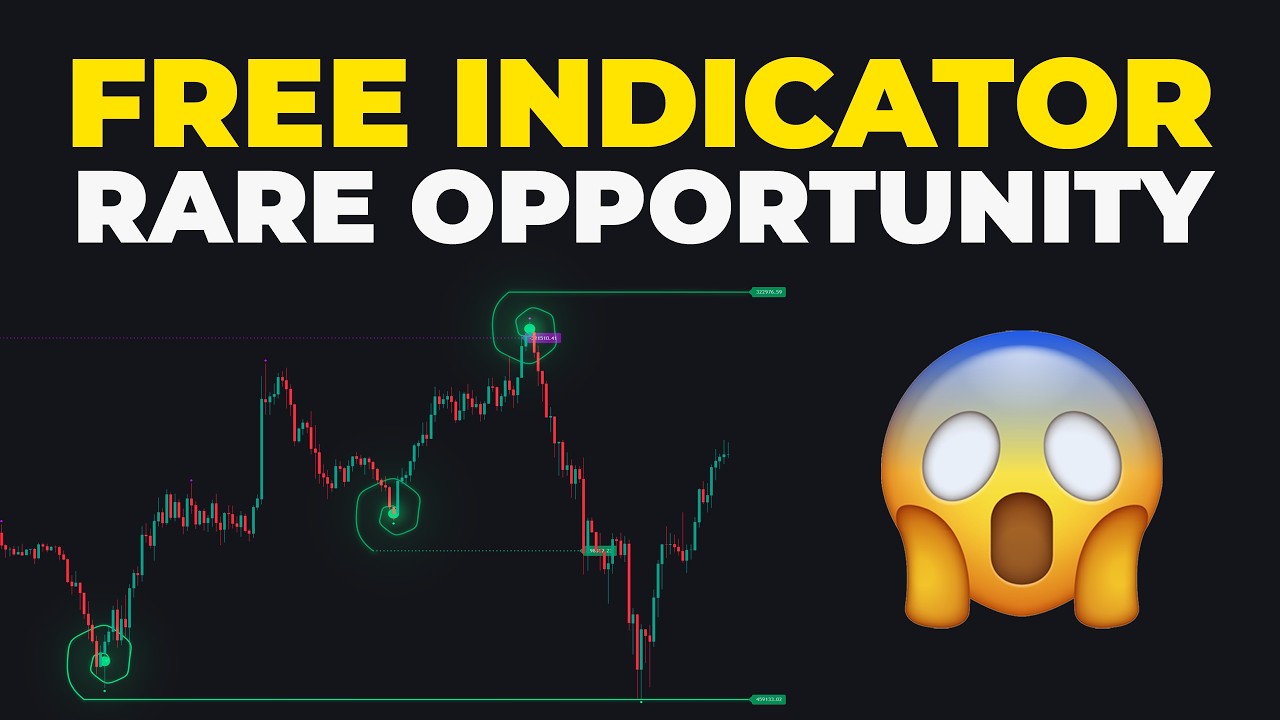
what we're looking at here first we have this colorful ribbon dancing around that's our wave Trend [Music] oscillator think of it as a mood ring for the market when it's high up the market might be feeling a bit overconfident when it's down low things could be getting a little gloomy above and below we have these lines the top one is the overbought zone and the bottom is the oversold Zone those little dots they're like exclamation points when a purple dot appears at the top It's Shouting hey things are getting overheated and when a blue dot
shows up at the bottom it's Whispering opportunity might be knocking now let's clean up this chart a bit to make it easier to read we're going to remove some clutter to focus on what truly matters all right let's get things rolling if you're ready to unlock some serious trading power let me introduce you to fast bow imagine getting all those premium charts you usually have to pay for on trading view completely free that's just the beginning want to set up 64 symbol windows in one chart no problem need to check on limited historical candles forget
the 5,000 limit on trading view fast Bull gives you full access add up to 1,000 symbols to your watch lists and load up 64 indicators on a single chart for a true Deep dive but wait there's more fast bull even has a trading contest with a massive $22,500 prize pool first place takes home $10,000 and the best part it's completely free to enter you'll also get real-time quotes and an economic calendar so you'll always know when Market shaking news is about to hit fast bull has got your back don't miss out check out the link
in the description to get started all right now that you're all set up let's dive into the strategy so you might be wondering how do I turn these squiggles and dots into C hard cache well it's simpler than you think when our wave Trend oscillator dives into the Blue Zone and pops up a blue dot it's like the market is yawning and stretching this could be a sign it's about to wake up and start climbing that's your cue to consider buying in on the flip side when the oscillator Rockets into the purple Zone and drops
a purple dot it's like the markets had too much caffeine it might be ready for a nap and prices could be about to take a snooze this is where you might want to think about selling or shorting but hold your horses using just one indicator is like driving with one eye open we need another tool to confirm these signals and boost our chances of success all right let's add another tool to our Arsenal meet the brakes and retests [Music] indicator on the input tab you want to change the ma1 length to 100 then change the
ma1 color to white after that head over to the style tab and disable ma2 as well as the volatility stop after that click okay think of it as a superhero that spots hidden treasure or in this case potential profit zones this indicator draws lines across the chart pointing out where the market might be taking a breather before making its next big move these lines are like signposts telling us where support and resistance levels might be lurking we're going to simplify this indicator a bit to focus on what really matters we'll keep the support and resistance
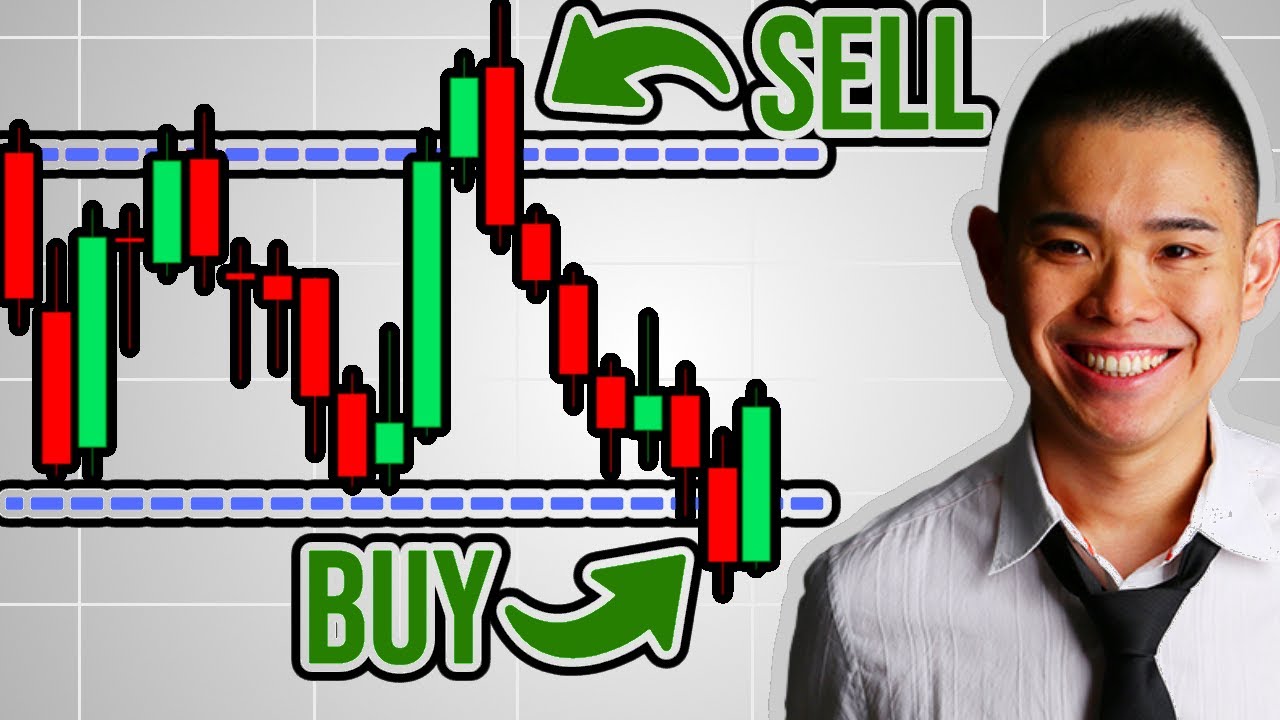
lines and add a moving average to help a spot trends when the price is above the moving average it's like a green flag signaling a potential uptrend when it's below it's more like a yellow caution flag suggesting a possible downtrend to find our sweet spot we look for places where the price breaks through one of those support or resistance lines and then comes back to test it again if the price bounces off the retest and keeps moving in the same direction as the trend that's our cue to potentially enter a trade now let's put our
puzzle pieces together we're looking for a perfect storm of conditions to to place our bets first we want to see our wave Trend oscillator diving into the Blue Zone and flashing that blue dot this tells us the market might be feeling a bit tired and ready for a rebound next we need our brakes and retests indicator to point out a strong support level this is like finding a sturdy Rock to step on before making a leap once we spot that support level we patiently wait for the price to break through it like a determin Explorer
but we're not jumping in just yet we need to see if the market hesitates for a moment like taking a breath before diving into a pool that's our retest finally we check if the price is swimming upstream or in this case trading above the moving average this confirms we're in a bullish environment when all these stars align we place our bed and buy to protect our gains we set a stop loss just below the recent low point and for our Target profit we aim for a reward that's one and a half times the risk we
took as you can see this setup helped us capture a nice profit but remember trading isn't always a walk in the park there will be ups and downs that's why it's crucial to manage your risk and be patient let's see this setup in action again here the wave Trend oscillator is signaling an oversold market and we've got a nearby resistance level ready to be challenged the price breaks through and then pulls back for a retest perfect with the price trading above the moving average we confirm the uptrend and enter a long position as you can
see this trade was a winner now let's try a short position the wave Trend also Ator is in overbought territory and we have a support level waiting to be tested the price breaks down retests the level and confirms the downtrend with its position below the moving average another successful trade remember this strategy is a tool not a guarantee always do your own research and consider risk management if you found this video helpful give it a thumbs up and subscribe for more trading insights let me know in the comments if you have any questions or want
to share your results happy Trading