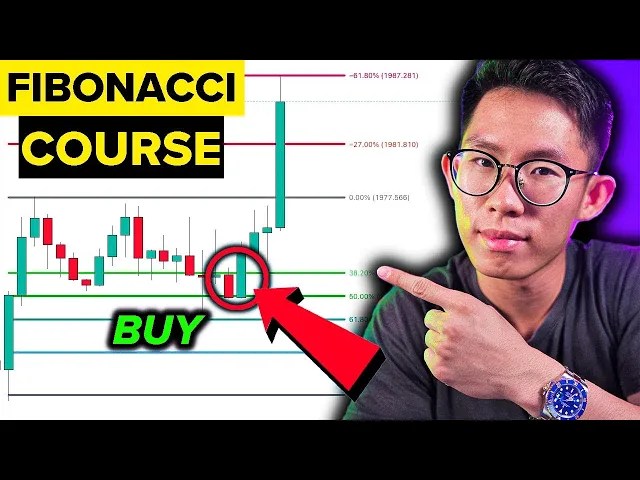
So, in the previous video I did about Fibonacci, I told you guys how to use Fibonacci and how to apply it, and all like the freaking beginner stuff, right? So, in this video, we're gonna dive deep into how I use the Fibonacci to trade—how I personally use the Fibonacci retracement to trade—so that you can learn from me and you can implement it into your own trading journey, right? And I always want to say that, yo, Fibonacci retracement—this is okay.
That is such a mouthful. Fibonacci! I'm just going to call it Fibonacci.
So, for Fibonacci, that is the most important tool that I use. Like, I freaking love it, man. That is so powerful.
It's literally so powerful! I use it every single time that I trade, and it has never once failed me. Maybe it failed me like two to three times, but it really works, guys.
I'm gonna show you right now. So, most of you guys think that Fibonacci is very complicated to use, but it's really, really very simple. A lot of YouTubers just like the complicated things, right?
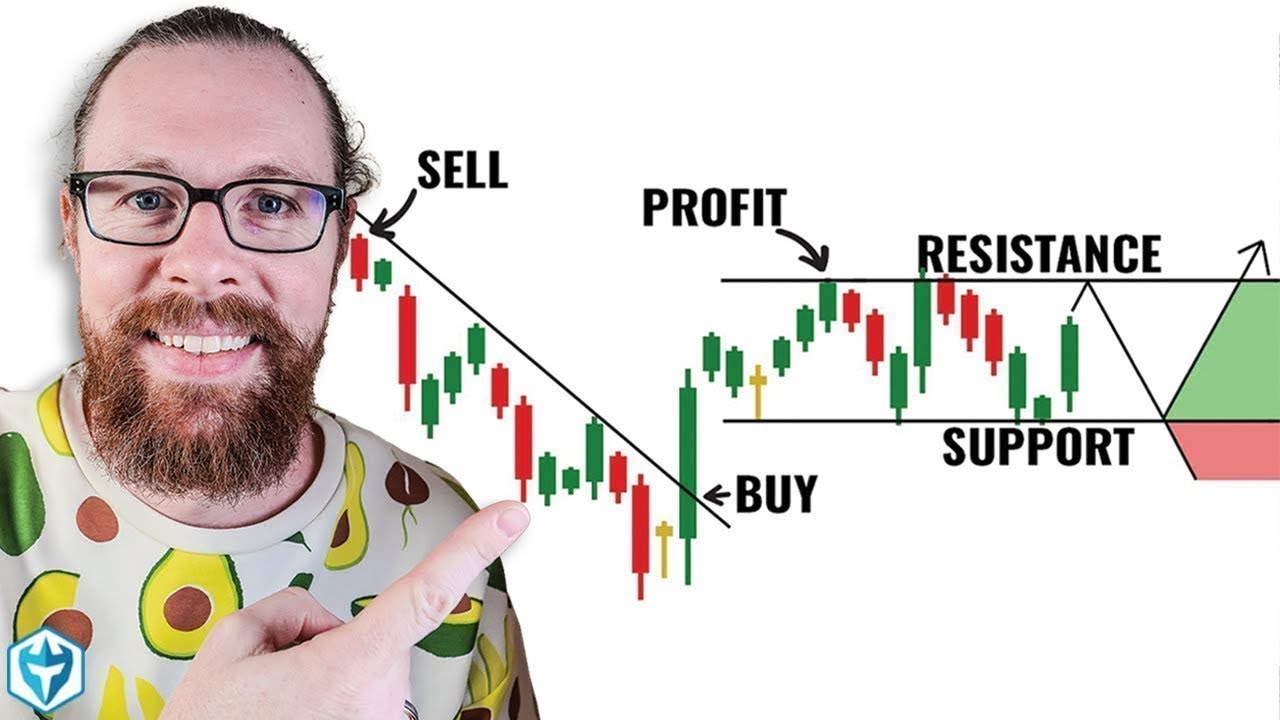
But we like to keep things as simple as possible on this channel. So, when you want to pull out your Fibonacci is when price retraces. So, whenever you start seeing price retrace, pull out your Fibonacci retracement.
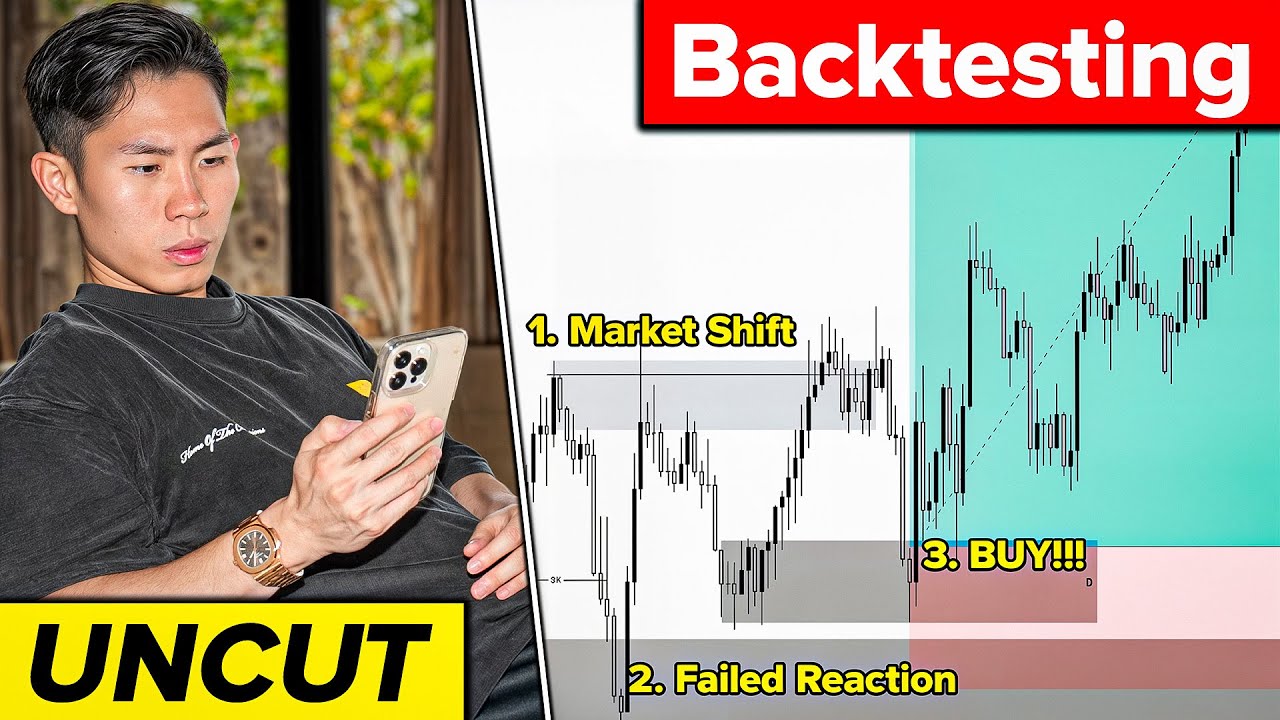
Here's what I mean: You see price going up, right? And price is already way up here, so you do not want to get in right here, because if you get in right here, your stop-loss must be all the way down here. So, you want to wait for price to retrace first, right?
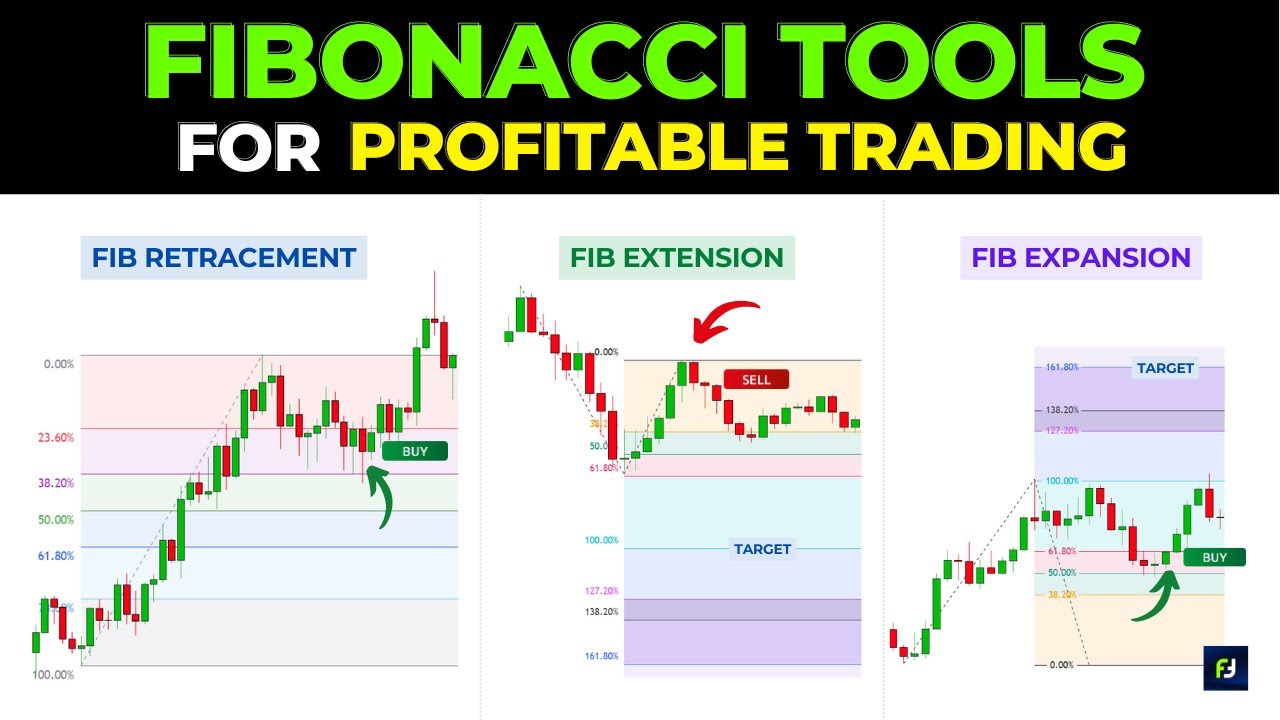
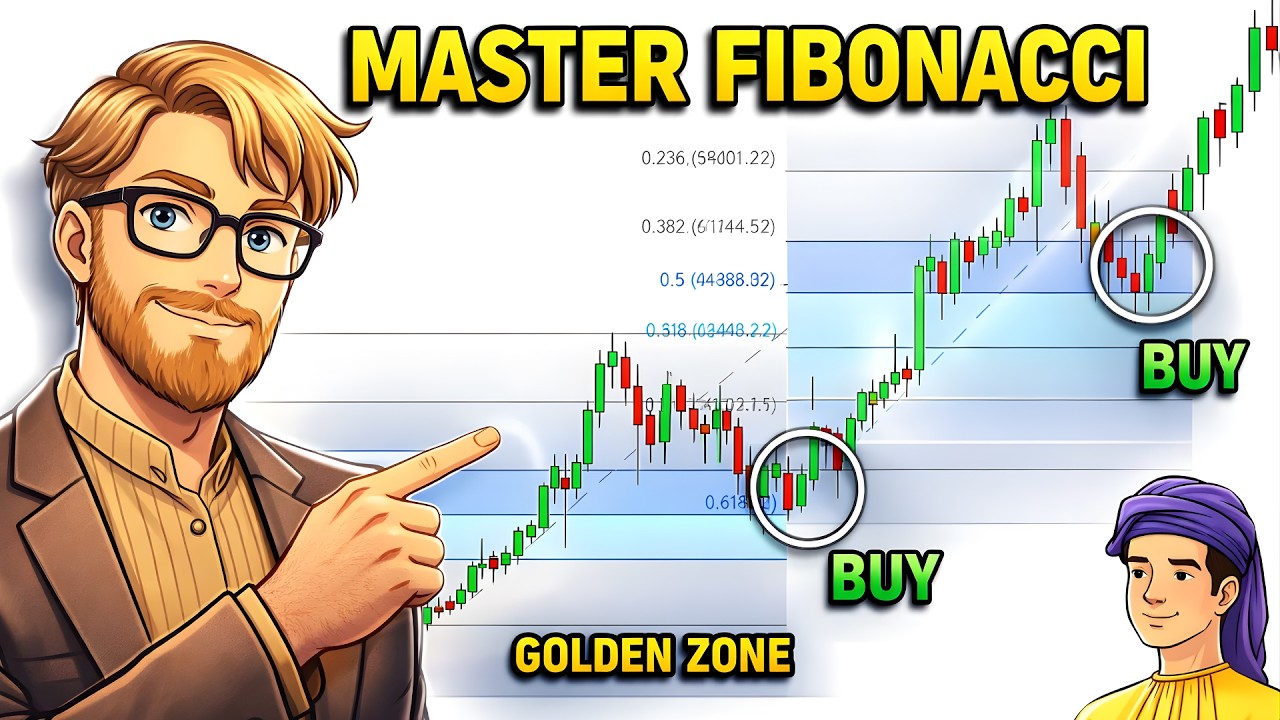
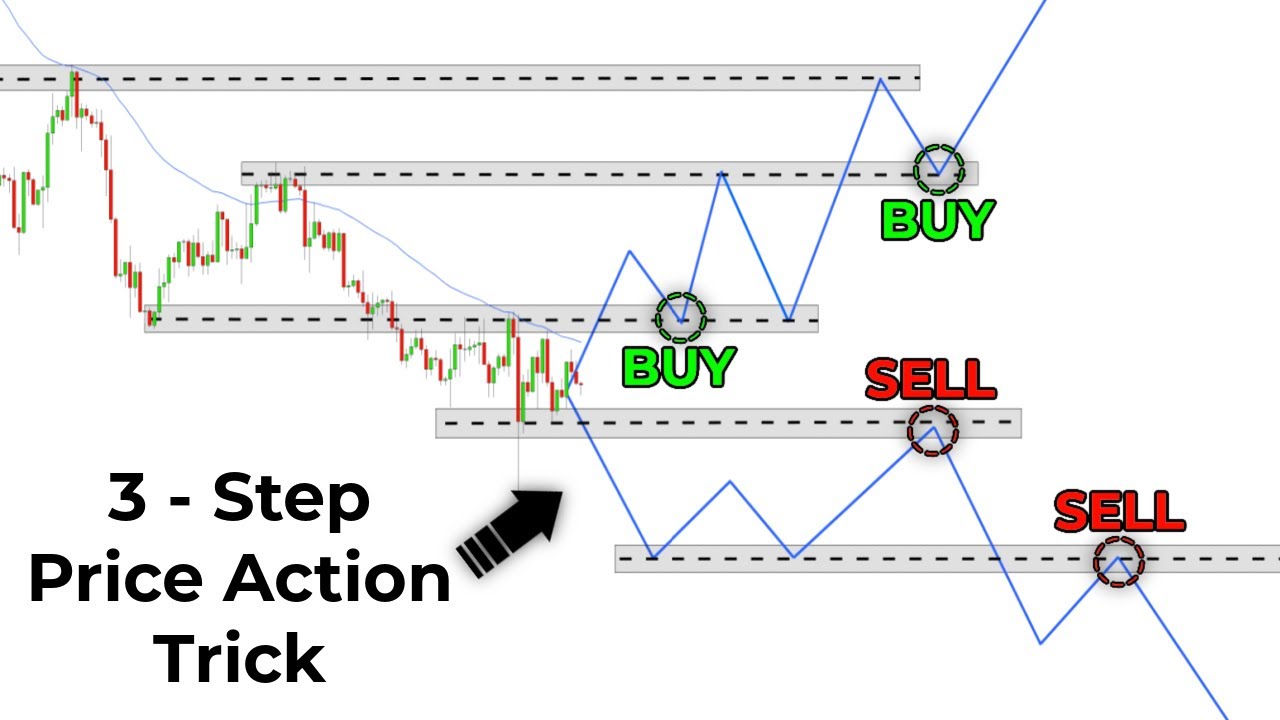
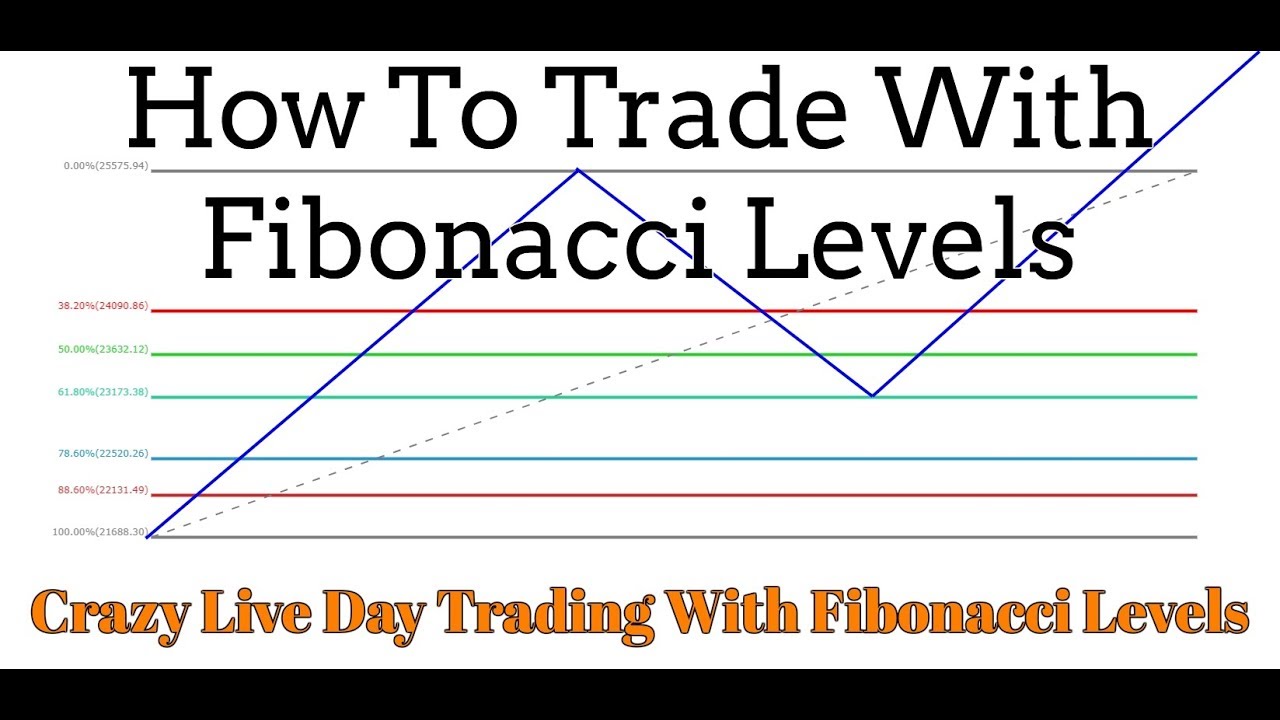
When price starts retracing, the first thing you want to do is take out your Fibonacci retracement tool, this one right here, and drag it from the lowest point before this major push phase. So, basically, you're going to drag it from the swing low all the way up to the swing high right here, because this is the highest point before price starts retracing, doing this retracement. So, now you have brought out your Fibonacci retracement tool.
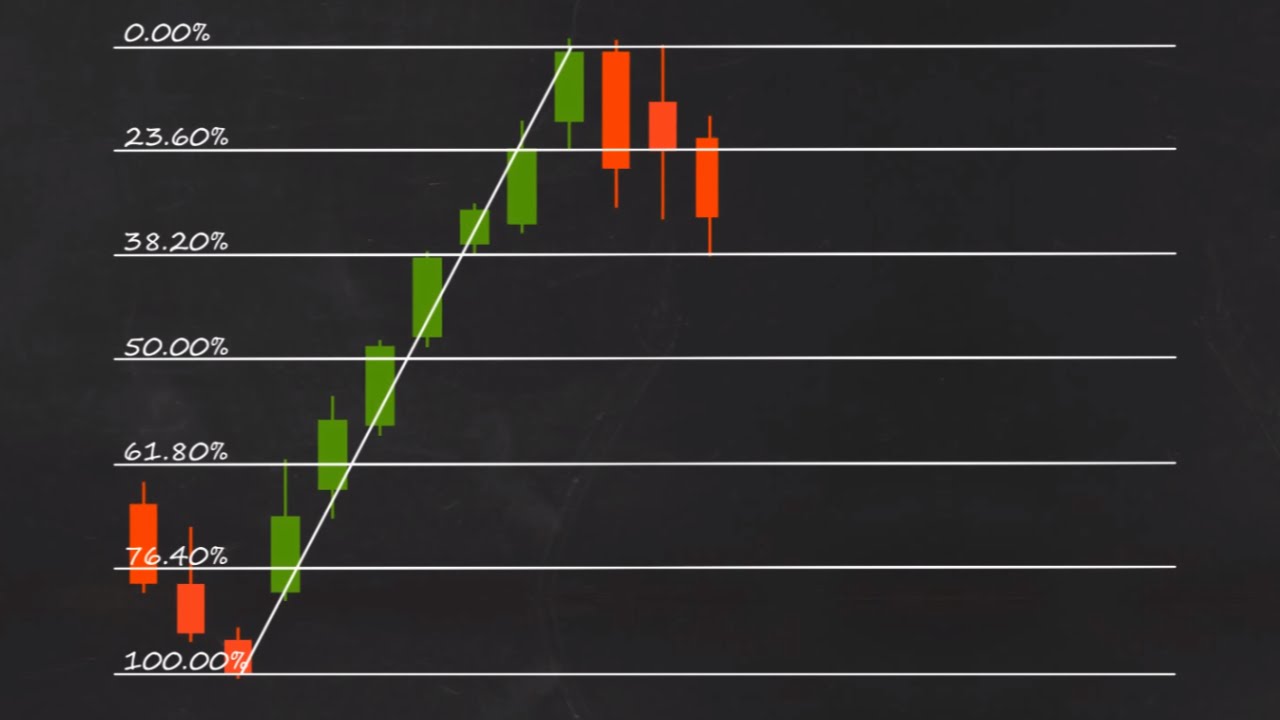
We are expecting price to retrace to either one of these levels: the 38. 2, 50, 61. 8, or 78.
6. Either one of these retracement levels. What I mean by that is that price can literally retrace to either this one, this one, this one, or this one.
Either one, and it's still counted as a retracement. However, if price breaks through this 78. 6 level and just goes back down like this, guess what?
It is not a retracement; it's a reversal. That means price is reversing, and it's gonna hit back down. So, in this case, let's just say that price retraced to the 50 extension level, which is this one right here, the 50 extension level.
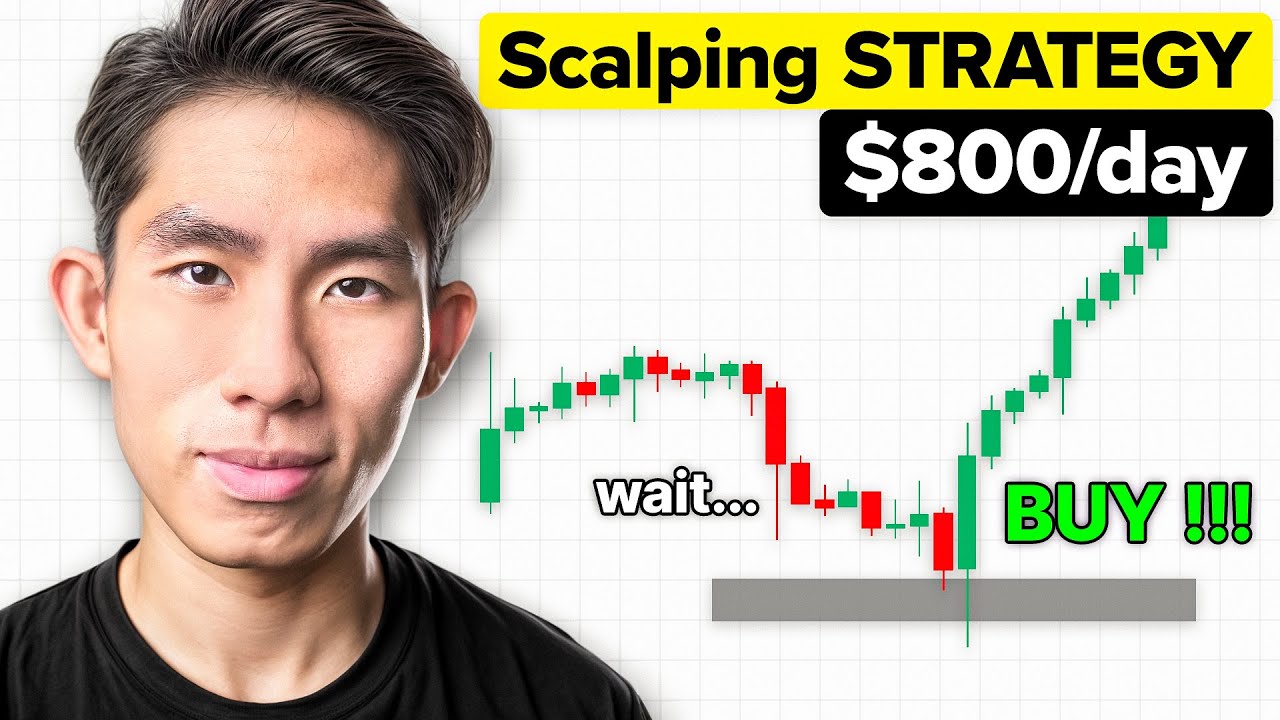
So now, you do not want to enter here yet. You want to wait for some sort of signs that show you that price is done retracing and is going to continue heading back up. So right now, once we see some signs, we enter for a buy.
So next, you did this next phase, and the candle is going up, and now price is going to go to the extension levels, which is either the negative 27 or the negative 61. 8 level. So right now, let's say price went up to this negative 27 level.
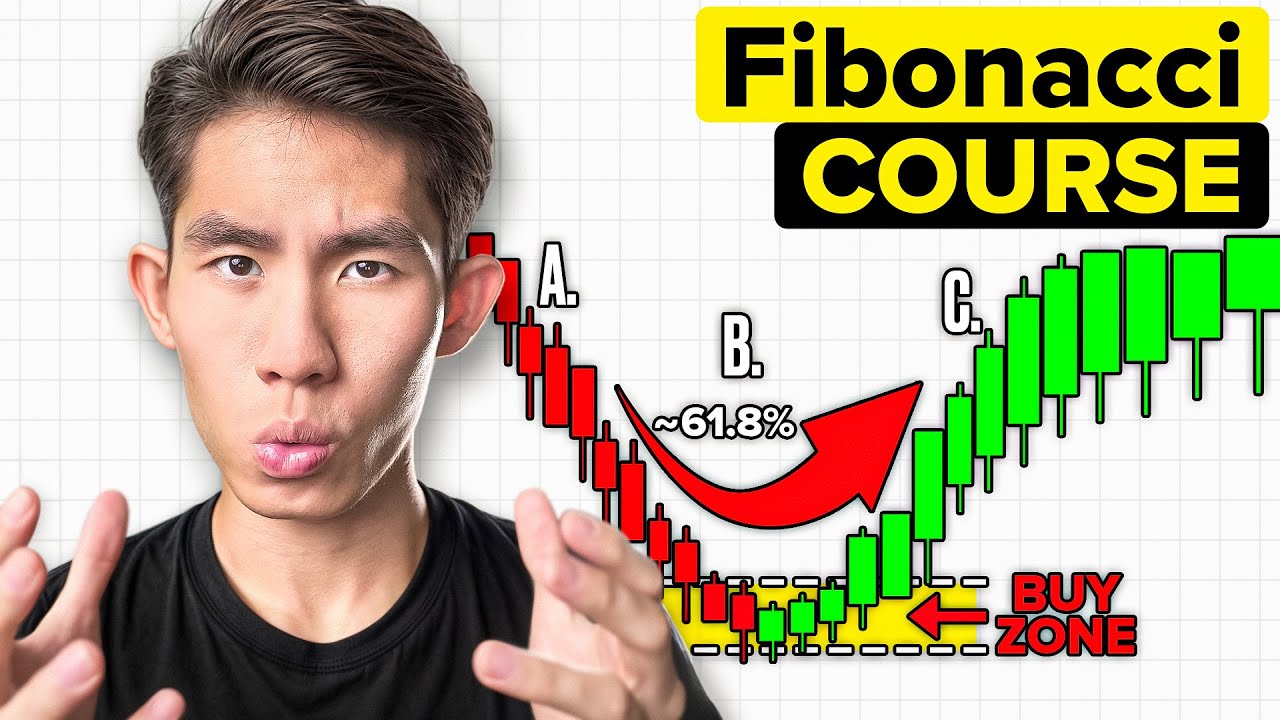
So, in this case, if you enter for a buy right here, your take profit will be at the extension level right here. It's really as simple as that, guys. So, this is what I like to call the A B C D—the A B C D pattern, guys.
As simple as that. So, like I said, a lot of YouTubers like to complicate this thing into some magical mystery thing that nobody knows how to use, but it's really, really just as simple as that. I hope that you can really get a sense of this so that you can incorporate it into your own trading journey or style or strategy.
Now, the most common question I get is, "How do you know that price is done retracing? " Right? Because price can easily go down even further right before it starts retracing.
Don't worry; I'm here to show you a few examples, so that by the end of this video, you'll be able to master Fibonacci retracement and use it to get high win-rate trade opportunities. Right now, let's say that price did this beautiful up move and then you cannot enter right here, right? So, what you want to do is wait for price to retrace.
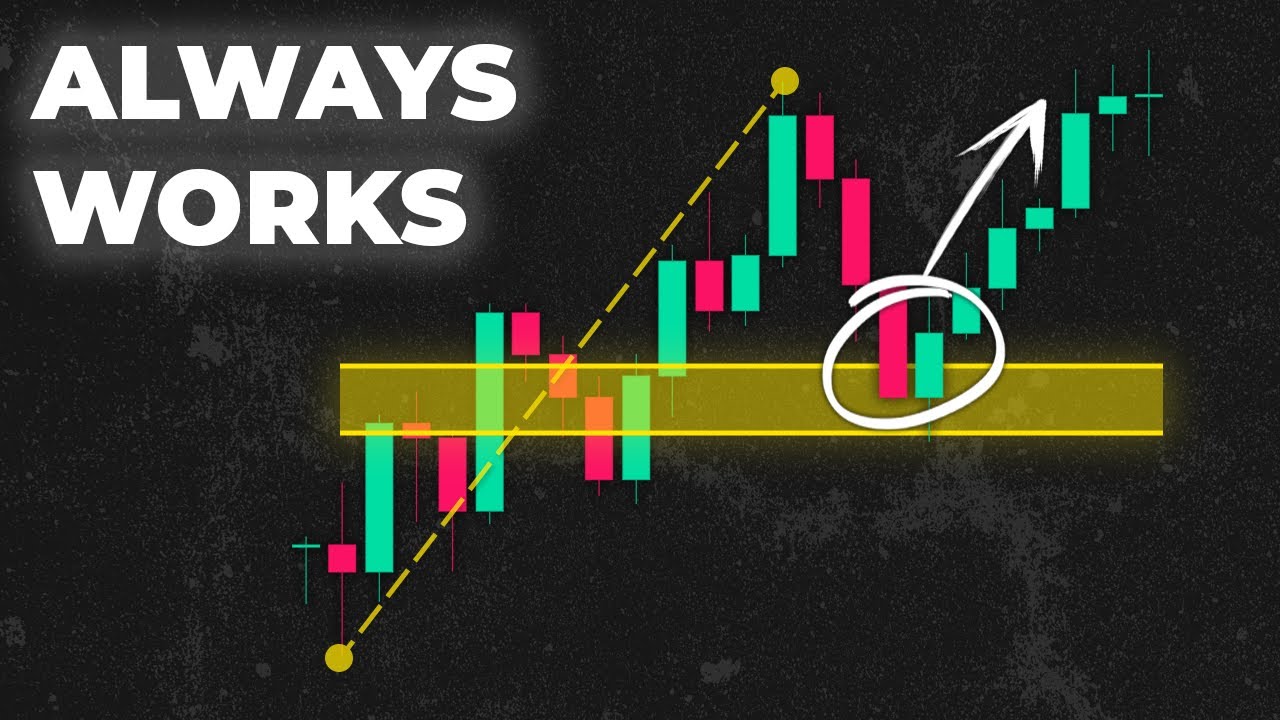
So, the moment you start seeing price retracing, like you can see all these black candles in a row, that is when you pull out your Fibonacci. Take a Fibonacci, blow it from the swing low, which is right here—this is the lowest point—up to the highest point before price starts retracing, which is right here—this is the highest point. So now we got the A, we've got the B, and now we want to wait for price to form C, which is the retracement.
So, price retraces all the way down to the 50 extension level right here, this area right here, right? So this is your 50 extension level; you can see right here. So now that price retraced all the way down to this 50 extension level, we have your A, we have your B, and we also have your C right here.
So, at this area here, this is when you know that price is consolidating around this area, so we want to wait for price to show us some sort of signs that tell us that price is done retracing and is about to hit back up. So now. .
. It consolidates a little bit right here, and then we start seeing a bullish engulfing candlestick right here, and then it shows us a lot of bullish momentum. That's one sign.
Right, another sign was that around this area here, price did what? So many long weeks: one, two, three, four, five! Five long weeks.
So, that means that price could have gotten pushed all the way down here, but then the buyers always come back in to push the price all the way up. So, one, two, three, four, five long sticks! Five times it failed to break past this level.
This shows us that this is a very, very strong support area, and it's also our retracement level. At this area here, you see like price failed to break past this level multiple times: one, two, three, four, five! Five long weeks, and it also gave us this bullish engulfing candlestick.
This is when you can easily enter for a buy position. So, if you enter for a buy here, guess what? Your take profit will all the way be at the negative 27 extension level, right?
This is the D, which is D, right? So now this is the next push. Price went all the way up to the negative 27 extension level, which forms your D, A, B, C, D.
As simple as that, guys! Yep! So right now, if you have got out of the trade and you have taken profit for this trade, what I want you to do is to clear away this Fibonacci.
Clear away the Fibonacci, and you can see you can draw another Fibonacci. So, if you zoom in right here, you can actually draw like a mini Fibonacci from here, right, all the way up here, because this entire big candlestick, if you go down to, like, let's say the one-hour time frame, you'll see that it's actually like a really, really massive candlestick right here, right? It's a freaking massive candlestick right here.
So, you could not enter right here because if you enter right here, your stop loss must be all the way down here, guys. And that is not worth it! You want to wait for price to start retracing, right?
Retrace from your new higher low. Then that is when you can enter for the next push phase. So, in this case, what I want to do is to drop my Fibonacci.
So, what I will do is to take out Fibonacci, drag it from the swing low all the way up to the swing high. So, because it's the highest point right here, this is the lowest point. Drg it all the way up to the swing high, or you can even put it right here at this wick right here.
This is a swing high right here. So right now we've got your A, we've got your B. So now we have to wait for price to retrace to either one of these levels.
And in this case, price retraced to the 50 extension level once again, right here—50 extension level. And look at this, it's showing us the exact same thing: one long candle, two long wick candles, second, third—oh, wait, my math! Okay, one, two, three, four, five, six, seven!
Seven long wick candles! That means that price failed to break past this level seven times, guys! Seven times!
Three of the break pass—that is when you know that this is a strong retracement level, and price is about to peel back up, like skyrocket back up. So you have entered for a buy right here when you see that price rejected this level seven times, and you also see some sort of upwards momentum, right? You can see green candle, green candle.
Okay, the reason why it's yellow here is because my charts are yellow and black. Alright, I will switch it up later. But basically yellow candle, yellow candle, and you see there's a lot of upward momentum, right?
That is when you can enter for a buy, because you know that price is not going to easily break past this area and reverse and head back down anymore, because this shows us that there is bullish momentum. So you can enter for a buy here and you place your take profit all the way up at the negative 27 extension level, and you can see price went up and smashed our take profit. I'm never kidding, guys!
Look at this! Price went all the way there, right here, smashed our take profit! That's what it will look like in the downtrend.
So in the downtrend, prices did this beautiful down move, right? And you cannot enter right here because if you enter right here, your stop loss must be all the way up here. So what you want to do is to wait for price to retrace first.
So the moment you start seeing price retracing like this, right, pull out your Fibonacci, guys! So I'll drag it from the swing high all the way down to the swing low right here. So you plot your Fibonacci retracement to plot it out.
And you can see that in this case, price went up and retraced all the way up to the 61. 8 level. It's no longer the 50 level, guys!
It went up to retrace to the 61. 8 level! So now price went back up to retrace to the 61.
8 level, and you want to wait for price to show you some sort of signs that price is done retracing and is going to continue heading back down. So, at this point, you can see price formed a double top. One double top, so double tops look something like this, and this shows us that price is reversing and is gonna collapse and head back down.
Price showed us a double top, which shows us that there is a. . .
A lot of bearish momentum in this market, and price is going to continue heading back down. So, the moment we see that double top forming at this 61. 8 level—61.
11 right here, guys—and guess what? That is when you know that price is done retracing, and price is going to continue heading back down. So, if you have entered a sell somewhere right around here when a double top has formed, then this is when you take profit at the negative 27 extension level right here.
You can enter for a sell somewhere right around here and then place your take profit all the way down at this negative 27 extension, with the stop loss above this 61. 8 level because this is the last lower high. You can see this was just a beautiful trade; price went down and smashed your take profit, and this was like a very nice one.
It's a three-to-one risk-to-reward ratio trade. Yup! The Fibonacci retracement is really, really an insane magical tool which I really, really love, because if you can know how to use it—if you understand how to use it—it's going to help in your trading so much.
This tool is just like. . .
it will just change the way that you trade forever. So go ahead and practice and backtest this strategy on your charts, and let me know how it goes. Welcome to the unfiltered section!
If you are still watching this, that means you are really, really serious about becoming a trader, and I am so proud of you. In this unfiltered episode, I'm going to talk about your mindset. “Oh, I'm not good at trading.
” Oh, hi! Hello! You're a—you're a bro!
Like, what are you all about? They shut up; I'm trying to concentrate. Yeah, so I see a lot of you guys in the comment section it's like, “Oh, I'm a bad trader.
Oh, I lose this amount of money. ” So what? So what, man?
Like, I've blown multiple accounts; I've lost so much money, and I still don't think I'm a bad trader. Maybe I did think that I was, like, at the start of this trading journey, but then I realized that that should not be the mindset that you need to have, right? So honestly, like, nobody is born a good trader, and that's just the truth.
Nobody is born a good trader. You think that when I just hop out of my mom's womb, I just decided that I want to be a freaking trader? Of course not!
Right? So you see so many YouTube videos telling you that, “Oh, I made fifty thousand dollars from trading Forex,” but what they don't tell you is how much they lose. Like, all of the great traders—all of them are profitable traders that I know—lose a ton of money before they actually become profitable.
So chances are, you are in that phase. You’re in that phase where you are losing money, you're not seeing any results, and you just feel like you're the worst trader in the world. And trust me when I say that that is so normal, bro.
Like, I felt the exact same thing when I first started out. I felt the exact same thing. So chances are, whatever feelings you are feeling right now, I felt the exact same thing.
So when you first start to learn to do something, you are always going to be bad at it; that's just the truth. In my first year, I was bad at trading. Just think about it, guys.
Remember the first time you learned how to ride a bicycle? For me, I was constantly falling off the bicycle, and I just found it so hard to find my balance. But eventually, after practicing and as time passed, riding a bicycle actually becomes like muscle memory.
Now I can just ride a bicycle blindfolded, although I would prefer not to. But it's the same thing with trading. When I first learned how to trade and analyze the chart, do all the technical analysis, and draw trendlines, support, and resistance—all that, right?
—I was like, “Hmm, am I drawing this trendline correctly? ” I would literally spend hours analyzing these charts—any charts. But now, I can literally finish analyzing a chart and decide whether I want to buy or sell within five minutes.
I've proven it to you in, like, I think the previous video I talked about how fast I can trade. It's somewhere on my channel; you can just go search it: “Revealing How I Trade Like a Pro”—that was like the title or something—and I literally analyzed a chart in five minutes. That's the same chart that I used to take one hour to analyze.
Trading actually becomes like muscle memory now. Technical analysis actually feels like muscle memory now, and it hasn’t always been like this. I was bad once too!
Yup, so there are basically two types of mindsets, right? A growth mindset and a fixed mindset. A fixed mindset means that you believe intelligence is fixed.
So if you are not good at something, you think that, “Oh, I will never be good at it. ” “Oh, I'm not good at trading; I’ll never be good at trading. I’ll never be like that freaking trader on Instagram.
” No way! Well, the growth mindset means that you believe your skills can be developed over time. That means that you can believe that you can become a better trader; you can progress as a trader.
And as you become a better trader, guess what? The money just. .
. Come along as a byproduct, and if you want to succeed in life or in trading in the markets in general, you must have a growth mindset. Choose the growth mindset.
To be honest, people with a growth mindset tend to achieve so much more. They believe that they can improve; they know that success takes a lot of hard work. There is no overnight success, right?
Overnight success usually requires years and years of hard work, so they are willing to work for it. That's why, if you want to be successful in trading, you need to start by changing your mindset. You need to stop having the loser mindset of, "Oh, I lost a few trades in a row, and now I'm like the worst trader in the world.
" Hell no! Hell no! It's not about getting rich quick; it's about holding a skill, and that takes time and dedication.
Period. That takes a lot of time, a lot of mastery to master a single skill, right? It doesn't matter if you are working at any job or, let's say, you are a painter who likes to paint stuff.
It took years for Picasso to become, like, I don't know, the best painter in the world. It took years, right? That wasn't overnight.
You know what I'm saying—just because you lost a few trades in a row does not mean that you are the worst trader. It just means that you are a beginner, and there are a lot more lessons to be learned. I remember reading this book called "Outliers" by Malcolm Gladwell, and he mentions the 10,000-hour rule.
The rule basically says that it takes up to 10,000 hours of practice to achieve success in any field. That means that if you are trading, it's going to take you 10,000 hours to actually start achieving success. Chances are, if you're watching this, you have not reached 10,000 hours of practice.
You are not even close to reaching 10,000 hours; you are probably at, like, 1,000 hours. Bro, what I’m saying is skills take time to master; it takes time, right? Remember that exponential curve I showed you in the last episode?
You are right here. Once you reach right here, this is when your income is going to explode; your success is going to explode. Man, you do not need to be the best trader in the world to make money, right?
You just need to be disciplined enough to start making consistent profits. My final advice for you would be to be smarter than the gamblers. Do the work, trust the process, and learn from others who do the work, like me, and you will achieve success.
Right? Just start by watching all my videos, watch till the end, implement my advice, backtest the strategy, practice it on your demo account or trade your live account—whatever. Once you start making fewer and fewer mistakes and become more and more disciplined, that is when you actually become a better trader, and when you actually become a better trader, money will come as a result.
And for most of you wondering, "What is this? " That is a freaking slide, all right? I did not get punched in the face.
You know what I'm saying? If you found this video helpful, make sure you like this video and comment down below what you guys think of this episode. Hit that subscribe button and the notification bell beside it, and welcome to the tribe.
Remember, you're just one trade away.