Hi! Welcome to this module on the waste generation and characterization. This is the outline of the module on the things I would like to share with you.
First of all we'll discuss why do we need this data and what do we do with it? Then we'll look at a waste generation in different countries across the globe. Then we'll also look at key properties of waste, especially composition, then we'll look at moisture, density and also calorific value.
Finally we'll conclude by thinking about how can we measure these parameters and what are the important things to consider. So first, we need to ask the question: what do we want to know about waste and why? You might remember this graph from previous modules.
That shows the different physical elements of the waste management stream. Now, if our question is: what measures do we want to introduce for waste prevention and reduction? It is, of course, important to know what's is generated in the household, and what can be achieved with such measures.
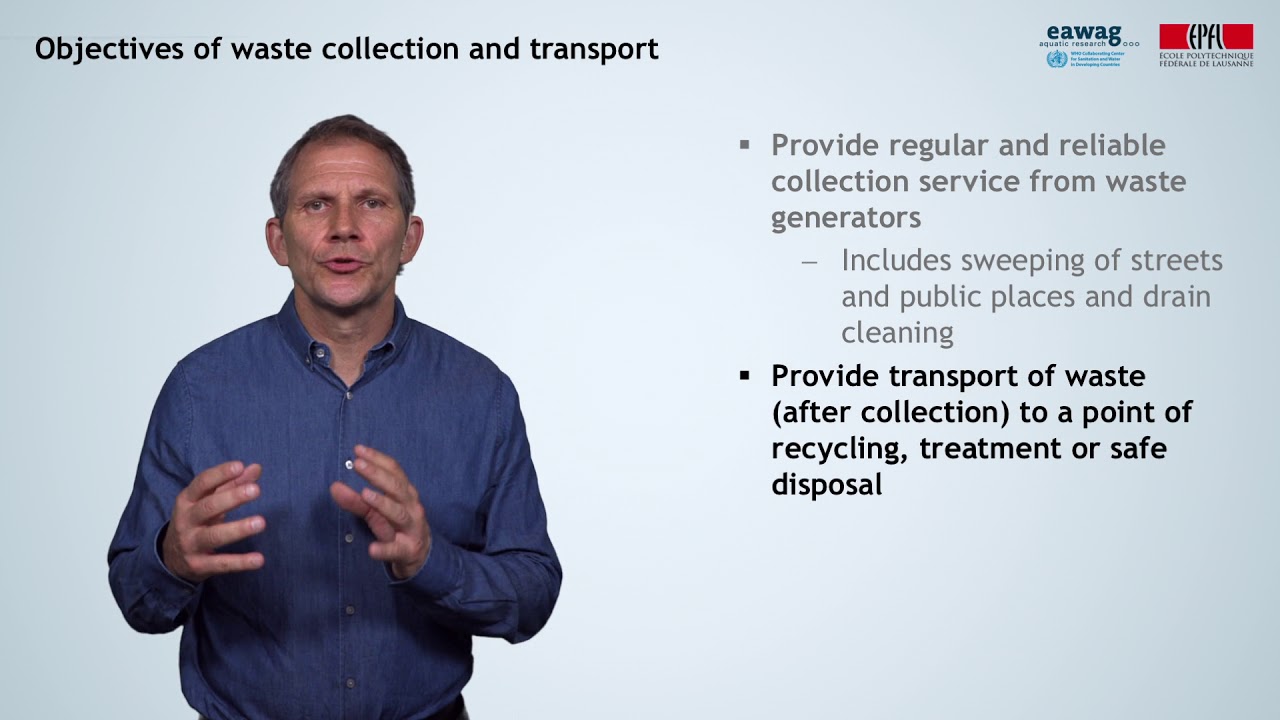
If it's important to know what the capacity and the number of collection vehicles that are necessary, then it's also important to know what waste is generated in the household which needs to be removed and collected by vehicles. However, we want to assess feasibility, and the scale of a treatment option. Then it's rather important to know what's entering the treatment station at this point in the waste management stream, and what needs to be processed.
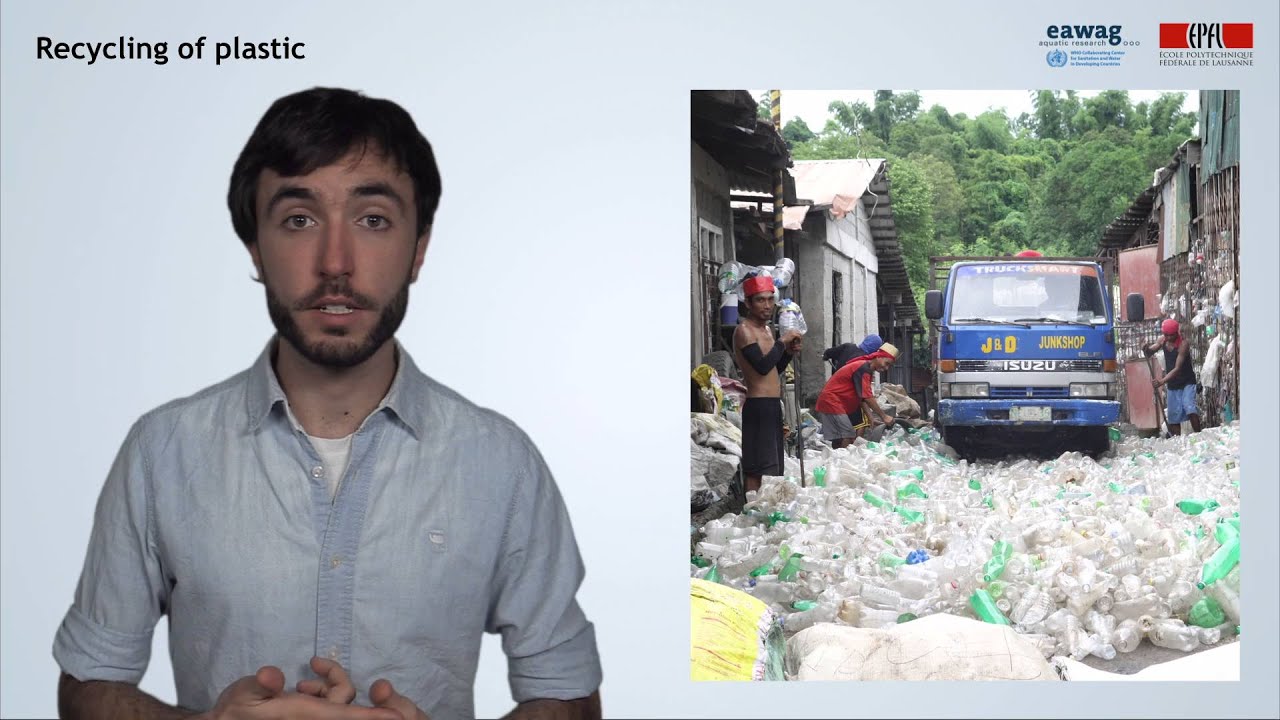
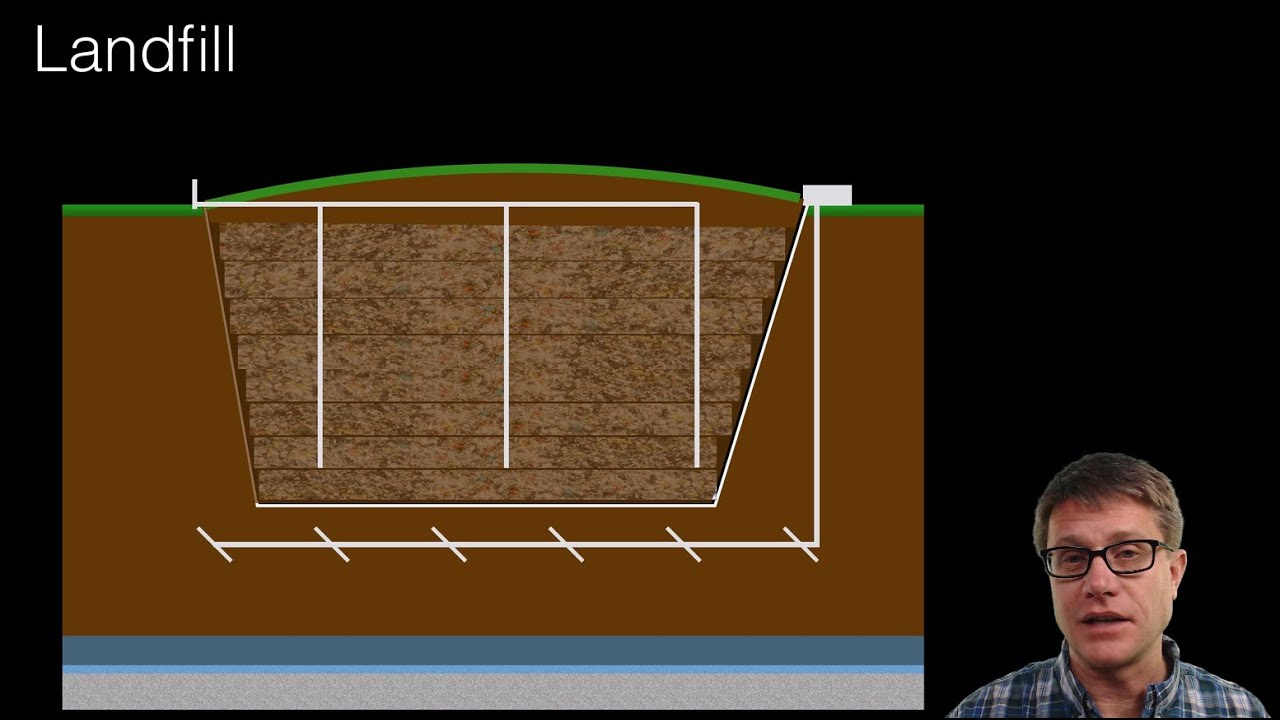
If our interest is in identifying recycling opportunities, then of course we need to know the composition and the value of the waste generated. Finally, if we want to estimate the life span of the landfill, then it's important to measure waste amounts that are reaching the landfill. On waste generation, let's look at this graph from the global waste management outlook.
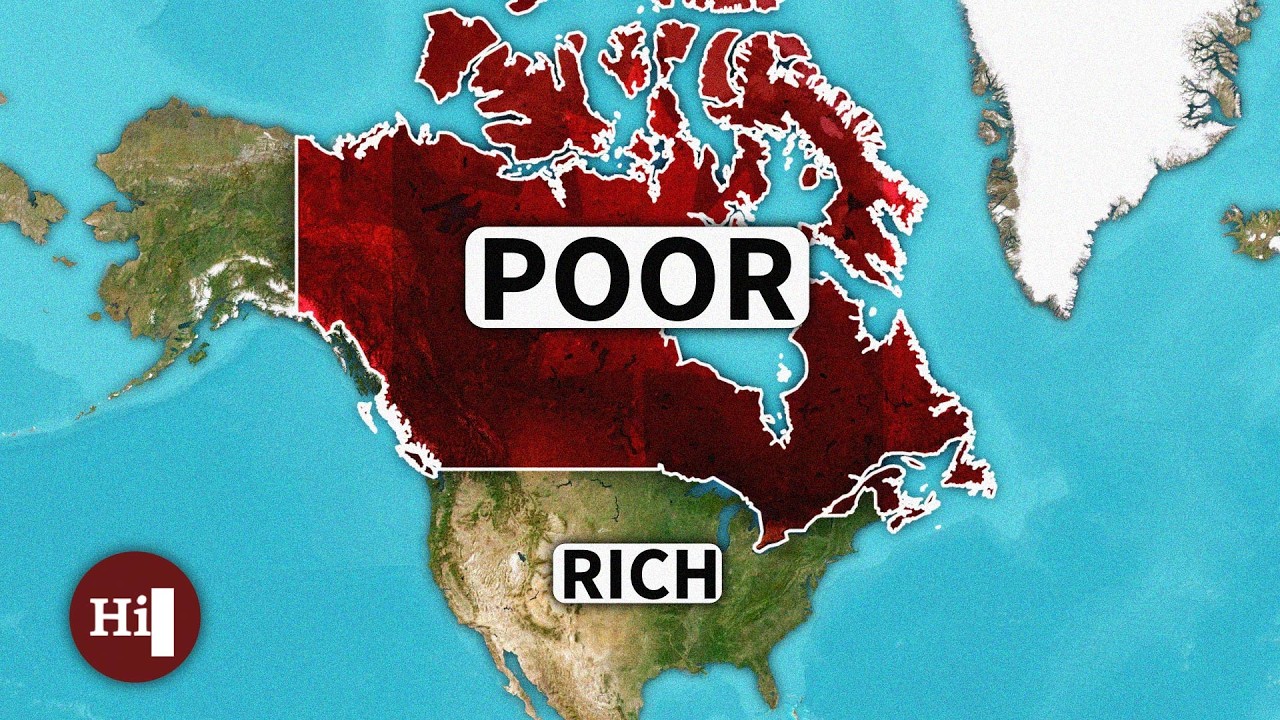
What we see here is waste generation per capita, per year, and on the x axis we see gross national income per capita. What is clearly visible is that, with increasing income, we have increasing waste generation rates. Poor countries generate less waste, rich countries generate more waste.
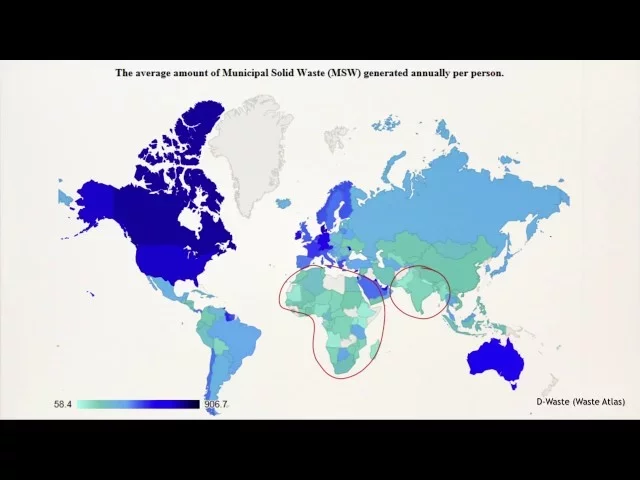
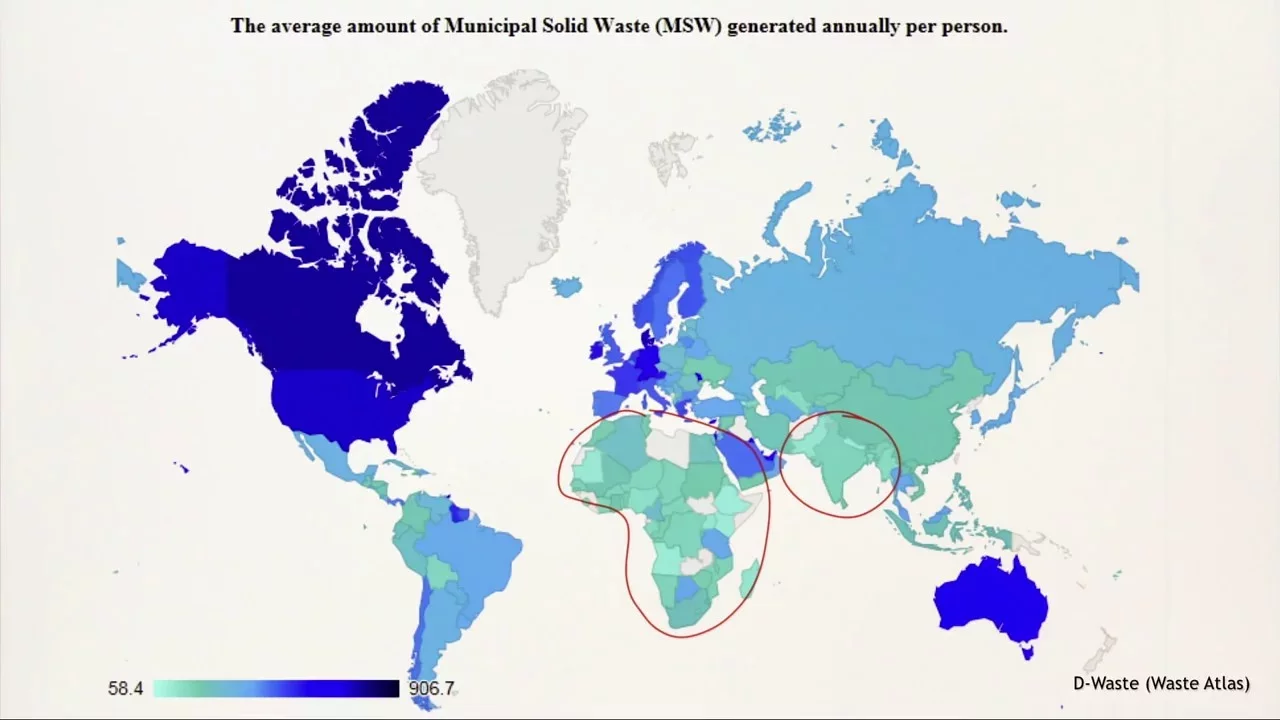
Another way of showing this is on the global map, shown with different colors, low waste generation and high waste generation in a darker blue. What you clearly see is the African sub-continent, which generally has low waste generation rates per person. Also, South Asia has quite low generation rates per person.
So what influences generation rates? The evidence is not so clear, but what is certain is that it's lifestyle, degree of urbanization, and what we have just seen previously, income level. Let me give you an example of lifestyle.
People that tend to not eat at home, and eat outside of their home, they tend to generate less waste at their house. That's a typical phenomenon of lifestyle. More information on city generation rates is available in this document: "What a waste a global review of solid waste management", which can be found on the internet and can be downloaded free of charge.
What's exciting in this graph is a projection for 2025 in categories of low income, middle income, and higher income countries. What you can see clearly here is that the increase will be mostly pronounced in the lower middle income countries. This is mainly due to a large population increase projected for 2025 in these countries.
Now, let's look at municipal solid waste composition. These pie charts show the different fractions in municipal solid waste. What we are showing are 4 different pie charts, for 4 different income groups: low income countries, lower middle income countries, upper middle income countries, and high income countries.
What we need to highlight is that in low income countries, the organic fraction, is significantly higher than the organic fraction in high income countries. On the other hand, packaging waste, paper and plastic in high income countries is much higher than it is in low income countries. Remember that waste composition may vary quite significantly, depending on the location.
You see here the same pie chart from the lower and middle income countries, and on the right hand side, you see the composition from Nouakchott, the capital of Mauritania. What is astonishing is that in Nouakchott, only 5% of waste is organic. And typically in the lower middle income countries, it's 53%.
So, why is this? In Nouakchott in Mauritania, many households have goats or they have friends that have goats. And most of the organic material, kitchen scraps from the households are fed to these goats.
That's why the organic fraction in the residue waste for collection is only 5%. On the other hand, there is a significant amount of "others", which is mostly sand and stones given the desert area of Mauritania. Another example is this one from China, where we differentiate between households using gas, and households using coal.
And you see, the difference is predominantly in the fraction of "others", which is mainly ash from using coal, which then, ends up in the waste stream. This example shows how waste composition affects collection. This is an example from Indonesia where waste at the household has quite a large fraction of sand and stones.
Here the waste collection vehicle was adapted by applying these mesh walls, which act as a sieve during transport, to let the sand fall out of the waste collection cart. Now, let's look at other properties of municipal waste, again, by low, middle, and high income country. What you see clearly is the moisture content, so the amount of water in waste which is significantly higher in low income countries than in high income countries.
Also, the density of waste which is due to the moisture is significantly higher in low income countries than in high income countries. Finally the lower calorific value is lower in low income countries, and much higher in high income countries. So why is this important?
Let's focus on density. If we use such compactor trucks as is shown here, these compactor trucks compact the waste up to a specification of 500 kilograms per cubic meter. Now using such a truck, under such conditions, does not really fulfill any purpose.
Because the waste is already so dense. This truck however is very useful in high income country conditions, where the waste is very bulky and needs to be compacted to efficiently transport the waste. Finally let's look at another property of municipal solid waste, the lower calorific value.
This is a very rough formula to estimate the lower calorific value of your waste based on the composition of your waste. What's important is that the result gives us an indication if the waste will burn or not. So for incineration without adding fuel, we require a lower calorific value of at least 1000 kilocalories per kilogram.
If we want to incinerate and recover energy, then we will require a lower calorific value of at least 1500 kilocalories per kilogram. In this formula, you see how the different composition of wastes equate. Plastic equates quite strongly in raising the calorific value, while the moisture content, the water content, of course will negatively influence the calorific value.
As an example, now let's plug in the numbers for a low income country. We have 6% paper, 2% textiles, and 53% biowaste, which would be the sum of wooden leaves and food waste. Then we compute 90 times the 7% of plastic minus 46 times 60% moisture, which is a typical moisture content of such waste.
If you calculate this, the result is a 310 kilocalories per kilogram. This tells us that this kind of waste here would not burn, and we would have to add additional fuel if we would want to incinerate it. Or, another option would be to significantly dry it and lower the moisture content in the waste.
Before concluding, now let's think of where and how to measure. In this module I won't give you the necessary information for a measurement campaign. However I do want to highlight a few main issues.
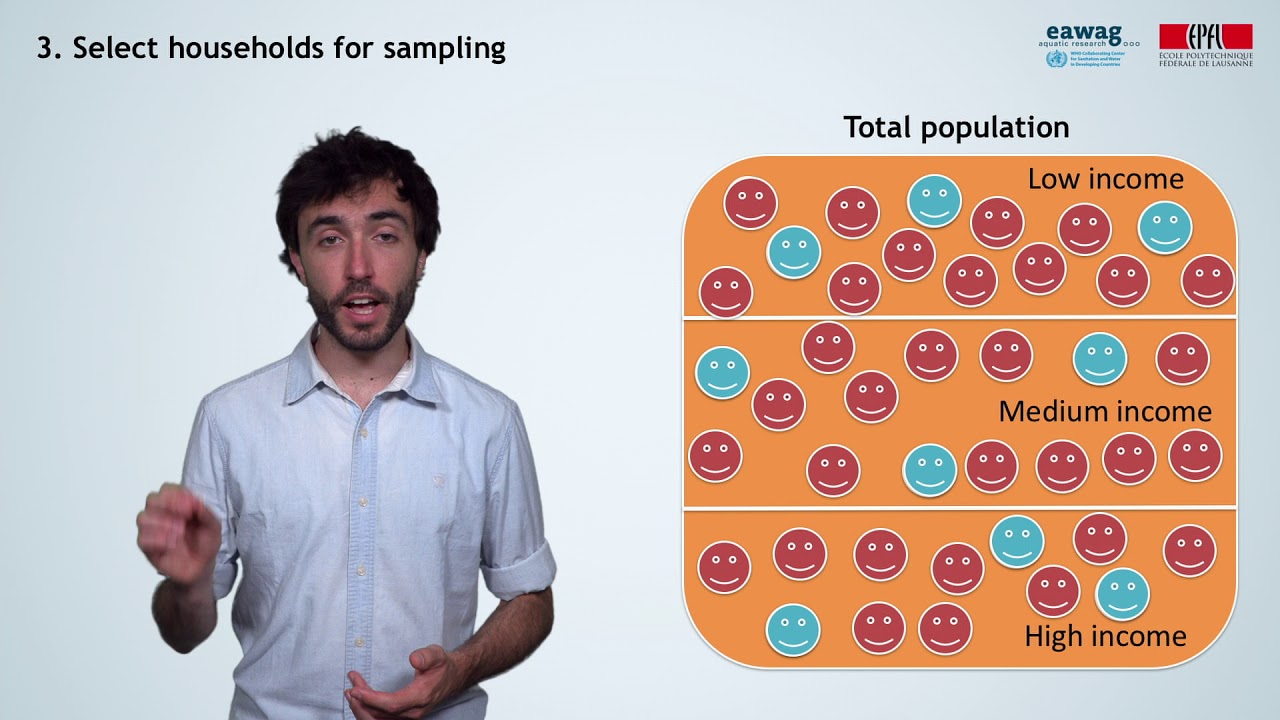
First of all, you need to think. If you want to divide into sub-areas, that's important if you want to understand how the different income groups affect waste generation. What you will also need to decide is on properties that you want to measure.
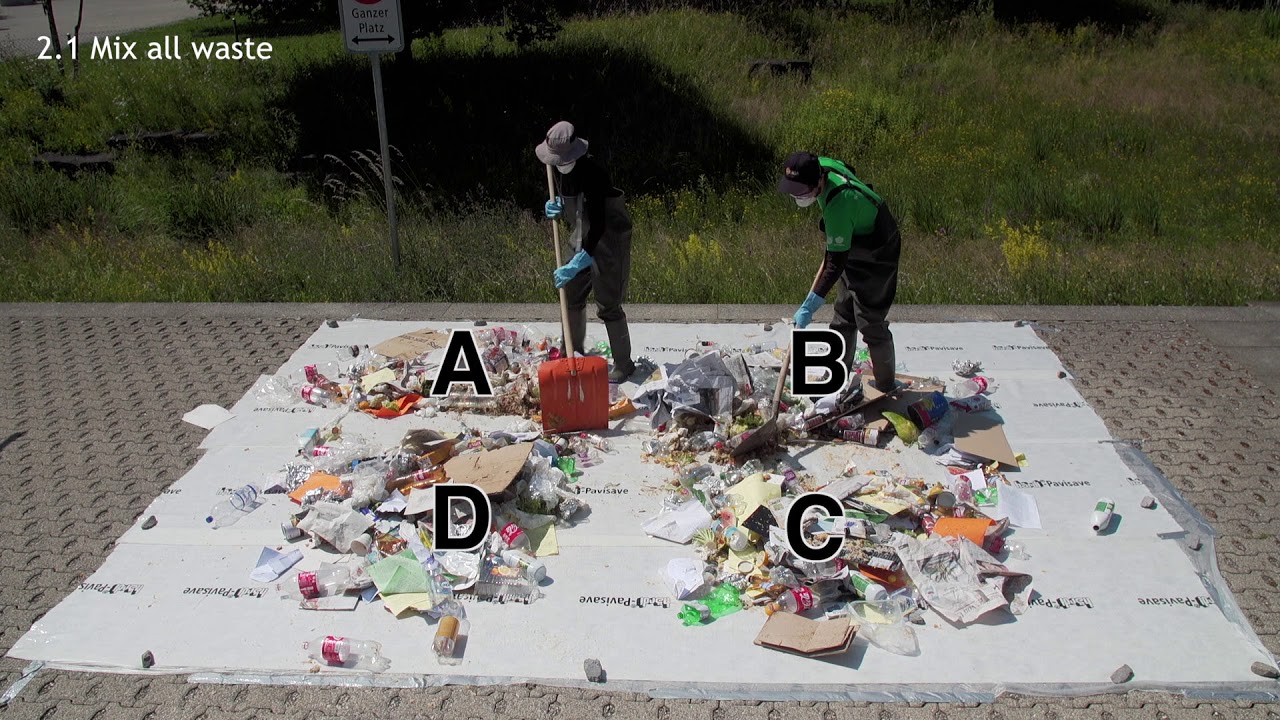
What is always important, is to ensure random sampling. To get the variation of waste generation, we need to sample over at least a week, and if possible, we should also ensure multi seasonal sampling, to capture the seasonal variation. So let's summarize what we've heard about in this module.
We discussed the importance of understanding what your questions are, before developing a measurement campaign. Then we looked at waste generation, and showed how it varies by country, by city, and how it correlates to income and lifestyle. We also looked at composition.
And the general rule is that low income will have high organics, high moisture, and high density, and low calorific value. And finally, we looked at some key issues in the measurement of waste characterization and generation, which is capturing the variation in the week and in the season, and ensuring random sampling. So thanks for listening.