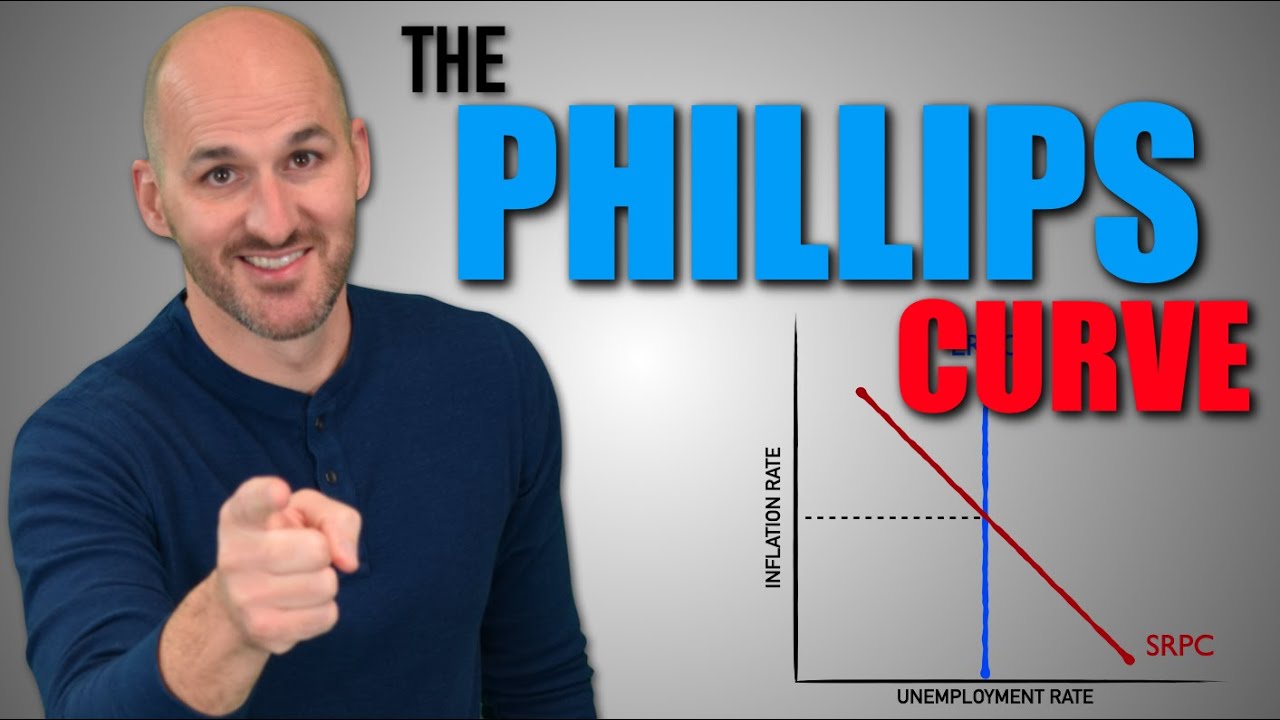
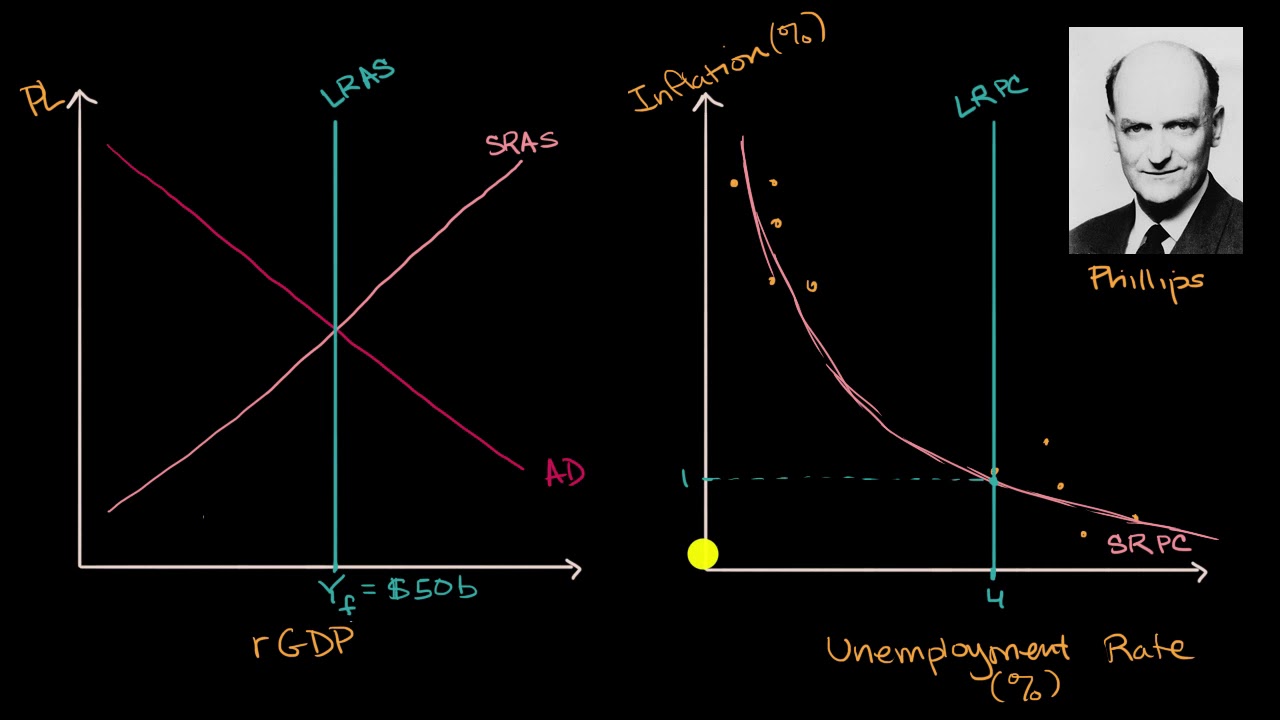
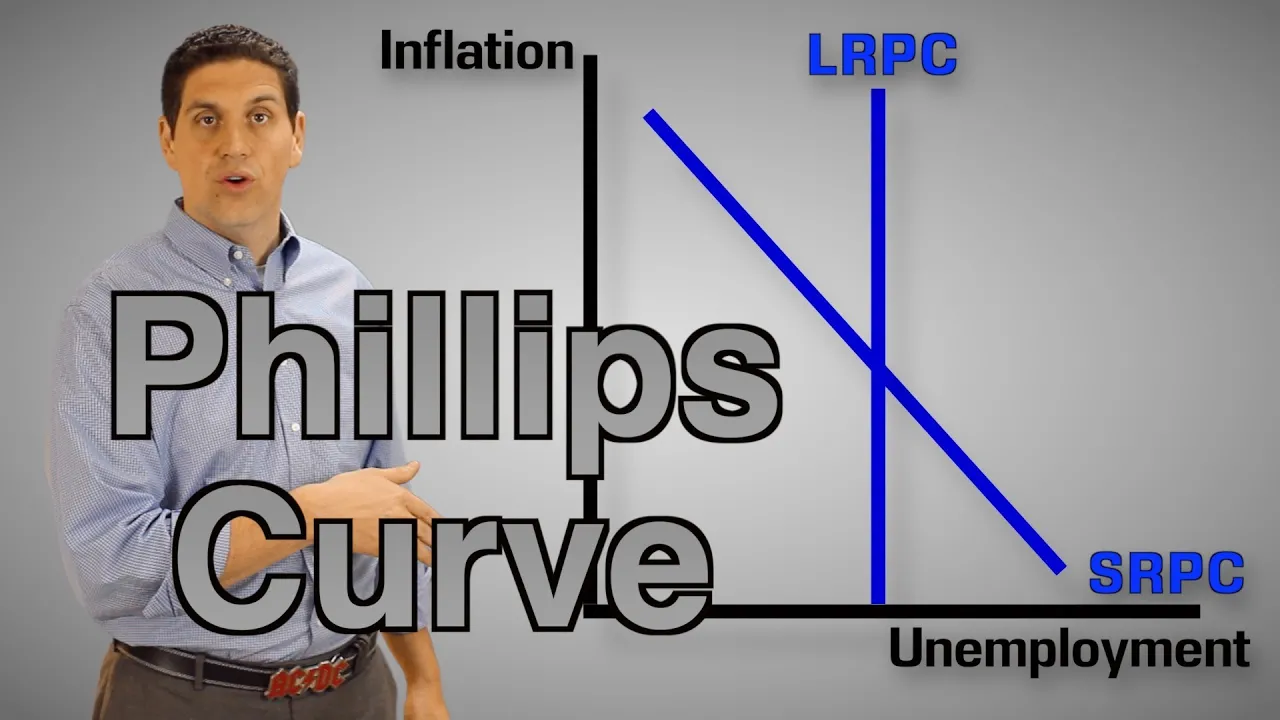
hey how you doing econ students this is mr. Clifford welcome to ac/dc econ right now we're going to do a quick review of the Phillips curve remember the economy can only be in one of three places at any given period of time a recessionary gap an inflationary gap or at full employment it turns out that the Phillips curve shows exactly just that up here we have inflation and down here we have unemployment in the short-run the Phillips curve looks like this it's downward sloping in the long-run the Phillips curve is vertical now let's use the
graph to find that three different places the economy can be in the easiest one is right here which is the idea of full employment this is the idea of the natural rate of unemployment remember zero percent unemployment is not the goal for the economy right we're always going to have frictional and structural unemployment and so four to six push that unemployment is considered full employment in this case let's just call it 5% unemployment that's the idea the natural rate of unemployment now what does a recession look like on this graph well it's a point right
there notice how there's high unemployment which is the bad thing of a recession but what's the good thing well low inflation right that's the idea of a recessionary gap an inflationary gap is up here notice we have high inflation which sucks but the good news about having inflationary gap is we have low unemployment the AP test will ask you to draw this graph showing the three different options just like they do with a great demand supply the economy is either in a recessionary gap full employment or inflationary gap hey bonus round just like a great
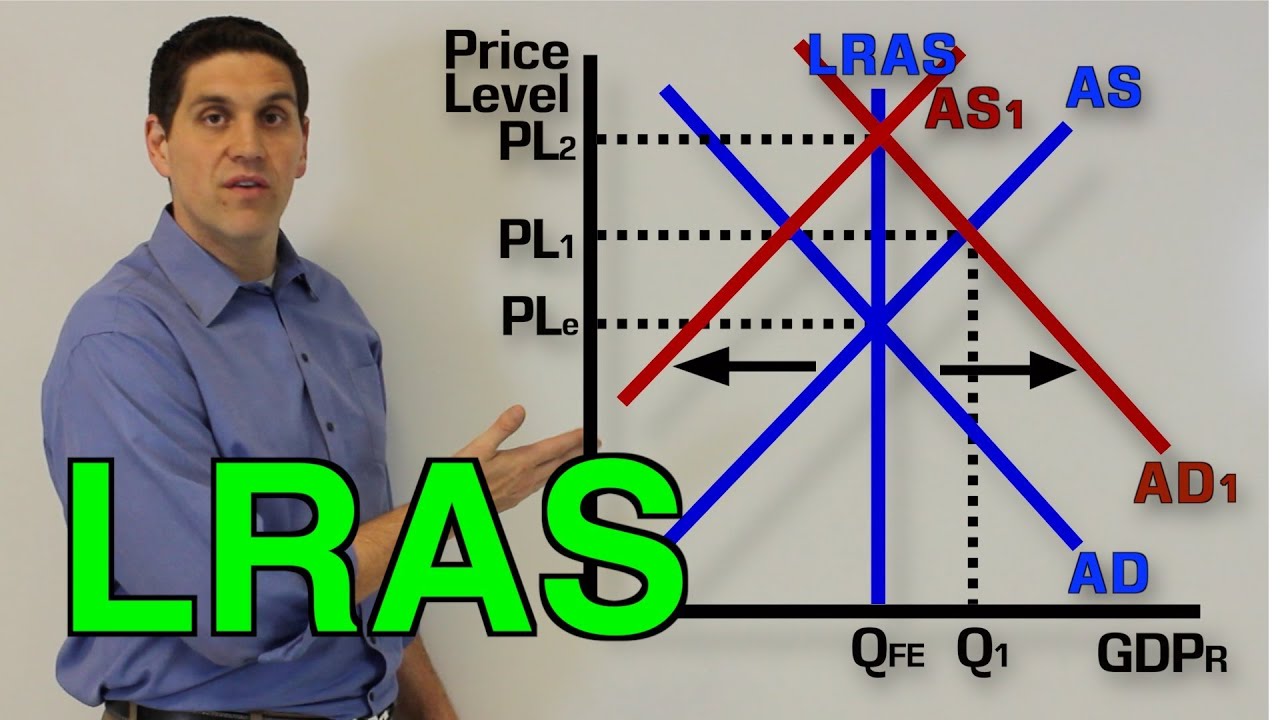
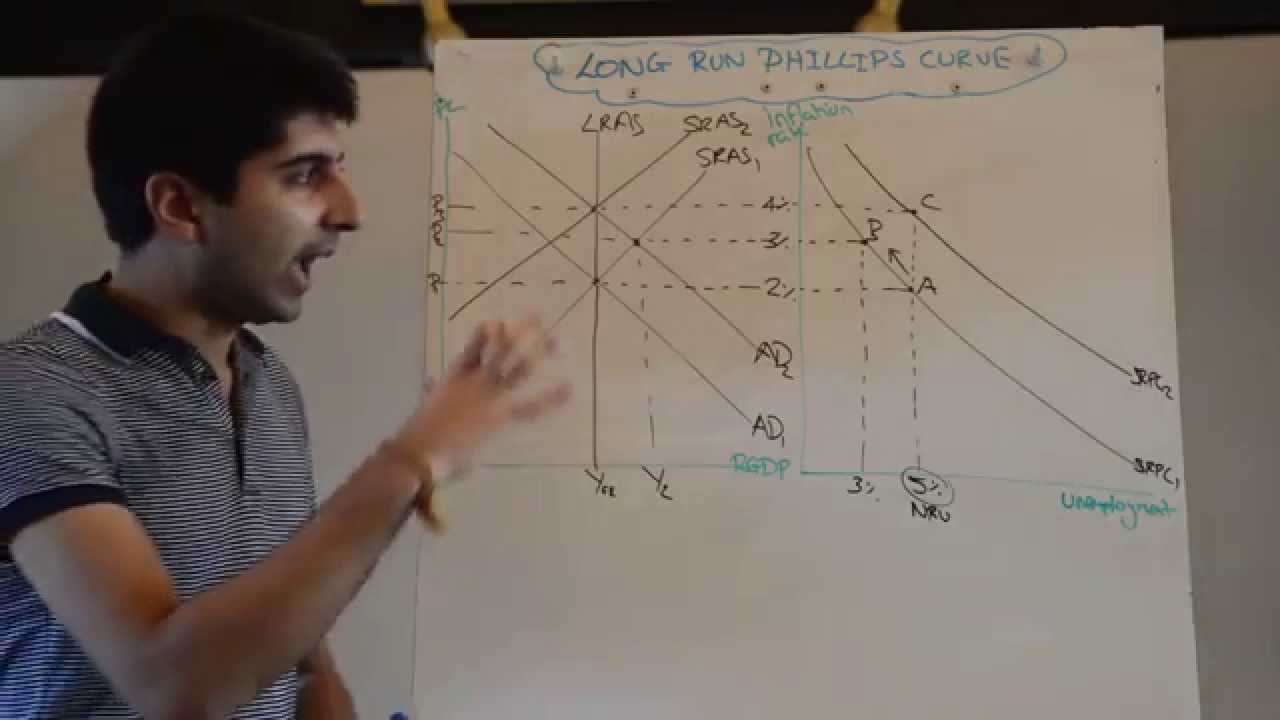
demand supply the Phillips curve can also shift so the best way to show this is by having the grass next door to each other over here we have a great demand supply and over here we have the Phillips curve they're both showing full employment if aggregate supply shifts to the left and we have stagflation remember higher price level and low output we're going to be at a new point point B that point B is somewhere on the Phillips curve well we have higher price level and low output which means you have high unemployment that means
the Phillips curve has shifted to the right we have more inflation and more unemployment so here's the rule with added demand shifts there'll be movement along the Phillips curve but when aggregate supply shifts the entire short run Phillips curve will shift bonus bonus round we're back at full employment on both graphs let's say there's an increased nagger demand leading to inflationary gap and since demand shifts we have a point on the short run Phillips curve right there remember this is the short-run what's going to happen in the long run on both graphs in the long
run when we have inflation wages will eventually go up and resource prices will eventually go up that means the aggregate supply curve will shift to the left putting us back at the long run aggregate supply or back at full employment that new point point C is somewhere on that graph our supply shifting means the Phillips curve will shift to the right that puts us right there at Point C both of them showing the idea of the long-run now that completely explains why we have these two vertical lines this line shows how much we're going to
produce in our economy at full employment and this vertical line shows the natural rate of unemployment the amount of unemployment we're going to have when we're in the long run don't forget to check out my other videos and my review app till next time