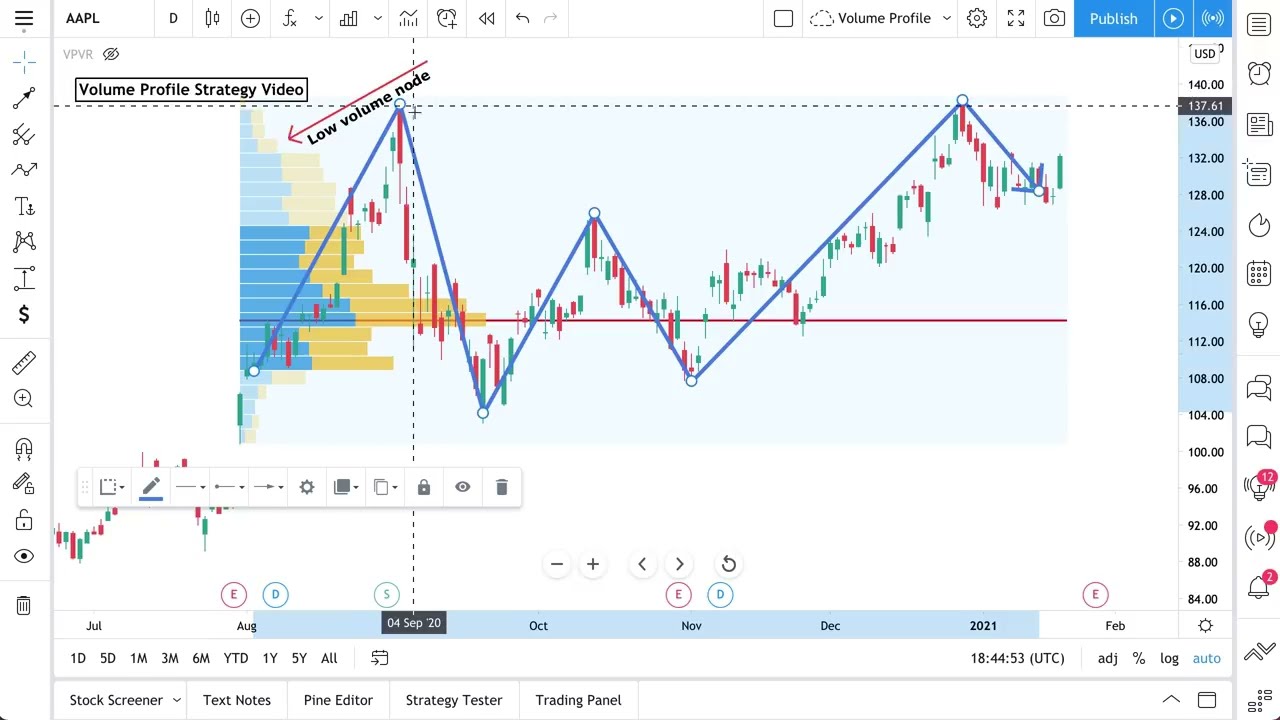
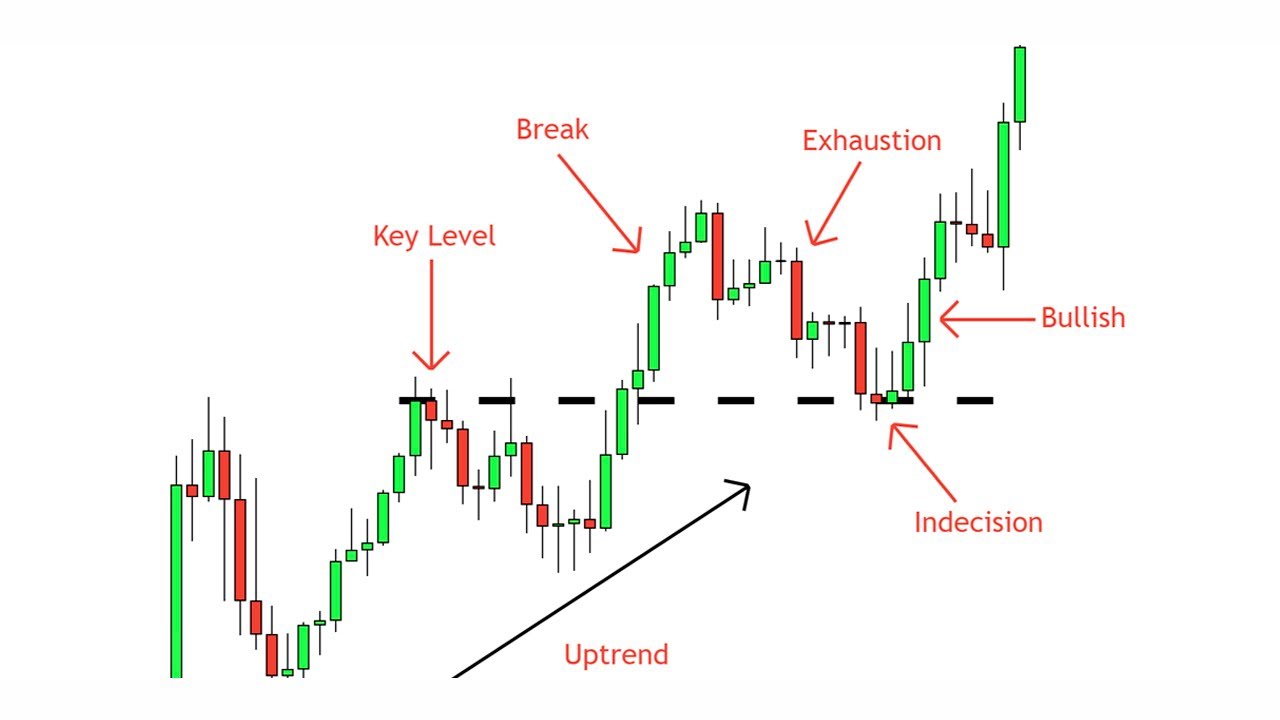
all right so in this video we're going to talk about the what and the why rather the when and the why of creating composites so what you'll see is that we take multiple days and we'll compress them into one distribution structure and we do this now when the market is trending but when it is falling into balance or when it is consolidating so again when a trend begins to show overlap with our value areas so where we have a trend coming from the bottom left moving upward we have value migration on the way up and
then we begin to have overlap and a loss of a previous day's value area low which signifies a definite sign of weakness at least an intermediate term for this trend this is when we begin to create a composite so when we start to see there's a level of overlap when we start to see there's a level of balance between two structures one of the more obvious signs of balance in this case is that we have an inside day so we have an inside day here this day the high and the low so the high and
the low is completely engulfed by the prior days candle so this day spent most of its time or rather all of its time within the previous day's candle this would be a case when we would form a composite so what we're doing is we're not changing anything we're just compressing both sessions and getting more actionable feedback as to in a rather visual feedback as to where we spent the most amount of time and where the most amount of volume was transacted so we treat this the same way whether we're creating you know two-day composite a
four day composite or a two-week composite obviously if the composite occurs over a longer period of time and we've been balanced for a longer period of time a break from this composite is much more significant because we're likely at that point building up a lot more potential fuel to the upside or to the downside so in this case we have a two day composite but the same rules that apply to a single day session still apply to this composite okay if anything they gained a little bit of substance so we get a break from this
move so we get a break from this composite on the third day and where does price come back down to after making a move above the highs it comes back down and re-tests the value area high of the structure successfully before moving upward so this is still showing that the trend does have strength so in this case we have back-to-back days back-to-back days of balance and this is when we create a composite you know the move to the downside we have an impulsive move to the downside it takes out all these levels and what do
we do again we begin to form a balanced area so we see that the market does this it goes from impulsive trending environment to a balanced more range constricted environment so on the first day that we have this where we have again a very compressed Day within the low portion of this distribution this is a double distribution and you have essentially two balanced areas within it the market responds to new information or just has a lack of conviction and violently moves liquidating any positions to One Direction we fall completely within the structure and again what
we're looking for is that similar situation where we're going to be creating composite to have a more detailed the idea of what the trading environment is within these structures so from here we get a more weighted idea rather of where we need to pay attention to to look for either meaner version signs of shift in momentum at the lows or at the highest for continuation back to the mean or a meaner version rather reversion back to the mean or if we have this composite formed over multiple days the low and the high that we're looking
to see acceptance gained within rather gained through so finally on that fifth day so we'll undo this so finally on that fifth day we have acceptance outside of this level which ultimately looks like presence without any kind of real Kickback you get a retest and you get a continuation out of this zone so this is a case where we have very tight days where all of the value was pretty much overlapped so in this case we have value area within value area within value area only here do we have a slight deviation but the move
that follows it actually gains acceptance to the downside and in something we'll cover further gains acceptance through an area where we had single prints when we start to gain that Acceptance in the market stays outside of this level we see a pretty violent move in the opposite direction so we we form Composites when we are in a relatively balanced state so relatively balanced State over time you could do this with monthly consolidations with weekly consolidations it doesn't really matter the idea is that the market has stopped trending and is formed in rather has fell into
some level of balance and what this does is it gives us more a more visually obvious cue as to where the important levels are within the range