welcome back folks this is lesson 2. 1 of january 2017 ict mentorship we'll be teaching using 10-year yields in a higher time frame analysis okay 10-year notes in higher time frame analysis you can see here on the right hand side we have a seasonal tendency for the 10-year treasury note and i want to take a look at the seasonal tendency chart for a minute and try to see where the most significant price swings occur and don't worry we'll be able to zoom in in a moment but you can see primarily there is a january february high it trades down to a june low and then a june low trading up into december's highs so there's two primary or dominant cycles in the seasonal for treasury notes and it's bearish for the first half of the year and then bullish for the second part of the year this teaching is going to give us an example where that takes place and we're also going to see when the seasonal tendency doesn't have an influence on the market and we're also going to see when the market actually performs adversely or contrary to the seasonal tendency okay before we get into it some quick notes for you when we chart the 10-year treasury prices or the futures contract we're using barchart. com when we chart the 10-year treasury yields we'll be using investing.
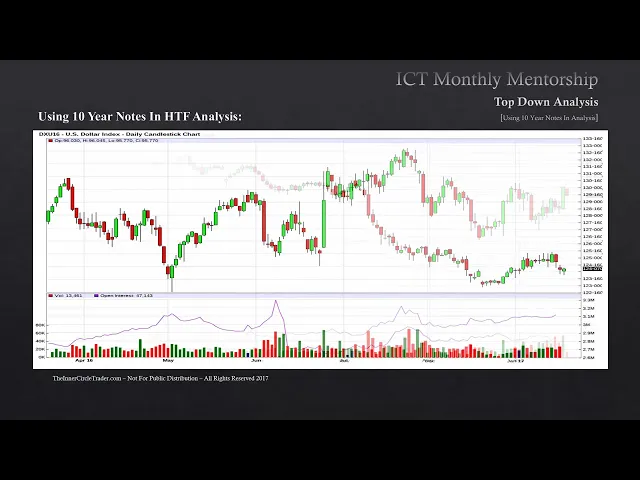
com both of these websites are free and some quick notes for you treasury prices are inverted to its yield as treasury prices drop that means the futures contract for the 10-year treasury notes when that price drops on the chart that shows a treasury yields increase as treasury prices rise treasury yields decline as a general rule of thumb long-term funds seek yield that means money will be placed or allocated in areas at which it will seek the majority or most return on investment okay the dollar index has it relatively easy or it can rally when the yields increase and this is seen when the futures contract prices drop on the 10-year note and the dollar has its easiest or most opportune time to decline when yields decrease this is seen when the treasury futures price rise okay here we have a zoomed in seasonal tendency on the 10-year treasury note and i want to take your attention to the first portion of the seasonal tendency and this is in january to february there's a high that generally forms and it trades down into around june or middle of the year and around june july it's really like the last week of may really if you look at it it's the last week of may and rolls into the first week of july usually it makes a seasonal low there and in the 10-year treasury notes usually rally the rest of the year now if we have this seasonal tendency on the underlying futures contract price in other words on the treasury prices this is not the yield the yield would be inverted okay so in other words if we're watching the june july low and prices on the 10-year are rallying that means interest rates are actually dropping so it's going to be an adverse effect or inverted effect on the yield if we see this occurring in the 10-year treasury we should be seeing what in the dollar index if we could show a seasonal tenancy which we happen to have one in the next slide by the way if we have the dollar index as a seasonal tendency should this be occurring at the same time that we see the june july rally should that be occurring with a bullish or bearish move in the dollar index uh here's that seasonal tendency for the dollar and you can see around the january february time there's usually a rally that takes place which is contrary to what we saw in the 10-year treasury notes declining then we have a significant high forming between june and july and then the dollar index typically trades down the rest of the year usually making a low around the last week of october first week of november and it creates a small little bounce on november time period for the dollar index so the primary two trends in this market for the dollar that is in alignment with the seasonal tendencies seen in the tenure is there is a bearish tone to the marketplace for the dollar index mid-june to july and then we also see some rallying on the dollar index the beginning of the year going into march now there is a seasonal tendency for dollar to decline march into may but that would have to be in bearish markets and in bullish markets you could expect to see november be a buy may be a buy and january be a buy for dollar index and the sales come in that march june july and there's one in uh september and it usually creates uh some short uh high in the latter portion of november let's go back to the 10-year treasury notes just for a moment okay you see there's a strong contrast between the two and that means that we do have a high probability scenario for if the 10-year treasury notes are rallying in the in the futures price that means that the yield will be doing the opposite they'll be going down so interest rates will be dropping the interest rates are dropping that's going to cause the tendency for yield seeking traders or investors to avoid the dollar index because if the interest rates are dropping that's not going to incite wanting to buy dollar-based assets so the reason why we're seeing this adverse effect here is because there is a direct inverted relationship between the two so if we have this blending of these two markets it gives us a context to work with if we're going to be looking for quarterly shifts in the marketplace okay here's the 10-year treasury note this is the september contract of 2015. and remember that we saw the seasonal tendency to form a low in june july and a 10-year treasury node contract for september because the u in symbols name znu15 left hand corner that u stands for the month of september that's the delivery contract of september you can see that the contract prices or treasury note prices started to rally in june that means that the yields are going to be decreasing or declining and that's going to be bearish for the dollar index you see in june july we made a short-term high traded lower we violated the low in may and then look what happens between mid-june into july and august the dollar index actually has a little bit of a rally at the same time going back to that september contract of treasury notes 10-year the same time the treasury notes were rallying with its seasonal tenancy if we look at the dollar index it was slightly bullish as well so when we see this scenario we are looking at the likelihood if they're moving in tandem that means we're actually going to be in a large consolidation that means it's not going to be a trending environment most likely and that means we want to look for previous highs and previous lows to be violated and back to the middle of the range you can see that was the effect here after july and august the late part of august we came all the way down took out the may june lows the market essentially for the dollar index moved sideways 2016 september contract of 10-year treasury notes again we can see that last week of may going into june that seasonal tendency for a load of form for 10-year treasury notes 10-year treasury notes rally all up into july and that should give us a bear stance for the dollar index the same time [Music] and as you can see we did have a bearish decline in the last week of may going into june and it gave one more lower low in the lighter portion of june but look what happens again we have the dollar index rally one more time and again we'll go back to the previous slides you can see the 10-year treasury note see i have a slightly higher high going into july as well and then we saw that and we saw that one more higher high pushed into the dollar index in the latter portions of july again this is going to be an indication that the markets are going to be in a large consolidation so think about what we've already shown here if the market's showing the tendency to be in a large consolidation why because both yield and dollar ten year treasuries and the dollar are moving in the same direction if that occurs what we're looking at is long-term indecisiveness and that means because both of them are moving in tandem the likelihood of a continued directional trade higher or lower for either one is highly unlikely so we would be focusing on looking for stop raids or looking for if the data range to look back and see previous highs and lows to be violated when both treasury and on the dollar index so if we're looking at this condition what do you suppose that does for foreign currencies it does several things number one it puts you in a long-term consolidation on foreign currencies because the dollar is in consolidation and treasuries are under consolidation if we see times when the treasury market is in fact moving in its seasonal tenancy and the dollar is supporting that same seasonal tendency then we have a strong probability of a directional long-term trend and that's where the large funds place their money when you get into the marketplace on those moves you have these long periods of many weeks several months in terms of one directional bias moves in other words long-term trends okay our next example now we're looking at the march contract of the 10-year treasury notes for 2017 and i'm using this contract because it allows me to show the data for the latter portion of 2016 and going into present trading day you can see here that treasury market seasonal tendency to create a high in november and let's go back to that seasonal tendency just so you guys can see it okay here's the seasonal tendency once again for the 10-year treasury note all the way to the far right you can see that green line that vertical line that most furthest to the right that furthest most right green vertical line that delineates the beginning of the trading for the march delivery contract you can see that that actually makes the high of the march contract and it starts to trade off lower from that price point that seasonal tendency to create that high for a march contract is going to be influential for us in that next slide that we just looked at so here we are back again that same 10-year treasury notes slide for 2017's march contract now we had the presidential election obviously in 2016 and what we're looking at is that high that the election results shown for donald trump making our president-elect at that time of vote the seasonal tendency for the march contract could create a high you can see that came into effect in november so while we're looking at the end of that uptrend for the seasonal tendency on the 10-year treasury note we're looking at the beginning of a seasonal high and that gives us that movement going lower into the latter portions of december and that's what you see here that's transpired 2016. if we see this occurring okay and it's now trending it's not in consolidation it's down trending for the 10-year treasury notes that's going to provide the opportunity for the dollar index to do the opposite but also do it in a fashion that's in a trending mode you see in november we had that same in fact just in opposite terms where the election shown the sell-off in the 10-year treasury notes that sell-off shows an increase in interest rates which means there's going to be an interest to now buy dollar because it's going to be going higher as the 10-year treasury is dropping interest rates are increasing which means that there's going to be buyers that's going to be seeking yield by buying the dollar index and you can see the market did in fact have a trending environment trying trending higher then creating a short-term low in december and finally making its high in the first portion of december of this year so the moral of all this is that if we study the 10-year treasury notes in its price action it's either going to be moving in its seasonal tendency or if the dollar index moves in tandem with it that suggests that we're going to be in a large consolidation if you look at all the currency pairs that we trade in the form of the british pound the euro dollar those pairs were in big consolidations all through the mid portion of 2016.