is your machine learning classification model truly effective or just a lacky gas the confusion Matrix function from the carrot package holds the answer most people only glance at accuracy and then jum straight to sensitivity specificity and predictive values but they often Overlook the fundamentals no information rate Kappa and P values the very first Matrix in the confusion Matrix and here's the thing they aren't just space fillers Advanced machine learning experts know they are essential for evaluating a models reliability that's why they are at the top of the confusion Matrix so let's dive into this of
Overlook metrics and show how they separate the pr from the amateurs the no information rate is the accuracy you would get if you always predicted the majority class why does no information rate matter because a high accuracy can be misleading especially with imbalanced data sets for example if 90% of your data belongs to one class a model that always predicts that class will have 90% accuracy even though it's not actually smart the no information rate helps you check if your model is genuinely better than this simple Baseline no information rate is calculated as the proportion
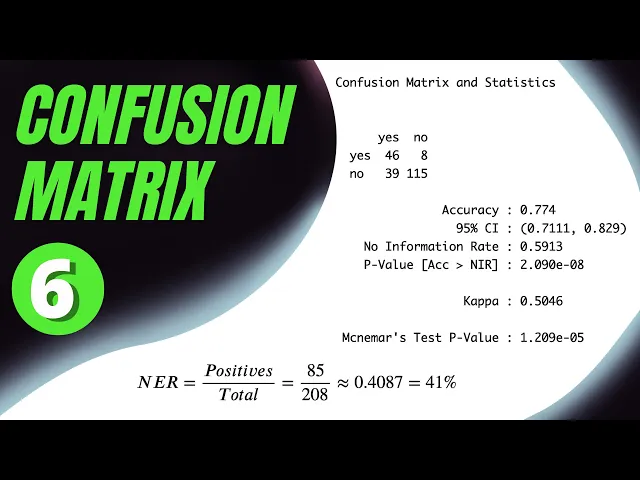
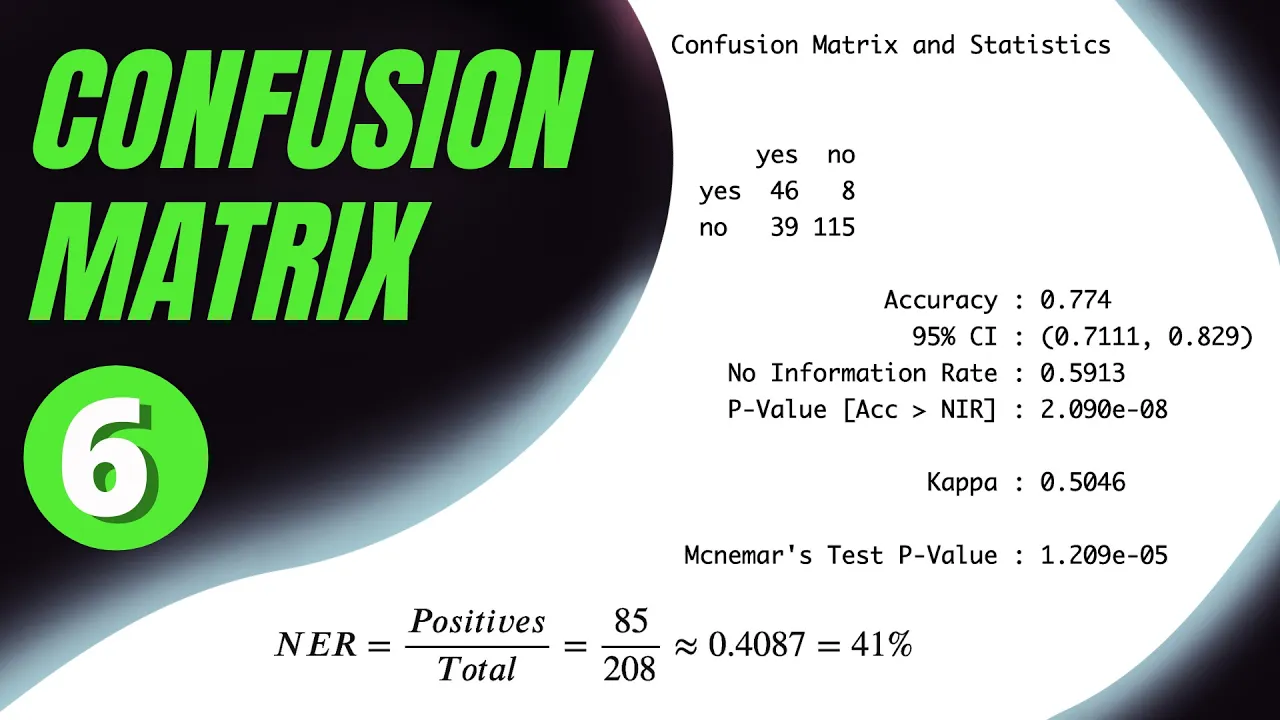
of the most frequent class in the data set the no information rate of 59% means that if we always predicted the majority class negative outcome in our example we achieve 59% accuracy our model's accuracy is 77.4% which is much higher than the no information rate showing that our model performs much better than a trivial classifier the 18.3% Point Improvement demonstrates that our model adds real value over simply predicting the majority class but how do we know this Improvement is statistically significant great question and that's exactly what the X metric P value tells us let's dive
into it the P value helps us determine whether our model's accuracy is significantly better than what we would achieve by simply predicting the most frequent class and the P value is calculated using a one tailed binomial test which compares the observed accuracy of the model 0.774 to the no information rate we just calculated here's how to interpret it the null hypothesis assumes that the model's accuracy is not greater than the no information rate and the alternative hypothesis states that the model's accuracy is greater than the no information rate if the P value is less than
005 we reject the null hypothesis this means the model's accuracy is significantly better than the no information rate proving it adds value Beyond simply predicting the majority class like in our example but if the P value is 05 or greater we fail to reject the null hypothesis this suggests that the model's accuracy is not significantly better than the no information rate indicating it might not perform meaningfully better than a naive classifier so this P value provides a critical check it gives you confidence that your model's predictive power is real and not just a fluke listen
to me very carefully the next metric is a hidden gam because it's not shown directly by the confusion matx function but can be easily calculated from it and it's incredibly useful the null error rate is like the no information rate but instead of accuracy it's expressed as an error rate it shows the error rate if we always predicted the majority class this gives us a baseline to see if our model is truly reducing errors compared to a naive strategy null error rate is especially useful for imbalanced data sets where the majority class dominates and accuracy
alone can can be misleading the null error rate is simply the proportion of the minority class in the data set for example if the minority class has 85 positives out of 208 total cases always predicting the majority class which result in 85 incorrect predictions the Baseline error alternatively the null error rate can be calculated as the opposite of the no information rate but what does a null error rate of 41% mean a null error rate of 41% means that if we always predicted the majority class would be wrong 41% of the time this gives us
a clear Benchmark to evaluate our model's performance and here is why a good model should have a significantly lower error rate than this Baseline of 41% our model has an error rate of 22% much lower than the 41% error rate but how do we prove this difference is statistically significant well similarly to the P value above we use a one-tailed binomial test to check if the error rate in our model is significantly smaller than the null error rate in this test the null hypothesis assumes the model's 22% error rate is not different from the 41%
null error rate but since thep value is below 005 five we reject the null hypothesis and conclude that the model's error rate is significantly lower than the Baseline null error rate so the null error rate helps us to confirm whether a model is truly reducing error comparing to Simply predicting the majority class while the confusion Matrix function tests if accuracy is significantly greater than the no information rate the null error rate provides a complementary view by assessing if the error rate is significantly lower than the naive Baseline together this metrics provide a deeper understanding of
model performance and while no information rate and null error rate highlight how much better or worse your model is compared to a naive Baseline the Kappa statistics goes one step further it measures the agreement between observed and predicted classifications so we need to talk about Kappa next the Kappa statistic tells us how well the absorved and predicted classifications match while adjusting for agreement that could happen by chance this makes it especially useful when dealing with imbalanced data sets or multiple classes where accuracy alone might be misleading I actually think the Capa statistics and agreement metrics
in general deserve their own video if you'd like to see that let me know in the comments for now let's focus on on interpreting Kappa coins Kappa ranges from minus1 to + one where + one means perfect agreement zero is no better than random guessing and negative Kappa is worse than random guessing yes that's possible using the commonly accepted interpretation scale our cap of 0.5 shows moderate agreement between the observed and the predicted classifications and while knowing the agreement is insightful alone doesn't tells us if that agreement is statistically significant that's where mnar TP value
comes in magnamar P value tests where the disagreements between the model's predictions and the actual outcomes are statistically significant or just due to random fluctuations in the data while metrics like accuracy precision and recall provide an overall assessment they don't zoom in on where the model gets things wrong mnar test focuses specifically on those mismatches showing if the errors are random noise or if the model's performance is truly reliable here is how to interpret magnar's P value small P value below 005 indicates a statistically significant difference between your model's predictions and the actual values in
plain terms your model isn't just making random mistakes there is a pattern to its errors for example it might be consistently wrong in certain situations which tells us the errors aren't Happening by chance in our example the model has a higher number of false negatives 39 compared to false positives eight this means our model is more likely to miss real positive cases than it is to wrongly call negative cases positive why does this matter this pattern is crucial in contexts where missing positive cases is more serious than incorrectly identifying negatives such as in medical diagnostics
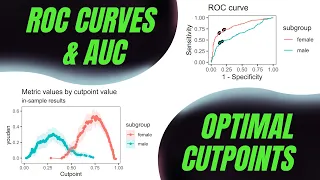
for example missing a cancer diagnosis false negative can be more harmful than a false alarm false positive but what can we do about it to improve our model's performance well adjusting the threshold to reduce false negatives might help which I discussed in the previous video on the Rock curve but for now let's get back to magnar's P value large P value above 005 is actually what we want it suggests that the disagreements between the predictions and actual values are likely due to random chance and there is no strong evidence that your model is making systematic
errors in short a small P value signals something worth investigating while a large one tells you the model is fine but magnamar test does more than just compare actual values to predicted ones it can also compare two classifiers if you need to know which one is better and since statistically comparing classifiers is crucial for any serious machine learning expert you absolutely need to dive into magnamar test next