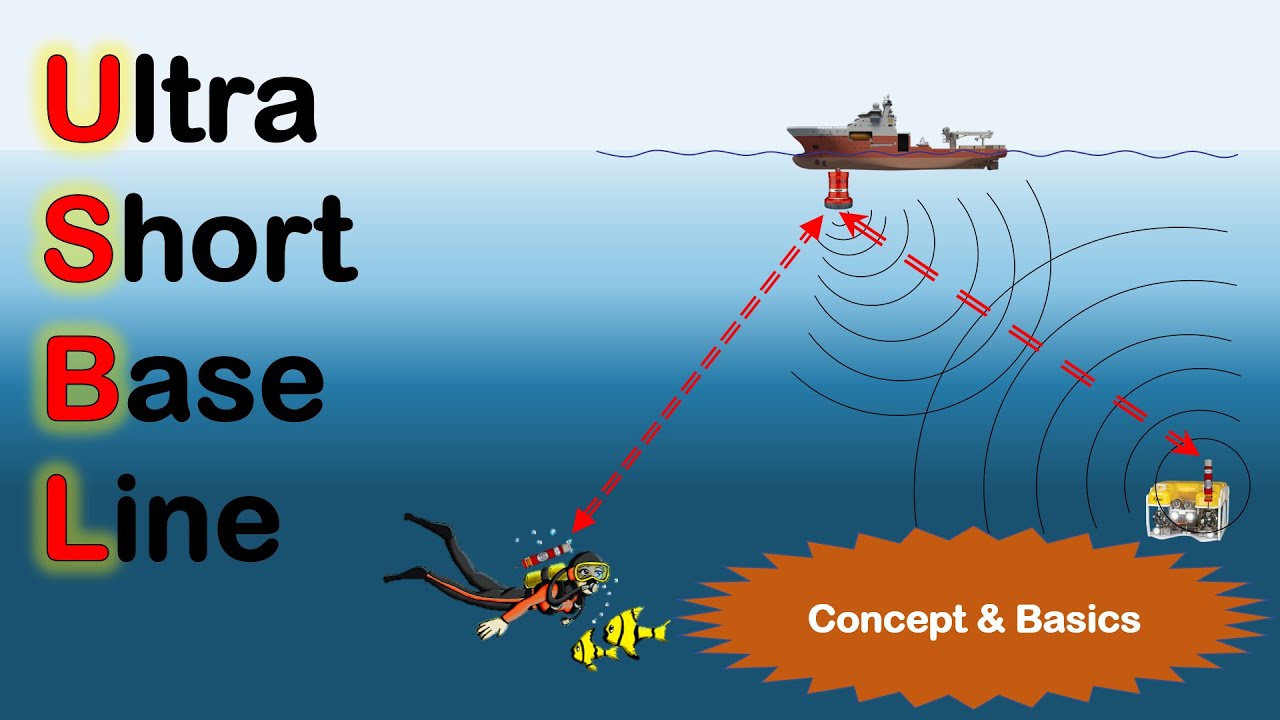
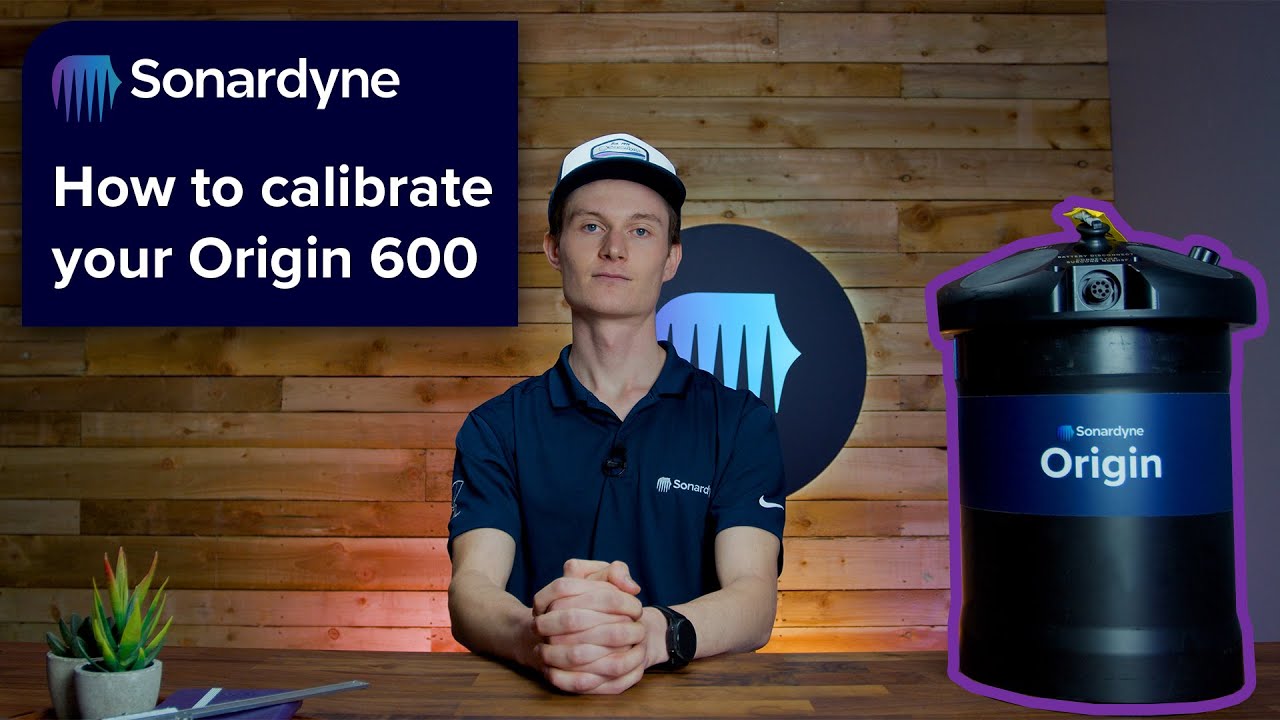
hello and welcome to this uspl training module on cassius by the end of this module you'll understand when and why a cassius is performed and you should also understand how we perform a cassius and how we can verify its quality we will be covering why you would perform a cassius the instruments required former of data collection processing and qc and finally we'll look at the cassius verification checks so if you're not already aware cassius stands for the calibration of attitude sensors in a usbl system and what that means is we are basically aligning the usbl
transceiver or hpt to the vessel frame this is in terms of pitch roll and heading so we're aligning our usbl head to the vessels pitch roll and heading sensors it's normally completed after an initial installation on a vessel but it should also be subsequently done every time the usbl head is replaced onto the pole it's also a good idea to do it after you change any of the vessel sensors without calibrations without performing a cassius there may be positioning errors in the system so it's always a good idea to do it so what's required to
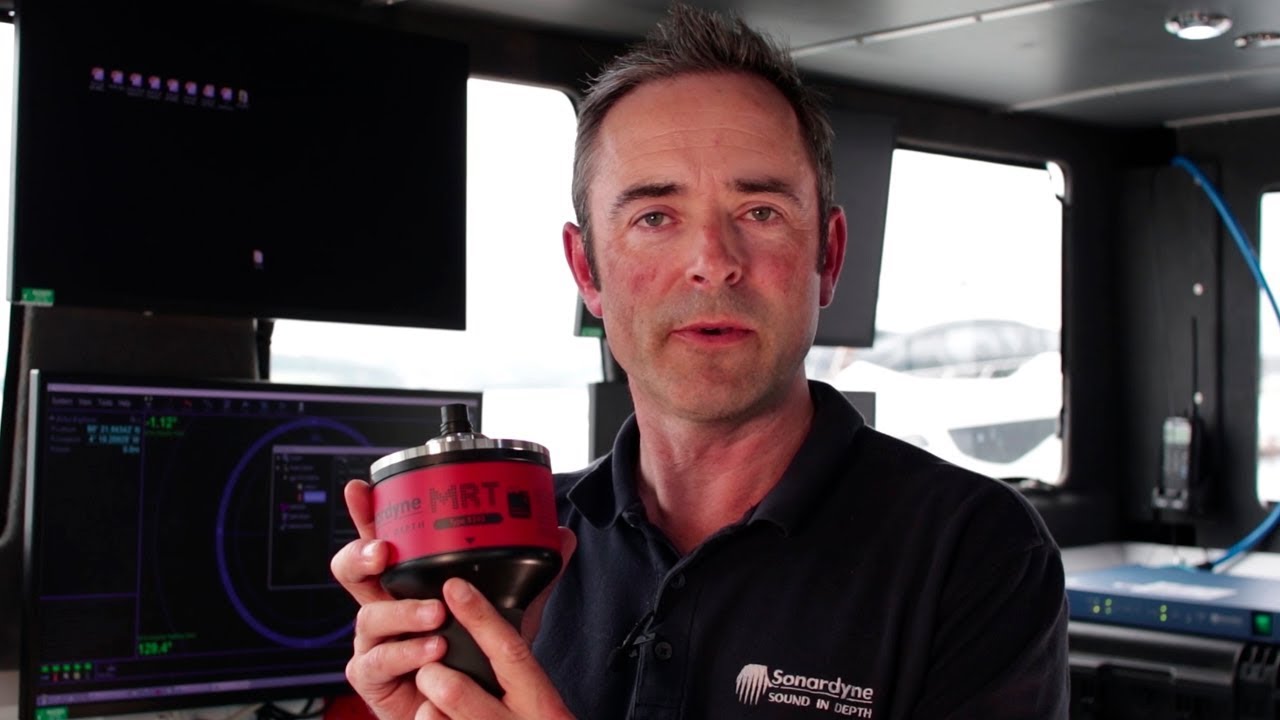
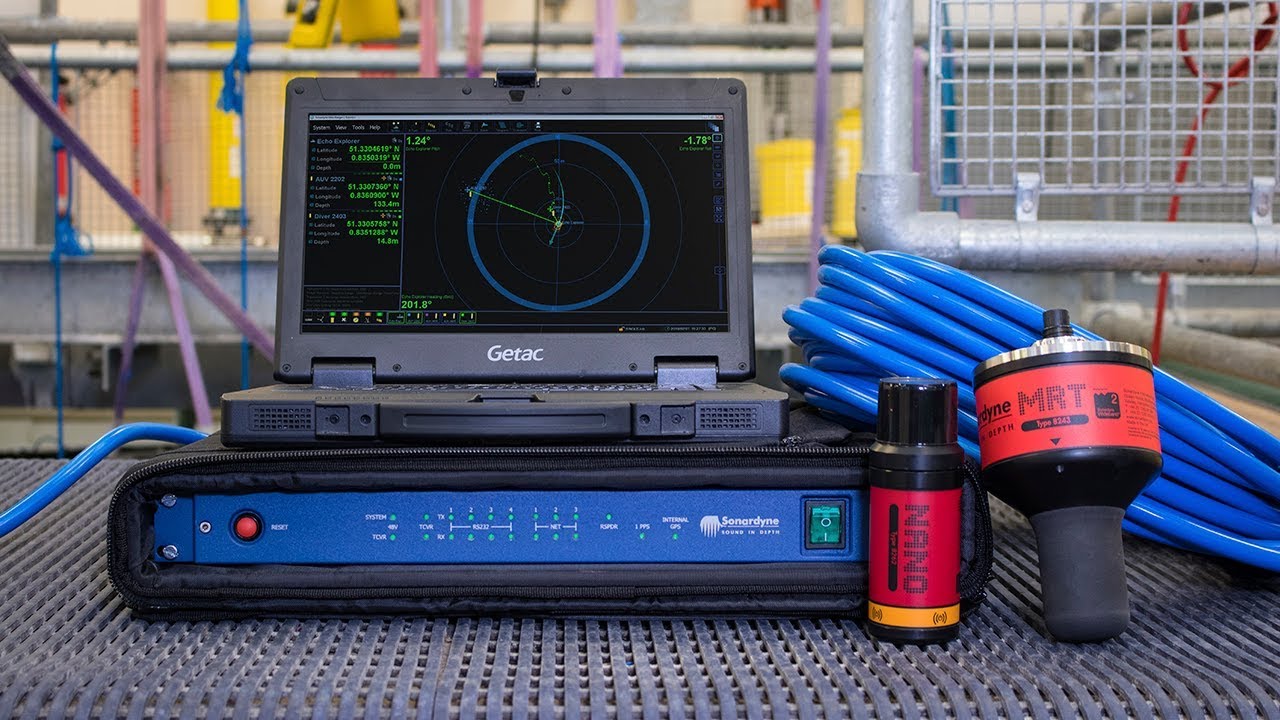
perform a cassius we've already briefly looked at the hpt our usbl transceiver this goes on the end of the pole on the bottom of the vessel we're also going to need a gnss to give us a world position and finally we need an attitude device or viu that gives us pitch and roll and also heading now these are usually two separate units but they can be combined into some something like a lone star so with these instruments uh installed on the vessel and interfaced to the ranger 2 system it's also important to consider our offsets
it doesn't matter really where the offsets are referenced to normally it will be the vessel crp but they can be measured from anywhere they just need to be measured from the same place the same origin so for our usbl head we need x y and z and same for the gps we just need xyz offsets and then for your pitch roll and heading any installation offsets need to be accounted for now they may already be outputting in exactly the correct frame and already corrected but it's always worth double checking okay one of the most important
things for any acoustic positioning system is going to be our sound speed in the water column so if possible you need an up-to-date sound velocity profile taken with a profiler or a ctd if that's not possible to do because the vessel doesn't have the correct equipment there is actually a built-in global sound velocity database that will look at your gps position and the date timestamp and provide you with an estimated sample take from a global library if you don't have a good gps position or you're particularly coastal it might be easier or better to use
just an estimated surface value and an estimated mean through water sound speed but the up-to-date sound velocity profile is going to be your best solution if possible so to collect data um to perform a cassius the first thing we need to do is deploy a beacon on the seabed ranges to the beacon are then logged with gps pitch roll and heading and the vessel will then transit run lines or indeed static positions in some cases so just a quick word on beacon deployment you've got a few different options possibly the most simple is just to
have a compact uh deployed on the seabed with a float collar and a release mechanism that you can then actuate once the cassius is finished and retrieved to deck probably the best method is a sea bed tripod of some sort because obviously this is much more static and stable currents of the seabed aren't going to affect a tripod however you will obviously need an rov to collect this or you might want to consider a two or three-point mooring whereby a mini beacon or indeed a compact um could be in a float collar or have a
buoyancy module and a short strop above it is attached to a weight on the seabed there will then be an offset weight which is normally um about the length of two times the water depth plus the vessel length with a location boy at the surface attached to it uh the reason we have this offset is to allow the vessel to carefully maneuver um around the beacon without actually being in danger of coming into contact with the location boy okay so the first data collection method i'm going to talk about would be for a dynamically positioned
vessel so that's just a vessel that's able to hold station um and in this case what we're going to do is use cardinal points so we'll collect data right over the top of the transponder and then we're going to take four cardinal points so usually north south east and west of the transponder and these would need to be spaced at roughly one third of the water depth up to a maximum of 500 meters we then collect 100 ranges as a minimum more likely 200 at each point if you've got the time which will give us
five data sets we then do exactly the same on reciprocal headings so we end up with 10 legs of data just a quick word on determining your headings um it's best to collect cassius data when uh the vessel is as stable as possible um obviously that might not always be possible so just generally speaking if you can plan your heading so that you're pointing into the weather just to reduce as much role as possible on the vessel uh that's going to give you better results okay so if you don't have a dynamically positioned vessel um
you can use what we call run lines um where the vessel basically transits up and down over the top of the transponder and we want to be collecting ranges to the transponder within a radius or the third water depth again up to 500 meters maximum so we would be on the vessel and the vessel would sail within the radius of the third water depth we would then start collecting ranges to the beacon imagine those green lines continue um the vessel would then maneuver and start onto another line and we would start collecting data again and
then stop once we got to the edge of the third water depth radius again we want to do these lines on reciprocal headings to get a good heading correction for the transceiver if you're in particularly shallow water it might not actually be possible uh or indeed practical to transit lines in a third of the water depth for example if you're in uh you know 30 to 50 meters of water it's going to be really hard to do those maneuvers so what we can do is what's called cloverleaf type shape where you would do two finger
of eights so the yellow figure of eight and then the white figure of eight on screen centered over the top of the transponder if you could make the cloverleaf pattern around 50 meters wide that's perfect it's not too bad if it's slightly wider but this is a good good number to aim for generally speaking in the shallower areas they tend to be a lot more tidal so if it can be performed at slack quarter that's going to just minimize any height error when you do come to process the cassius however there is actually a built-in
title model that should account for this when we do do the processing okay so once we've processed our data uh sorry once we've collected our data we come to the processing phase and what you might end up with if we've done a dynamically positioned cassius is data that's collected over the top of the beacon so your first cluster in blue might look something like that nice and tightly grouped but spaced over to the right and then you change your heading and do it on a reciprocal heading so 180 degrees difference you've now got a nice
red cluster however it's in a different position which is what you'd expect because the system has not been calibrated yet so once you've done all of your cardinal points you end up with these 10 group clusters we've run it through the casio software and hopefully they will all converge on one point which gives us a nice good stable position for the transponder once the software has processed the data it spits out a number of graphs um previously if you've used the cassius 5 software you're probably used to this spike plots where you may have seen
this spike plot before and what we were looking for is a nice short nice tall sharp spike which means that all of the beacon positions nicely converge on top of each other if the spike was uh was wide or there were multiple spikes this would indicate that it's a bad cassius the newer software casio 6 has moved on to using a point cloud now so instead of the spike you get a graph that looks more like this it shows exactly the same information it actually shows you a bit of the depth resolution slightly better but
what we're looking for here is a nice tight point cluster so once we've processed the data we're going to have to look at our cassius report to see how good the calibration is now the first place you're likely to look is going to be your position error which gives you information on the error remaining in the system after the cassius and indeed before so perhaps the most quoted figure that you'll hear for usbl systems is the one drms or distance root mean squared which is like your horizontal or 2d quality and what we um what
we define this as is that 63.2 of our position fixes for a beacon will fall within this radius so in this example you can see that the 1d rms before the cassius was 17 of the water depth and after it it was 0.13 so what you can think of that as is in 100 meters of water before the cassius you would likely have a position spread of about 17 meters and after it it would be in the region of 10 centimeters the next place that uh you're probably going to want to look is your transceiver
offsets so the numbers in red are showing your actual cassius offsets these are the numbers that we need to input into the ranger 2 system and apply them to the transceiver and next we also probably want to have a look at the starboard forward and depth offsets for the transceiver now as part of the cassius what it actually does is it tries to back calculate the lever arm between the transceiver and the gps so depending on how good your offsets were measured in um on the vessel the before and calculated offsets should roughly agree you
would expect these to be within certainly within a meter of each other and anything over that might indicate uh some problem with the calibration um or poor offsets the calibration report in full has a lot more information on it and we're going to look at that in a bit more detail during the practical session so generally speaking what we're looking for is a 1d rms that is less than one percent of the water depth different clients and different uh companies may have uh criteria that they need to meet but certainly we we'd be looking for
less than um 0.5 of the water depth for air for a good gaseous the transceiver offsets should also be close to the measure offset so that's the before and calculate that i talked about in the previous slide okay so we've completed our cases now we need to verify it so the first test we do is to verify for any residual pitch and roll errors in the system now these errors will manifest by basically incorrectly positioning the beacon slightly forward or aft or slightly caught and starved of the vessel as can be described by these pitches
on the screen and obviously as the range from the beacon gets further away the error will also be larger the test we can do to test uh for any pitch and roll errors is called the spin test and what we do is we position the vessel over the top of the beacon and then the vessel will spin through 360 degrees whilst tracking the beacon if there are any residual errors in pitch and roll the beacon positions will describe a donut shape on the seabed as you can see in the little animation that's playing now now
it's important to think about how big this donut is obviously if it's very large that indicates that there's a large error if it's very small and indeed the the radius is within the 1d rms value then it's probably to be expected so if we plot that on a chart in this first example you can see we had a water depth of 1700 meters uh the beacon position described a doughnut shape of roughly 20 meters this is indicating there's a problem in this instance we would need to recalibrate the system after another calibration the same the
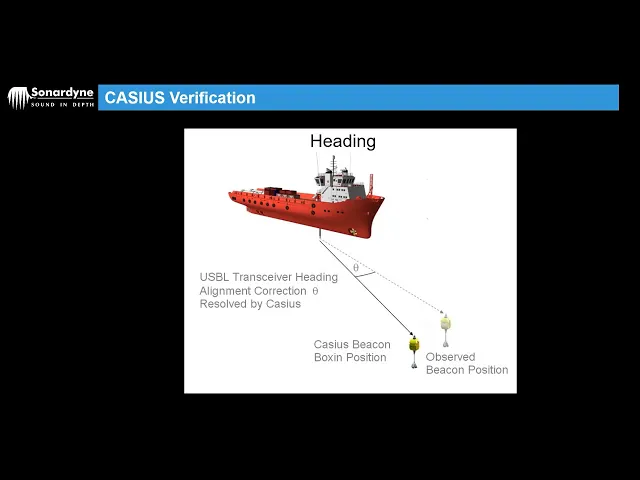
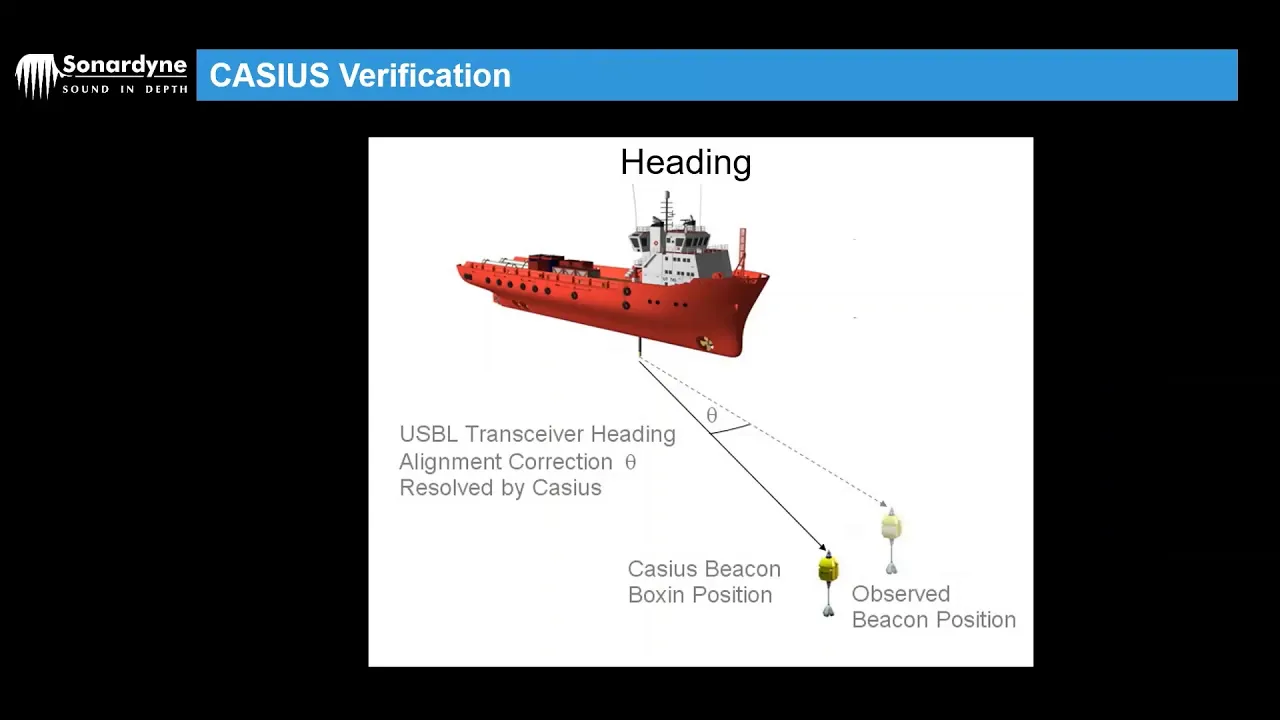
same vessel there's no doughnut shape and the data spread was roughly two and a half meters perfect so next we need to account for any residual heading errors and these manifest in a slightly different way um and that as the vessel sails away from the beacon you will get horizontal movement in your position fixes this is because any heading misalignment basically makes a very a very acute right angled triangle and as the vessel moves along the distance at the right angled end of the triangle is obviously going to increase so we have discussed why we
perform a cassius the instruments that are required to perform a cassius we've looked at methods of data collection we've touched on the processing in qc of the cassius and we've also looked at those verification checks at the end so hopefully that by now you should understand when and why we perform a cassius and how we perform the cassius and verify its quality if you've got any questions feel free to give us an email or you can just ask them during the practical session thanks for listening you