this is a Christmas tree it's also an indicator that you can add to your charts to give your trading that holiday theme despite its unique and creative look the tree is actually a super powerful Trend and momentum indicator and in this video we're going to explore exactly how this indicator works and how you can use it in your trading to filter out false signals and to identify the trend of the market if you happen to find Value in this video remember to leave a like let's get into it now to get started with this indicator
you want go to trading View and then open any trading security that you like in any time frame for me I'm going to be using the 1hour time frame of jbp USD next you want to click on indicators and type in Christmas toolkit and you want to select this one by Lux algo so what exactly is the Christmas tokit well it's a festive yet functional indicator designed to add a holiday themed visualization to your trading the toolkit incorporates a Christmas tree with decorative elements each representing specific market conditions and Technical indicators here's a detailed breakdown
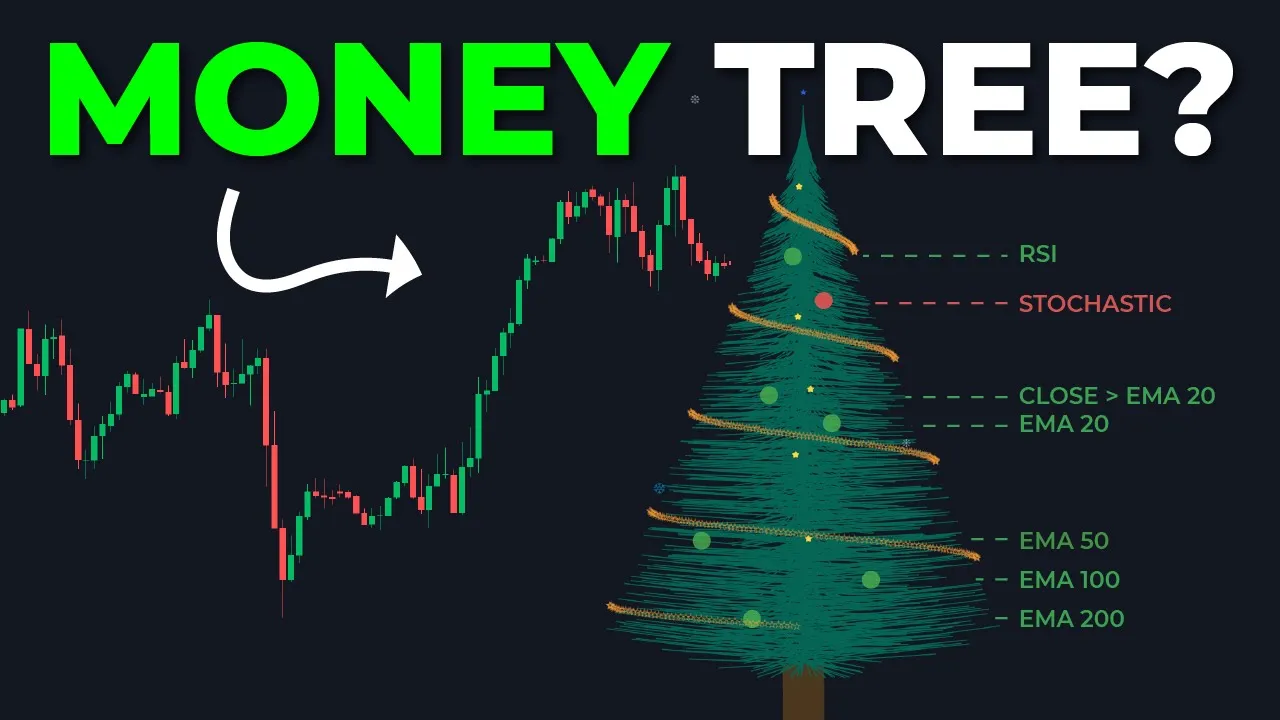
as you can see this is our Christmas tree which serves as the central visual with decorations like Christmas balls stars and even a moving reindeer to make it more interactive and fun each element of the tree corresponds to a technical indicator and displays its conditions through colors if you look closely at the tree you can see we have seven different balls that actually represent seven different indicators now starting from the top you can see we have the first ball which represents the RSI indicator and then we have a ball for the stochastic indicator and then
we have one ball for the relationship between the close price and a 20 period EMA next there are balls for the 20 EMA the 50 EMA the 100 EMA and the 200 EMA now you may be thinking but how do these balls work like how can you use them in your trading first of all let's define what the different colors actually mean lime means the market is very bullish green means bullish blue means neutral or ranging Market red means bearish and dark red means very bearish now for the RSI ball if the RSI is under
the 20 Level the ball is going to be colored lime if it's under 30 it's green above 70 it's red above 80 it's dark red if the RSI value is in between 30 and 70 the ball is going to be colored blue to indicate that the market is ranging now the stochastic ball is similar to the r ball under 20 the ball is going to be colored lime under 30 and it's going to be green above 70 it's going to be red above 80 it's dark red and then between 30 and 70 it's going to
be blue now for the ball showing the relationship between the close price and the 20 period EMA if the close price is above the 20 EMA the ball is going to be colored green but if it's below the ball will be red now for each of these EMA balls you know the 20 EMA the 50 the 100 and the 200 EMA if the EMA is rising the ball is going to be green but if the EMA is falling then the ball is going to be red for a bullish Trend you'd want all these EMA balls
to be green if they're all red that would indicate a bearish trend now it's important to remember that each element is associated with points for instance with the RSI if it's under 20 that gives two points under 30 gives one point above 70 gives minus one point and above 80 gives you minus 2 points the stochastic indicator also assigns points similarly and then for the close price versus the 20 EMA it gives you one point if it's above and a minus one point if the close price is below the EMA and then each of these
EMAs you know the 20 the 50 the 100 the 200 they also contribute points depending on whether it's rising or falling when you sum these points this star up at the top is going to change color to indicate the overall momentum of the market above six points is lime exact play six is green zero is blue minus 6 is red and less than minus 6 is dark red however I don't recommend using the star scolar alone when trading because it includes the RSI and the stochastic indicator which can actually give contrary signals in a strong
Trend when the market is strongly bullish for example the RSI often appears overbought suggesting a sell giving you a sell bias which contradicts the trend I think it might have been better not to include these oscillators in the total points calculation I suggest splitting your strategy into two you know use the RSI and the stochastic as contrarian signals and rely on the EMAs for Trend following there is also a last switch Dot and a series of historical dots that help you see previous sentiment changes we also have a reindeer and snowflakes the settings for this
can actually be adjusted now if you leave the chart for a while you'll see the reindeer move and it's actually moving from left to right coming towards the most recent or the latest candle and then the snowflakes also change randomly over time now going back into the settings we can actually change the width of this tree if I reduce this to 100 you can see the Christmas tree is now narrower but if I go with a larger number the tree is now wider I'm going to go with a default value of 200 the offset is
the distance of the tree from the chart so if you want it closer you can use a smaller value for me I'm going to change this to 50 the Gand rotations setting which is initially set to five defines the number of rotations of this Garland around the tree by changing this to different values we're able to change how many rotations the Garland has been applied the Garland is actually this decorative element going round and round the Christmas tree so let's try changing the Garland rotation to 20 this is how it looks if we try 50
it changes again if we go with 100 this is how it looks what happens if we go with 500 oh the Garland may actually disappear I think I'm going to stick with 50 rotations if we disable the static tree option the trees's needles which are these tiny green spikes will stop changing Styles and density over time and then here we can change the deer speed it has a maximum value of 10 I think I'm going to go with 10 after you've made your changes click okay now how can we use this indicator to trade well
the first strategy is Trend following using these five EMA balls now let's say you have a strategy and you want to use this indicator to filter out false signals using Trend if you have a buy signal from another indicator like the twin range filter by Colin mck and maybe you also have an extra Confluence such as a retest of a support level you can use the Christmas tree as a trend filter now to confirm a bullish Trend you want to ensure that the five EMA bows are all colored green and also that the series of
stars below the tree are green once you have this it means that this entry is happening within a bullish Trend you take your long [Music] position and the trade was profitable now for a sell trade if you have a sell signal and the price just retested a previous resistance level you'd want to find five EMA balls to be red and the series of stars down here to also be red indicating a bearish trend and then you take your short [Music] position the second method of trading with this indicator is going to be a contrarian approach
using the RSI and the stochastic indicators for example if the market is overbought indicated by the first two dots the RSI and the stochastic balls being dark red or just red you can wait for a short signal from the Twin range filter once you have the short signal you take your short position and of course for a long position you just do the opposite now remember these are not complete strategies they're just examples of how you can incorporate the Christmas tree into your trading you may want to add more confluences such as price action or
Market structure to form a robust strategy as you can see this is an indicator but it's also a Christmas tree it can bring a festive mood to your trading and if you want to use it you can find it on trading view that's been it for this video I really hope you found some value if you did remember to leave a like or even consider subscribing to stay tuned thanks for watching see you next time

![This NEW Indicator So POWERFUL, It Feels like MAGIC! [Exact Buy/Sell Signal]](https://img.youtube.com/vi/TWuQKscG-jY/maxresdefault.jpg)