in this video I'm going to be talking about Market maker buy and Market maker sell models this is what you can expect to see we're going to be talking about engineered liquidity smart money reversals smt Divergence standard deviation understanding fractal price and then of course how to actually trade this model this video could be charged for hundreds if not thousands of dollars in some mentorship I'm going to give this to you absolutely free because I care about sharing this knowledge sharing my experiences and helping others through I Concepts and through these types of videos so
before we get into it I just hope you guys enjoy the video if you do make sure to leave a like subscribe and uh it would mean a lot to me so let's Jump Right In now the first thing that I want to talk about and what I want you guys to understand in this video is the three reasons why markets move every single time that I'm trading I have these three things in mind it needs to be burned into your brain and every single trade that you take or idea or bias that you have
needs to have one of these these three things as a factor in it number one markets move to hunt liquidity buy side and sell side number two markets move to rebalance to inefficiencies which are fair value gaps and number three rebalancing to equilibrium so these are the three things of reasons why markets move we are constantly doing this every second of every day that market is open we are doing one of these three things either hunting liquidity rebalancing to an inefficiency or rebalancing the equilibrium okay so these are the first things that I want to
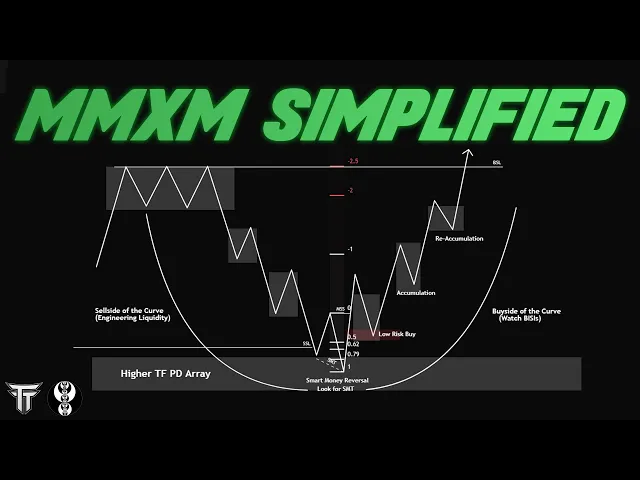
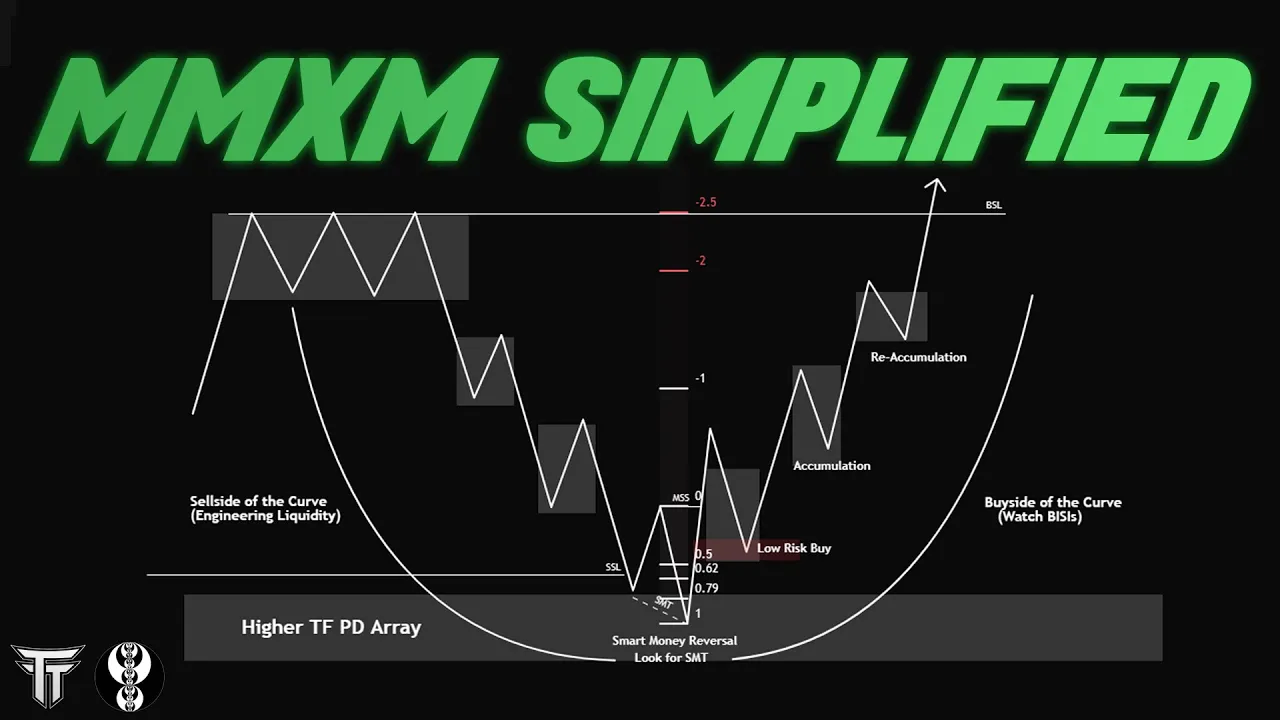
talk about because this is going to be the foundation of why we think the market goes to where it's going to go and it gives us a good understanding of why the market model actually works so what we're looking at here is a market maker by model you can see on the left here this is what we would call the original consolidation the original consolidation ends up starting here before we slowly start to sell off which this becomes again sells side of the curve where liquidity starts to be engineered we start to slowly sell off
before putting in a swing high before making one more low low swing high and finally coming into taking out a form of sell side here and bouncing into a higher time frame PD array so that is very important we're coming down to sweep sell side we're coming down to bounce off the higher time frame pdra now what we're looking for here is what we call a smart money reversal this is where institutions are now loading up their positions we they know that longs have now been stopped out again sell side has been taken liquidity has
now been per Ed and this is where we're looking for a smart money reversal which is an smt so when we come down into a higher time frame for Value Gap after sell side or buy side of the curve has finished we've taken sell side we're bouncing off of a bigger time frame in Balance this is where we are looking for a smart money reversal which is an smt at the lows and finally getting displacement back inside of the range right this is where we look for displacement back up a market structure shift and some
sort of pullback into a fair value Gap now at this point in time I am looking for a fair value Gap if there is not a fair value Gap it is automatically lower probability and the reason for that is I am looking for displacement now displacement equals a fair value Gap a fair value Gap is created when Market is displacing displacement is what I consider is a I want to see a volatile move a quick move back into the range where we get displacement above this swing High I don't want to see it just a
little poke above I want to see a nice move and follow through Above This previous High now going back to the sell side of the curve here why is it that we are actually doing this number one what are going back to the three reasons we talk about why are we even selling off in the first place number one to hunt liquidity we're reselling down to go back to hunt some form of sell stad liquidity we're also rebalancing to an inefficiency which is the bigger time frame High higher time frame pdra or and potentially we
could be also rebalancing to a bigger time frame equilibrium which could be again if I was going to draw out a range could be something like this from a recent low that we had down here which now we are rebalancing to equilibrium of that range before continuing higher now once we have the smartphon reversal what is engineering liquidity well on our way down you notice that we put in these swing highs this is engineered liquidity notice how most of the time when we are having a move lower there are times when we will have a
high or some form of high being taken before going lower but a lot of the times we will leave a lot of Swing highs we can see that we left one here this now becomes a form of buy side another one here the whole process on our way to the downside is we are constantly engineering buy side liquidity so on our way up all of that buy side liquidity gets ran through again this is known as a low resistance liquidity run when we have all of these highs inside of the range this becomes low resistance
liquidity meaning we should not come up to this high and immediately sell back off we should should not come up here sell off until the external draw or the external buy side level is then taken right and notice previously from the original consolidation we actually ended up creating equal highs here now a lot of the time you will not get super clean equal highs like in this example this is just an example but most of the time we will have an original consolidation which will act as that buy side level that we would want to
see and sometimes there's not an original consolidation it's just the buy side level from the initial move higher now this is the the basic understanding of what we would want us look for so now let's go into a little particular things again if you don't understand what an smt is we'll go over that real quick as well so an smt is a Divergence between indices when we're looking for a smart money reversal and recognizing when the start of buy side of the curve when the start of sell out of the curve one of the biggest
and best understandings of when that is is if we get some form of smt now in this example you can see es is ending up making a lower low while NQ makes a higher low and and ym also makes a higher low right so we could talk about the e- mini the NASDAQ and the Dow when es ends up selling off creating a lower low this it creates an smt Divergence right the Divergence between indices because es is making a lower low while NQ and ym make a higher low this is a bullish Divergence a
bearish Divergence would be the opposite of this which would be at the highs es or NQ or ym it doesn't matter which one one of the indices is creating a higher high while the others are creating a low low or high this is what we want to see when we are looking for some form of Divergence in the market so let's jump into some examples of a model so the first example we're actually going to look at is on a smaller time frame and the reason you might ask why Justin are you doing this is
because this model is everything in the market this is the market every that you see in this video I my goal is for you to understand not only the model but the fractal aspect of this model so number one going into the first example here this was actually today um so just example I'm not going back in price this was literally today that this happened and we'll go over this and I actually live streamed this this trade um and told everybody that this would this is your lowrisk bu here um but what are we looking
for here what what can we understand just by looking at this chart number one this is on a one minute time frame when people like to think of a market maker Buy sell model most of the time they're thinking bigger time frame 15 minute 4 Hour 1 hour whatever it is this is a one minute time frame and I wanted to start here because we're going to move our way up and build to understand fractal the fractal aspect of the market so you can see we end up having the initial move higher we end up
creating that buy side notice on our way down once we're again wire Market's moving once we're selling off to rebalance to the inefficiency once we sell off to rebalance back to equilibrium of the initial range right we end up generating an engineering buy side liquidity from this initial High here from this initial High here we end up creating an engineering buy side liquidity now zooming in actually we'll stick for here for now notice we end up having that final smart money reversal that we're looking for again if I am looking to understand which is buy
side and sell side of the curve which we can now here understand from here once we've now seen it fully but when I'm actually in the moment and I'm looking for this what am I looking for to understand what is buy set of the curve what is sell set of the curve what is the best thing that I want to see happen number one like we talked about earlier an smt Divergence I want to see one L last manipulation move lower before having displacement back up inside the range and then look looking for some sort
of fair value Gap so number one reasons for the Market's moving we are Distributing back to the inefficiency we're Distributing back to equilibrium and now we're generating sell-side or buy side liquidity we have the manipulation at the lows again smart money reversal smt smart money starts to load it up we end up getting displacement up now the next imbalance is your potential long opportunity this is where you're looking to enter long targeting that buy side again expecting all of this to become low resistance liquidity run if I zoom in you can see the nice displacement
we end up creating from the lows smart money starts to load their positions you get the nice one minute for your volue gap before again rebalancing to the inefficiency which is this is where would you where you would enter your position before having that move up having one last move down rebalancing to the inefficiency before having that last move to go take out that buy side level right so again this is a 15-second time frame and I'm on also a 1 minute time frame the model that you will be looking for will appear on every
single time frame that you look for if you can understand the fract ability of it now the goal with this video as well is the highest probable understanding and the highest probable trades that you will take with using these models is when you have a good understanding of the draw on liquidity not just understanding of what the internal draw but the external draw knowing at this specific model right just looking at if we were to go back at this point in time the draw on liquidity for me is buy side right but that's it I
don't know anything other than this because I'm on a 15sec I'm on a one minute and not you might say Justin why is it important for me to understand you know what where the bigger time frame Market wants to go because the highest probability setups you will get is when the external bias can align with the internal bias the reason why this trade ends up working out so well is because markets have been very bullish recently the external draw is still higher there is a reason for us to go higher right same thing if I'm
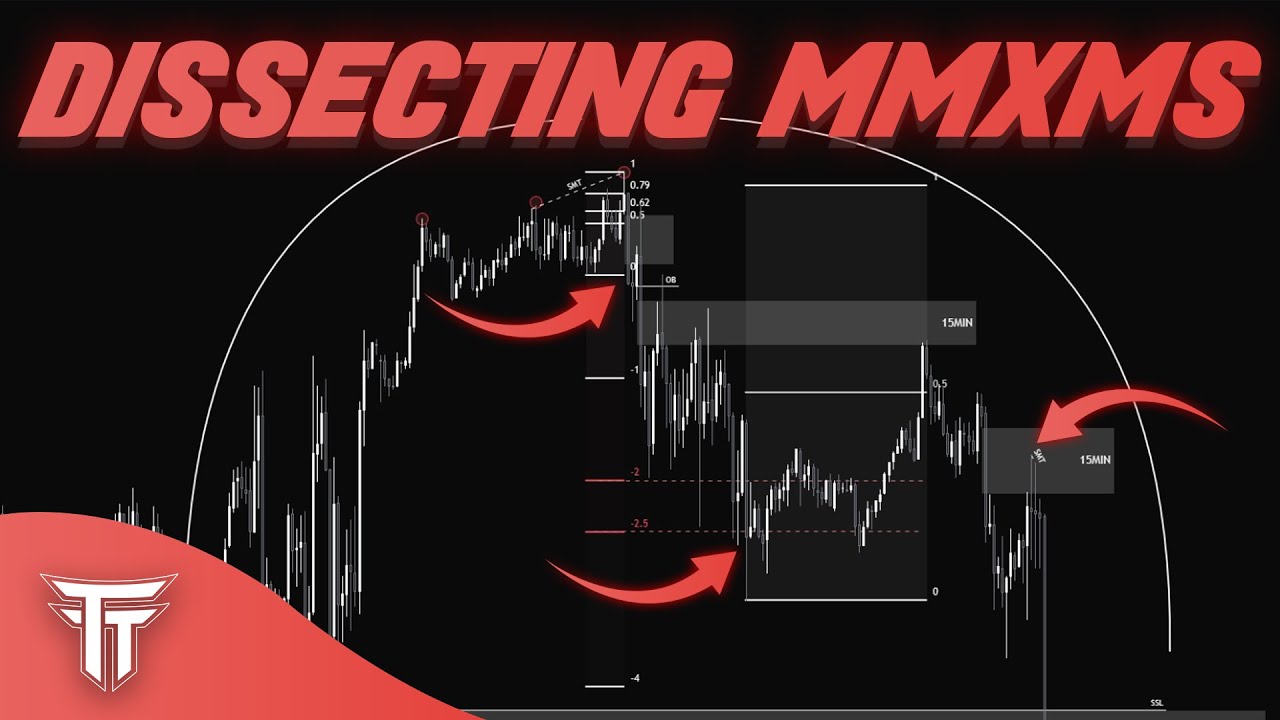
looking for a cell model if I'm looking for a cell model the highest probability for me to trade intraday 15 minute what 1 hour whatever it is is if the external draw is also lower okay that's the first thing I want to talk about this is the first example next example let's go into this is going again zooming out a little bit more and this is a specific example that gives us a little bit more understanding of what I mean by fractal now looking at this just this alone is what is what I want you
to pay attention to for now this you can see is sell side of the curve we have buy side of the curve you can see the engineered highs working our way up here and this is the buy side level you might be saying Justin why is this the buy side level why is this not the buy side level and why this is marked as buy side for the internal buy side is because if I zoom out to the 1 hour you can see that this is a nestled liquidity in a fair value Gap you can
see the high here is this fa value Gap and again if we go back to the three reasons of why markets move what is the reasoning our goal when trading a model should be the why why is why should this work why should I even put money on the line for this to work three reasons markets moved to hunt liquidity markets moved to rebalance to an inefficiency this is the first thing when we're looking at this this is liquidity because we automatically expect price to number one at least rebalance to this in efficiency and the
buy side level here is resting on a smaller time frame fair value gaps are liquidity on a smaller time frame liquidity is always resting Ing and most of the time resting in some sort of bigger time frame in Balance if you zoom in so going back to the 5 minute we get to understand this bigger the smaller you know Market maker model on a five minute now what I want to zoom out before we get into this is notice what we're looking at here when I zoom out you can see when I start to zoom
out we get a good picture of what we're looking at here now I could have traded this multiple different ways in many different Traders would have looked at this differently and and would have completely traded it a different way now let's just talk about this model for for a second sell side has been taken rejecting off of a bigger time frame imbalance displacement to the upside notice we're running this fair value Gap what do I expect this to become an inverse fair value Gap we come back to the inverse fair value Gap again where are
we also coming back to equilibrium of the range come back tap equilibrium tap the order block before having a move up higher now this is a market maker buy and sell model in on its own what is also a market maker buy and sell model if I zoom in here and I'll show you I actually I took this trade and right after I explained this I'll show you the recording but my first entry at this point in time was right here on this order block but I ended up adding to this position and I'll show
you why zooming into a one minute what does this look like to you what does this look like could it be are we engineering buy side liquidity on our way down before having a manipulation move at the low displacement to the upside a breaker a fair value Gap the market is fractal everything that you look at you can constantly zoom out constantly zoom in zoom in models inside of models this is another Market maker sell and Market maker buy model again we come back down redistributing back to the bigger time frame imbalance back to the
bigger time frame PD array back to equilibrium of the previous range now why is this such a higher probability entry because it aligns with the bigger time frame model it is a model inside of a model so I take my initial entry on the bigger time frame model which is right here on the order block I zoom in and then recognize the intraday smaller time frame model inside of the already existing model so this becomes my first entry where do you think I add on this once I see the smart money reversal here we hold
up smt displacement above that high we now have a breaker this is where I take my second entry but where am I targeting with this trade where do my target whatever the model is telling me I should Target which is the internal draw engineered buy side liquidity on our way down this becomes the draw liquidity here which also again this becomes internal buy side but this becomes the engineered liquidity from this initial buy model right so the more that you start to look at the market in this kind of aspect the more precise you will
become Precision comes from under understanding fracability in the market when you see people on Twitter when you see people on YouTube having good trades and you're like how like how can you be this precise this is the reasoning why it is fractal systems when you are looking at a model you can always zoom in more to find the another model inside of that model and then find that model inside of that model and have the most precise entries you could possibly have so look at this for a second screenshot it if you want now what
I also want to go over to is what makes this so good what makes this trade so good what makes this chart so good is because every time frame that I look at a model it is in favor of the exact same bias when I zoom in here it's bullish when I zoom out this model is bullish when I zoom out even more this model's bullish why is this model bullish we just ended up sweeping sell side we're bouncing off the bigger time frame in balance and we have generated buy side above we have buy
side liquidity here we have generated buy side liquidity here this entire move up all of these intermediate term highs becomes generated biased liquidity for another bigger time frame model for us to then break through this imbalance after taking sell side again why did we even have this move in the first place to rebalance to the bigger time frame for Value Gap to rebalance the equilibrium of the range why do you think that is this is why markets move let's go to the next the next example here oh here this is the recording right right so
again I took my initial entry on the order block took my second entry on the breaker noticing again recognizing the internal model as well scaled out in the fair value Gap scaled out on the initial high as well looking for a break above and then of course risk management most important thing my rest of my contracts got stopped at uh in profit for my for my um my trailing stop let's look at another example now again changing time frames completely 4H hour now we're going to a 4H hour fair value Gap here right so when
I'm looking at a model I'm looking to understand a bias right especially as an intraday Trader and somebody who trades intraday I am not going to trade this 4 hour I'm not going to be like oh my God this is a market maker buy model let me buy Longs in this 4 hour for Value Gap and put it down here I could do that if I wanted to it's just not how I trade I don't like swinging positions I like Trading intraday what I will use is I will use the 4our or the bigger time
frame model to give me my intraday bias to then zoom in and find the exact same model right number one what what makes this a bu model we have engineered buy side above on our way back down what am I looking for price to rebalance to the bigger time frame for Value Gap we have a bigger time frame for Value gap down here we have generated cell side below notice all of the Stacked lows here generated cell side before we finally end up selling through taking out all of these lows to then go to the
external low here again all of this generated cell side becomes low resistance liquidity run we take all of it at the same time with this move down here once this external cell side level is now taken what am I looking to see what am I watching to see happen I'm watching to see a smart money reversal what's the first thing I'm looking for possible smt and then displacement back inside of the range now how are there multiple ways that I can trade this number one it depends where we are in the chart if I am
looking at this time frame and I go back to the very beginning of when this entire thing started this becomes soup on a bigger time frame right we have smt we have liquidity taken we have bigger time frame in Balance being respected once we get displacement off of this fair value Gap I can immediately go down to a smaller time frame to trade this what becomes my drawn liquidity now if price is all fractal what becomes my drawn liquidity whatever the recent high is now that we have sell side swept smt at the lows this
now becomes my break of structure to the upside this 1 hour fair value Gap has now been ran through drawn liquidity gets taken and this becomes now our displacement to the upside so now this buy side level is an internal buy side level but what does this also become this becomes my market structure shift on a bigger time frame because this is the first swing high that is now being displaced through after cells side has been taken right notice on the way down here as well what are we doing what are we what are we
doing on our way back down here we're engineering buy side liquidity all of these intermediate term highs that have yet to be taken on our way back down to Southside right so now we continue price zooming back out to the 4 Hour we end up coming back down sorry let me clean this up a little bit here we end up coming back down to this imbalance right once we bounce off of this off the inverse for Value Gap I'm looking for displacement again recognizing the bigger time frame model once this ends up getting bought up
this is when I can again zoom into a smaller time frame look for a possible setup here if there is not a possible setup then I am looking to see the next opportunity so if my bias is bullish here I have a recognition of the bigger time frame model right recognition of the bigger time frame model let me take just try to clean clean up a little bit here smt at the lows Market structure shift pulled back to where do you think discount also where do you think we're pulling back to the bigger time frame
and efficiency right I'm hoping you guys are starting to catch along here why why Market's moving here right we get displacement backup out of this what am I expecting to see draw is higher I'm expecting all of these imbalances to get ran through to the left of us because again it's not in favor of the draw so if I am looking at this chart right now and if I'm going into the day what becomes my draw liquidity this recent High becomes my draw liquidity this now becomes my buy side so what how could I trade
this I zoom in what am I looking for now so I zoom in I have my idea of what the draw liquidity is understanding the bigger time frame buy model now what am I looking for another fair value Gap we now have another 1 hour fair value Gap here that's where I would looking to be possibly take an entry we never end up coming back to it though but this is where I would looking to be to find that model what would I be looking for Market to come in smt at the low displacement trade
the internal buy model here targeting the external draw okay but we never end up coming back to it we just end up going straight down straight up I don't touch it here okay the bigger time frame model is still playing out at this point in time we understand we recognize that this is most likely going to be the buy model we end up coming back down again we to equilibrium of the previous range where to back to the inefficiency this is when I zoom back into price what does this now become engineered buy side liquidity
this now becomes a internal sell and buy model this becomes our buy side what are we leaving behind engineered buy side all of these inter internal high when I zoom in this now becomes sell side of the curve and buy side of the curve why the bigger time frame draw is higher we've rebalanced the inefficiency we're getting displacement back to the UPS side you can zoom in even more look for possible entry we can have a breaker here we have a fair value Gap what do you think price is going to do here run right
to buy side unicorn entry fair value Gap Breaker by side of the curve a model inside of a model when you have an understanding of the bigger time frame draw in liquidity when you can recognize the bigger time frame model it gives you an opportunity to zoom in and look for the same exact thing with more conviction there is a reason for it when I get to zoom down at this lower time frame and I'm looking to take an entry in this breaker we've now done everything we needed to do come down rebalance to the
inefficiency displacement up right Market structure shift to the upside and I'm looking for buy side the bigger time frame already is going here we know the bigger time frame we have conviction we're already going to this High what is going to give me the timing for us to do that the internal model the internal model all of this G again everything you look at everything you look at if I zoom if I zoom in even more this becomes its own model model all of this engineered b side before having a move up towards the external
draw before having another move up towards the external draw right so let's continue in price what what happens next year we're continuing this buy model respecting bullish imbalan is disrespecting cies we have another bullish imbalance we end up coming to here what's another way I can trade this Justin well I have a good understanding of what the bigger time frame draw is bigger time frame draw is still up here we're trying to finish buy set of the curve we have all of this engineered buy set liquidity this becomes low resistance liquidity run I'm looking for
this imbalance to hold bullish how am I looking to possibly trade this let me zoom in here let me see if we can possibly have a model model that we would be looking for what am I looking for to take a trade here I am in a bigger time frame imbalance the draw on liquidity is higher we are in a bigger time frame Market maker buy model what am I looking for to take a trade intraday though the exact same thing I'm looking for manipulation I'm waiting I'm waiting I'm waiting I'm waiting boom We engineer
all of these again if I was to zoom in even more this would be your buy side of the curve this would be your sell side of the curve another way you could possibly trade this you know we need a manipulation move to go back higher so when I zoom in here what does this now become its own model rejection of a bigger time frame imbalance this now becomes a market maker sell model zooming in to the one minute or the five minute sorry let me take away this red is kind of distracting rejection of
the bigger time frame imbalance buy side swept displacement back inside the range pull back to a fair value Gap cell model all the way back down to what all of this engineered cell side liquidity all of these lows that are left below which become what low resistance liquidity run before having finally the manipulation move lower before having the buy side of the curve higher before having the buy side of the move higher on the bigger time frame by model models inside of models inside of models this is the market if once you start to think
and you start to see the market in this way you will understand where Market wants to go why Market wants to go there right why markets moving hunt liquidity rebounds to inefficiencies rebounce to equilibrium everything that you see everything that you trade needs to be focused on that now we've now had our manipulation move zooming back out what am I looking for here let me let me draw back in this imbalance what am I looking for now right displacement up waiting waiting waiting waiting waiting boom We Now get what we want we have our manipulation
move at the low we get displacement up what am I now looking for a pull back to a fair value Gap pulls back to the fair value Gap as well as the order block right here take a look at this why why why why why does it why would this work think about it what are the things that we've been talking about this entire video number one why are markets moving hunt liquidity rebalance inefficiencies rebalance the equilibrium what have we been doing here number one bigger time frame we've rebalanced the inefficiency number two we've rebalanced
the equilibrium of this entire previous range that we've had number three we've now had a market maker reversal right we had a smart money reversal smt generated sell side liquidity we had a fake move higher before selling back off rejecting the internal fair value Gap right why are we moving higher rebalancing to the inefficiency before having the move back back lower when we have a market maker sell model here displacement to the upside after having a manipulation move here I'm actually not sure if there was a smt here there might have been was there where
where was uh this we'll see if there was on ym or ES I'm actually not sure I should have probably checked before not on ym maybe on ES oh oh oh we had no SM there so we have this last manipulation move lower sell side gets taken again notice the lack of displacement the lack of displacement below here no follow through immediately displacement back to the upside pull back to where equilibrium of the range back to the fair value Gap to then finally get bought up and continue the internal b side of the Curve which
in in turn is the move that we were already expecting on the bigger time frame why because we're in a bigger time frame Market maker bu model the whole point of what I want you guys to get out of this video is understanding fractal markets when I look at a model when I am looking at anything in the market the first thing that I'm focusing on is does it align with the three reasons why markets move number two does it align with the bigger time frame model if the bigger time frame model is not recognizable
it is automatically lower market conditions and I lower my size if the bigger time frame model is unrecognizable it is unfavorable market conditions and I lower my size that is key because if I don't have confidence in where the external draw is it lowers the quality of my setups on an internal time frame because it gives me there's there's less reason for the market to go there right when the reason why these internal models work the reason why this works is because we already know the market is going higher on a bigger time frame this
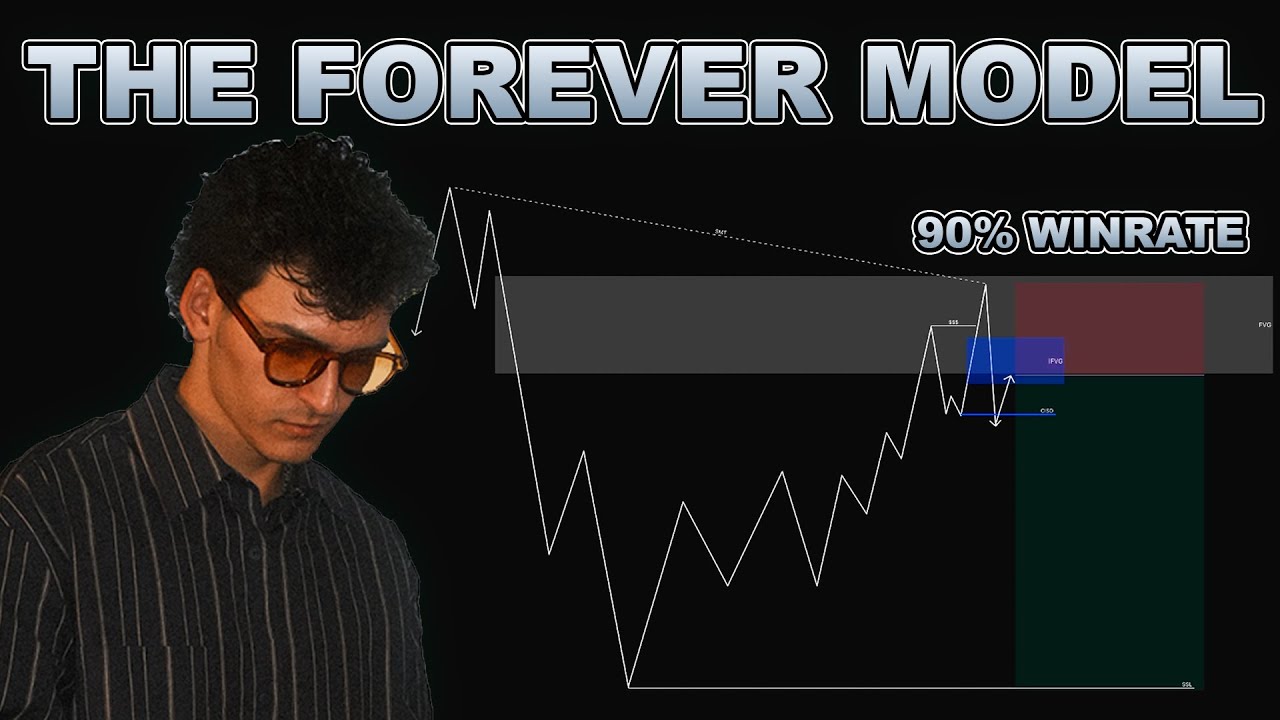
is a model that's been playing out and it's already exactly what we would look for a pullback to a bigger time frame for Value gu wait for manipulation wait for distribution this is exactly what we're looking for when we are looking to see some form of a buy model recognize the bigger model so now going into another example here now this is not an example but I want to to show you guys what again the exact same thing but a market maker sell model right exactly what we would be looking for for a market maker
sell model the exact same thing we have a original consolidation move higher again creating these swing lows before finally taking out some form of buy side liquidity or rejecting off of a higher time frame pdra this is when we are looking for a smart money reversal we are looking for an smt smt here at the highs we get displacement back inside the range pull back to a fair value gap before continuing lower not I have a drawing here this is how I would trade this model again it depends on the time frame if I am
looking at a 4 hour or a 1 hour or a 15 minute or a 5 minute whatever it is the way that I want to get a precise entry is by trading the internal model inside of an already existing model so I'm looking for pull back to a bigger time frame in efficiency pull back to equilibrium of whatever the the previous leg move was on a bigger time frame some form of internal buide swept displacement to the downside and then take whatever the internal draw or whatever the internal model is fair value Gap this is
buy side cell side of the curve targeting internal cell side leaving my Runner right everything that you look at is going to be fractal every single Square in this has an internal model every Square in here is this on a smaller time frame this whole thing you're looking at is basically this this this this this this this everything if you can recognize it and sometimes it's not as clean as this might be but it's there so last thing forgot to go over this the last thing that you could Implement which is not as important as
just understanding the model but recognizing standard deviation standard deviation is something I use a lot and it makes me recognize the projections or the by side that I should most likely be targeting now when I'm looking for manipulation I am looking for a area that I can use standard deviation and I can only use standard deviation if the manipulation leg is clear to me now you might be asking Justin what is the manipulation leg here this is the manipulation it's the last leg lower or higher depending if we're in a bi model and if if
we're in a bi model is the last leg lower before switching Trends right before starting B set of the curve so I would draw in my standard deviation from the high or from the low to the high and then this gives me my projected targets and most of the time whenever you are using standard deviation and can recognize whatever the manipulation move is 2 to 2.5 will always most of the time line up with that buy side level and that is going to be your target so hopefully you guys enjoyed this video if you did
please leave a like subscribe it would mean a lot to me um I would love to see what you guys have to say in the comments if you disagree with me or if you you know found this helpful I would love to see the ways in which you found this helpful um the whole goal is this video is to just try to brain dump my the way that I view the market the way that I think that everybody should view the market in the most logical way possible so if you did enjoy this video again
like subscribe um I live trade every single morning in my Discord um the link to that will be in the bio as well we currently are doing a Christmas and New Year sale that sale and this Friday so if you've been wanting to join a really awesome ICT Community we live trade every single morning talk about my thought process and we also do charting sessions every single night as well going over those trades so hopefully you enjoy this video if you did I I said that already three times so enjoy the rest of your day
guys I will see you in the next one peace