Oh you you [Music] okay folks we are in the second part of the ICT scout sniper field training guide and this episode is going to be dealing with boot camp okay now what are we covering in this presentation well first we're gonna be reviewing the previous episodes assignment the mark We're referring to time of day and the effects that has on price we're gonna be looking at the day of the week and again it's influence over price we're gonna be covering institutional orders and pairing of orders we're going to be briefly introducing the market makers
business model I'm gonna be looking at characteristics of a price swing specifically dealing with time price and melding the two with support and resistance we're going to discuss price Fractals and their role in analysis and we're going to give you another homework assignment price reactions okay we are looking at a daily screen capture of the euro USD pair and this is a daily chart again it's specifically highlighting a swing in price that we're going to be dealing with it's going to be in the latter stages of this price swing but it's not imperative you understand
what caused that that swing lower at this juncture because we will Cover in greater detail all of these types of moves and how we can fare at that type of price action out in later episodes in this series but for now we're going to be dealing specifically with the fiber in this pair how we can look for turning points and how we can anticipate certain characteristics and price actions that repeat over and over and over again and I promise you when you are finished watching this episode you're gonna have a far greater Understanding of what
price action is like and how you can use it going forward in the new week of forex trading okay if you remember the last episode I gave you some homework regarding the first week of July of 2013 now if you're watching this video and it's a number of years old I apologize that you got to the party too late but that's not my fault now is it but we're gonna go over some some details here so that we can at least digest the the main focal points And how you can use it going forward these
are very generic concepts they do not fall out of favor they're not a fad gimmick indicator these are our essential core tenants to price action and I promise you if you apply these things not only just to the the fiber pair but if you look at the cable and all the other majors and the exotics as well you'll see these reoccurring themes that take place over and over again in price action now the screen capture We're looking at here is a 15-minute basis and we're going to digest a lot of information just in this small
sample size of price data but let's look at the second portion of study we gave as part of your assignment in the previous episode now we're looking at a price rally okay and in this price swing we're going to be breaking this specific price swing down and how we can utilize generic concepts that go along with every facet Of smart money trading now again this is a 15 minute time frame but we're going to be applying smart money concepts to this time frame that are based on a higher time frame which is where the institutional
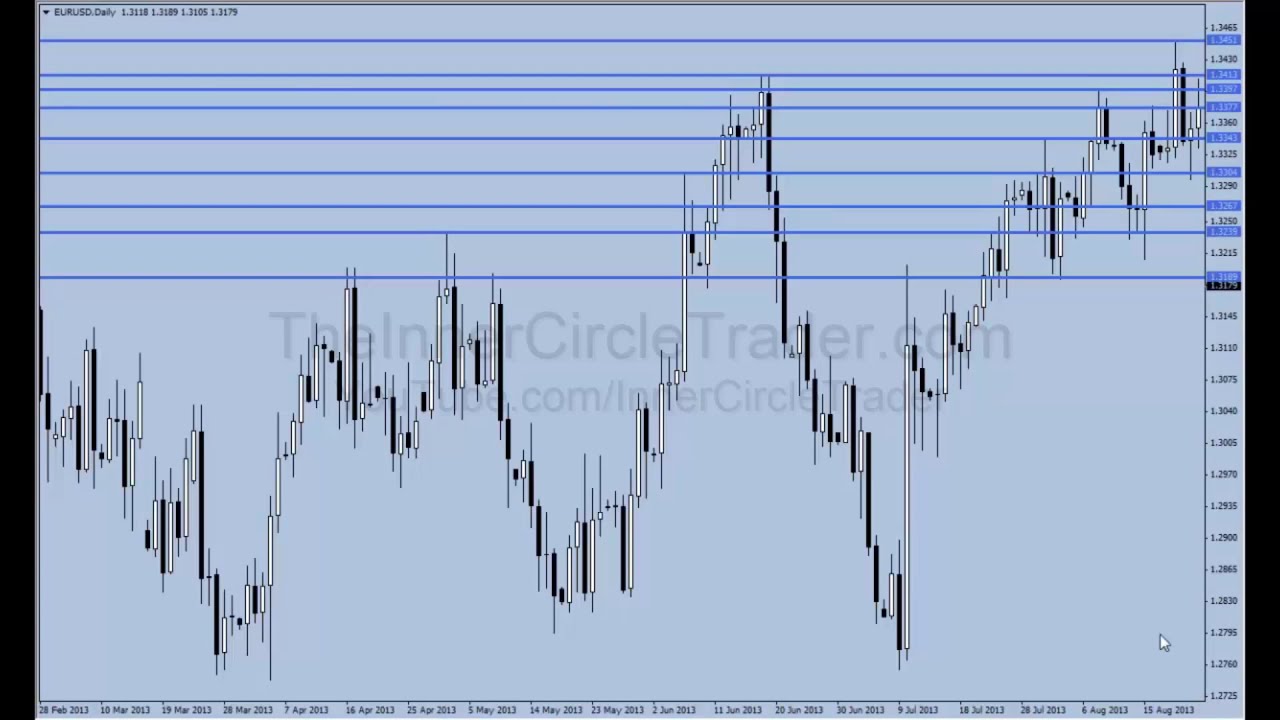
level traders and banking traders do the majority of their analysis okay folks we are looking at the fiber euro USD is the daily chart and this is the top or the highest point of the price swing that we're going to be Analyzing and our first sample size of price action but I want you to keep your eye on what takes place in price and this price starts to slide down you'll start to see a pause in price action here and you see this is the first bullish candle and this down leg now if you look
to the left over here you'll see a small little consolidation in here and you keep going over to the left you'll see some old highs a consolidation with some highs and bodies Of candles a short-term high here and a turning point here and turning-point here prior to that big leg up in price here okay this was the lowest low as price rallied up it made a high here as well and then started to move lower in a very large price swing it came down to a previous level of support now the reason why I have
this level here is if you look at the body and wicks of all the candles in here you have the below the wick here the wick essentially in here The top of this candles wick this wick here just staff there just a little bit again same here the bodies of the candles here okay and if you look at really essentially it's the one twenty seven seventy level and then price going to come down to that same price point again the body of the candle stopped here granted the wick of the candle trade through it just
a little bit then we had the body of the candle here as well with a small little wick as well The body of the candle here comes right down to that same level rallies in trades raithra one more and then starts to rally off-price comes back down makes this smaller short-term swing lower okay and I'm promised I'm taking you somewhere I'm just going over the major price reactions and levels that you would be hunting in your future and they also send your demo account trading as you develop as a trader when price bounced off this
level came right Back down to the same point or consolidation in here and surprise come down to that same price level notice we failed to get to that same old low or support level 127 70 price found a new level consolidated and moved out of that consolidation and started to trade higher now this price swing in here okay is the basis of this price rally here now as price starts to move lower we would be looking for areas where we would recently expect to see price to Stall price bounced here now just for illustrative purposes
let's just use the very low the wick here and as a double check the candle make sure I am indeed on the low the low is 130 58 and we're gonna move our level right to that point you can see this swing high remember we talked about in the first episode a swing high is a high that has a lower high on either side of it okay we have a nice level of support resistance in here same thing here nice Support resistance nice support resistance any support resistance again seen here okay we have a nice
swing high as well so this price point while it is an off even number and it could be very easily calibrated to 130 60 level okay which i think is a much more reasonable level to move this line to and what that means is that institutions like to use large round numbers they're not so finicky in terms of trying to get like the the eights and the fours and The threes and such in terms of filling they'll just use the round numbers to get their orders off on and I'm just gonna pee that in here
manually as you can see so I'm using one thirty sixty as a round number you see it gets right to a high here as well and again it doesn't really essentially change too much over here but when we get on to a smaller time frame it might be more useful to us as we see the levels more closely calibrated to a smaller round number now When price gives a bullish candle here this by itself indicates a lot of different things and this episode will not be on long enough to go into the information that these
types of candles create but I promise we're going to delve into those things in later episodes but for now we're going to be giving a lot of generic broad ideas about how smart money operates in the marketplace and how you can more less follow their coattails and try to Hopefully see a profitable swing in your favor now as price continues to move lower okay this same bullish candle okay when we cause this bounce in here something about this level at one thirty sixty was a catalyst okay now institutional level trading again revolves around round numbers
so a lot of questions I get through email and if I'm haunting a particular forum or such they will invariably ask me hey ICT can we get a little bit of understanding Of how it is you arrived what would be considered your key support resistance levels and what do you mean by institutional levels when you say price is going to come down to this institutional level or you expect to see particular levels swept okay I'm going to cover that in this module so that way you have a greater understanding is that way not only will
you understand my videos when I do reviews and in trade recaps what I'm Referring to but you're also gonna see how to look for it in your own charts and you understand what it is specifically that price actions are doing and why so price bounces here okay at an old swing high balances here now price trades through it but if price ever comes back at that same level that is a potential area of a setup okay so we could look for a selling opportunity should price get to that same level again in the future and
you can see Price trades right up to this level here the high this candle comes right in at one thirty fifty nine say we fell one pip short of the actual round number but you'll see when we go down to a smaller time frame it really doesn't make that much of a difference because there's a lot of other factors that will be more beneficial to us so now we have the next candle here it sweeps up through it and then trades lower and closes on the almost a low that the candle price Trades right back
up into a bullish candle here right into our one thirty sixty now the high again on this candle comes in at one thirty seventy three so we're thirteen pips off so again we're looking at a daily chart so if we're gonna be just off by thirteen pips and we're looking at daily ranges again these are all full daily bars that's not bad in terms of you know highlighting areas of potential setups or bounces and that's it's your your Framework is gonna build upon this because it's not about getting the weekly Hein writing only to Friday
or the weekly low right you know either Friday or getting the thousand pips a month we're trying to keep up with the next guy learning my concepts that is not what you're trying to do in the beginning what you're trying to do is build a fundamental base of price action and we're gonna build and expand on that each episode and I promise by the end of The eighth episode you're gonna have a wicked understanding of price action and you're going to be blowing your socks off and not only will you be impressing yourself as you
go and deep deeper study of price action but you're gonna start seeing by studying the other quote-unquote street money or less informed traders that invariably talk on forums or you see them even in you know so-called expert circles they really have no idea what you're talking about Okay so again really go through this video module a lot not just one sweep isn't going to do it you're going to be going through this a couple different times and there's a lot of things that's gonna go right over your head the first a few times but I
promise by taking notes yes taking those remember you just be having a notepad next to you as you watch these videos because when we discuss a specific topic you're gonna be wanting to know the details or specifics Around that concept so that we it's not that you have to go back to this video and see it or which video it was that specifically talked about this concept of that you'll know where to get the information from okay and how to apply it without spending too much time chasing after where it is in the fundamental concept
behind it all so again we have that 130 60 level in here okay this daily candle trades up into it squeeze through about 13 pips and then The next candle we have a very nice reaction here trading lower now again all we're looking at is how price is moving on the daily chart so as we see price moving lower we just keyed off of a nice price level here now as price is trading lower now where would be reasonably expect price to trade back down to if it continues at all because there's no guarantee that
price is going to continue lower but because we have seen price trade-offs Nice move lower we broke through old highs so now we're gonna be looking for old lows they are found here and if price trades through that where we go next these lows and if price was to trade through these where we would go next these lows okay and that's what you're looking for again a consistently highly successful trader does majority of his analysis on the higher time frames okay you don't have to spend so much time on Them off of the charts and
you don't to spend so much time on the weekly charts but it's advisable but certainly spend a lot of time on your daily your four-hour and one hour only if you can't really discern anything like right now if you need to be trading in a short time day trading you know that's when you spend a whole lot of time in your alley but really focus on your four-hour and daily because that's where the bank's the institutional level traders and the Smart guys like you're going to try to be in in a future by applying these
concepts you're gonna be spending the majority of time doing your analysis on these timeframes now it flies in the face of what you're commonly referred to as this is too slow well that's fine that's exactly what you want because you're gonna learn later on this and in this episode slow is good okay and one of the central tenants to understand what you should be doing as a trader is Understanding what traders are hopefully trying to capitalize on and that's price movement now I'll give you a quick question before we go any further can you as
a retail trader move the market no you can't can we as a group of retail traders move to market sure on a short-term basis but not very much and we're talking about a minor little blip in price action so who is it that moves price you can take price from these levels here all the way down here they Are the large dominant players or it's commonly referred to as the smart money saying entity takes price from these levels up to here and vice versa from this high down to the slow in this low to these
highs this high down to these lows so the question begs is this if you're not spending time trying to learn what it is that they do okay on a larger timeframes aren't you really shooting in the dark I mean you're really not giving yourself any real Measurable chance you're stacking the odds against yourself if you're looking at time frames less than 60 minutes all the time because there's no there's no neon sign jumping out on your chart saying okay this is the buy now you may believe that's the case but I can assure you that
is not how it works if you spend the time in the exercises that we're going to be covering in this episode really roll your sleeves up get yourself some time in front of the Charts and spend some study not looking for trades you want to be studying what price has done in the past why it's behave that way and I promise you will activate your reticular activating system where it basically tells you every time you see something that you've grown accustomed the scene your your brain will immediately allow that to come into your mind and
you'll receive it and you'll say okay the last time I saw this happened this is what Transpired as a later effect if you don't first train your mind to see what it is that price is done in the past and it repeats over and over and over again invariably you're gonna be a better trader because of it now I'm not saying better trader is consistently profitable that's nothing that I can promise but I can promise that you have a much greater grasp on what price action is doing so then you can start applying some concepts
even from your own repertoire Or your toolbox that will assist you in making trade decisions now again I'm not advocating you use real money learn to develop into the trader that you aspire to be with these ideas to stimulate your development again I don't want the credit for your success and want to credit for your losses either so please be responsible with the information I'm presenting with you in these modules because again I'm not acting as an advisor but I'm just Showing you the things that I do in my own trading and what I've done
for almost two decades and I promise if you spend some time with it you're going to see some value in it so we have this one 3060 level in here okay and price starts to trade off and as price moves lower again we're a bawling these levels in here now as price starts to move into these lows we could reasonably expect to see pauses bounces but you can see there's a very large acceleration moving Lower price gets a small little bounce in here this little bullish candle okay and that's on the heels of these lows
here okay but price eventually trades all the way down right into this 127 70 level again which is that level we have over here and these lows here and you see how price reacts there now there there really isn't any magic to this it since simply understanding what the institutions have done in the past at that particular level and when price Comes back down to it we anticipate the same reaction or a similar reaction in deference to what price is going to do next we don't have a crystal ball we don't know for sure what's
going to happen there's no guarantee that it's going to always transpire like this so that's why we use stop-loss orders and we use sound prudent risk management modules models rather where it gives us a shield okay we're not we're not expecting perfection we're not expecting To know every single swing in the market place we're not expecting to not be stopped out in trades we're expecting to be more consistently positive than negative and permitting ourselves to have that occasional and maybe even string of incorrect I'll use that term for now because I don't want to talk
in terms of profitability yeah in terms of correctness in our analysis okay that's where you want to be focused on now you want to be looking at are you Doing the same thing consistently over and over again with a large sample size of data that supports this theory okay we're gonna give you a whole lot of things to look at that you can study on your own because I see this also if you're new to trading and you have your your charts open maybe you're at work or maybe you come home from work and it's
you know over the table-tennis table you got your laptop or iPad or whatever it is that you may be using to look at Charts and you're looking at these price charts and you're staring at it like a deer in headlights trying to figure out what it is that you should be seeing a lot of that fog is gonna be lifted okay won't be completely eradicated but it's gonna be lifted in this episode okay so you can clearly see just by this simple approach of looking at the higher time frame charts here look at the nice
price moves here from this same level we just highlighted here okay If we look in terms of pips now again we're not expecting to get the entire moved iso - please don't build that as an expectation on your part but if you look at that move from that level down to this level that's two hundred and ninety two pips that's pretty respectable now again these are all daily candles so it's less than a month so if you break that down it's pretty uh it's a pretty good month I know you're probably crashing hey wait A
minute I'm not making 500 pips a week no I don't shoot for those types of levels in terms of tips because there's no guarantee you're going to get that high - it puts an unrealistic level of expectation as a tea trader should not be doing as they're developing even a seasoned pro and I'm not gonna you know oh yeah I guess I well I am I could guess I would be able to be classified as a seasoned pro at me almost two Decades of doing it not specifically for expert trading I think I would fall
in the category as seasoned pro and I don't have these high-level expectations that new traders are expecting and I I consider myself pretty avid in terms of price action understanding and I have a good feel what price is trying to do on any market any time frame but it doesn't mean I'm in here every single day 15 times a day because the common question is is okay Once you understand it and you understand more and more and more of it then you can start trading more in terms of leverage so you can take more trades
and therefore you're gonna be super rich and you're gonna be the next George sorro's and that's not what happens okay because what happens is you eventually grow comfortable with the fact that you don't have to be in from the charts all the time life is out there and I like being a Part of it so don't think because you're learning all these concepts that you should be spending even more time trading in fact I'm hopefully gonna take your hand away from the keyboard and the mouse so you don't trade all the time and you're just
going to be looking for these really cherry setups and that'll allow you to go to the market and pull out when it's highly stacked in your favor versus what majority of you guys do as new traders you turn the chart on And simply because you sat down after work it's time to make money it doesn't work like that guys okay so again this level here something we could arrive at simply based on old highs and lows and again using the daily timeframe okay and as a whole lot of other things that were going to talk
about not in this module but when we get down to actually understanding how it is that we take trades and entries and such we're gonna get in here and start breaking down These little points of which you can use to fine-tune a specific entry point and reasonable expectations and the why where and why price is going to bounce and move extrapolate price surges and and drops and like this right here okay we just covered this one here and I'm not going to beat it to death because we are going to be breaking down this little
section of price action but moving ahead you can see price does have the very very aggressive move higher And then we start to consolidate look at the wicks okay see the wicks they're all stabbing through that 30 60 level but the bodies are having a hard time making any measurable move lower you see that and watch what happens this same level now okay becomes an inversion level where it was support here it inverts now it's changed its role and now acts as resistance and as price comes right through it again here now on the northern
side of it again so now it Resumes its role of what support okay so this tells you that the institutions are doing some pretty significant dealings around this level here okay so as price moves away from here and if you see any kind of type of retracement in here this is when you can start to hunt a buying opportunity because now we can trust with a certain measure of expectation that this is now gone to potentially whole price above that 130 60 level the price rally up here this Level here becomes sensitive because this old
low here which is these old highs here okay so again we're looking and studying not just okay well I'm gonna grab this high in this low and if you just look at these highs no no it's this low and this high until price gets these level it's a long time you're waiting for you're gonna have to be doing a whole lot of trading so what you're gonna do you're gonna chase systems You're gonna chase something that you know is more active okay and that's problematic for a new trader because it's not about how many trades
you take it's the quality of the trades that you take okay so now when price moves away from this level here we could start looking for other specific price points that will aid us in support resistance now these old highs here price trades right up into them again okay and then trades off now like It's not about capturing every single major high and low you just want trading opportunities just in this price swing here is 191 pips just this 191 pips and we're talking about a week's worth of trading and then price does what it
snaps off again what did this rally take action off of see this hi here see this swing low in here you have a lot of body candles and then BOOM right here you see price rally up price punches through this high in this high and gives us a Reaction here and then trades back into this candle as well we're going to be looking at two sections of this market and we're looking at this move here and I'm going to be looking at this move down here so we're gonna be looking at trending environment which is
what this is here and a potential reversal area and I'm gonna be looking at this specific price sample here and it's a little bit different characteristic of this that will not be so notable here Okay but we'll talk about it in in greater detail and other episodes but let's for now let's take a look at this section in price action first okay we are in that small little section of price and what I'm going to do is I'm just going to pull up this area here as you can see now the first episode I talked
about looking at the first of July to the down the 9th of July okay and I wanted you to study what price was doing in all this sample size Of data now again we were talking about that section this is where price was moving down trading lower lower lower aggressively again off that 130 60 level that we noted and again then it's gonna add that level back here so you can see it okay and this is that daily move where it trades right up into it and then had a bearish move lower okay and then
we started to move lower and lower and lower because we study the higher time frame We can discern where the institutions and large traders are more apt to muscle if you will the price of a particular market one direction or the other you as a retail trader music retail trader I can't move the market I have to rely on the entities that are large enough that their orders and their buying and selling pull price out of the current status that it's at right now for instance when price was trading around that 130 60 level in
here let me fix This level here when it's trading here large institutions come in and they put big orders through ok but they don't put all of their orders in at one time they have to work that order in because they're not like you and I where we're hoping to trade you know a hundred thousand of euro okay they're not worrying about making $10 a pip they're moving massive blocks of price orders they hopefully can be filled Before price starts to move away so as price moves into these levels they're putting small pieces in at
a time okay why do they do that what is it specifically that they're trying to avoid much like anybody else they want to get a good price but because they're smart money and they're on a institutional level they are huge okay for instance let's take a step back conceptually looking at the market okay the forex market you'll end up as a new Trader okay we have a very childlike perspective of this is like a video game or this is this is an adventure okay or this is gonna be very fun this is gonna be my
new hobby and we'll stick with the childlike theme okay so this represents forex looks inviting doesn't just want to jump in there and have a splash but we're gonna use this analogy this small little poll here that will represent the market okay the arena is the pool okay and price is The water we can get in that pool and we can make little splashes around okay as retail but that water will not be displaced by retail traders will make small little minor little blips okay like you see here okay but when smart money gets involved
okay there like that elephant in the room you can't really hide him he's standing right there in front of you okay imagine if that same elephant now decides it wants To join the pool party what are you gonna have you're gonna have a large displacement of water they cannot hide it okay they are invariably going to be noticed if you understand their footprints okay as price trades up to this level at one thirty sixty level it's trading off it trades through it again and then trades off it trades through it again and then trades off
see this is the first telltale sign that somebody on the big level okay we don't Need to know who specifically but we just noted somebody when a larger perspective is now getting involved with this market and what are they doing they're shorting okay they're becoming sellers and in the at a level now that we discerned on the daily chart that this is probably gonna be an area that's sensitive the price comes up stops right on a dime here and trades off a little bit now what's happening is they'll put orders in they'll sell a little
bit and Sell a little bit and sell sell sell so and eventually when they knew they can put their last bit of you know their trade on okay they will you know just stack their orders all in this level and it may be a little bit above it a little bit below it but they're generally trying to get an average price around that one thirty sixty level okay it may be that one thirty fifty level as well because it's a it's a half-full figure a mid figure level so that may be the Price level they're
actually working to but as price moves above okay you can see how every time it does this around that level let's look at this whole price action in here you can see that this is a failure to run above this old high okay now when we see price trade-off I guess and it fills in all of that price decline like it does here okay this is smart money trying to get that same price action they put a large block on here now their liquidity is Limited to whatever's there at the time so if there isn't
a large pool of buyers here okay there will be a issue for them to get the rest of our orders off so what they'll do is they'll put small and again to us it would be large but to them it's small blocks to get their overall average price of the net short position that they want to be establishing once it's established okay price will do what drop because there will not be any more buyers for the Other side of their trade okay there's no more buyers so what's gonna happen is it's gonna create a heaviness
in the marketplace so now the net selling will take a larger of toll on price action and its price tries to trade back down these every little rally in here okay will be new selling opportunities now many times you'll see traders see these rallies here and they'll chase that how many times have you done that see this type of thing here look at this man it's Rallying up I better chase it let me buy this because this is probably gonna go through these levels here it's gonna go through these level it's probably keep on going
and maybe we'll see 130 150 or whatever else the guy in the forums or on the internet was talking about how it's gonna go there because they're cool little indicator said so has nothing to do with any of that okay if you start looking at how price is now moving lower okay you can see they're rapidly moving Price to a specific price point where remember that 127 70 level on a daily chart that we looked at let's put that in right here sorry if I'm boring you guys because you know this isn't sexy and it
wasn't sexy the first time I learned all this stuff either in fact I ignored it I said this is so boring it has nothing to do with making money I want to get in and get out okay had I understood what I understand now Okay and if you're struggling with this right now if you're falling asleep try to really get this point if you can't grasp this concept here while success will evade you consistent levels of success will evade you sure you might have moments of profitability where you have a string of winners but anybody
can do that if you have a career of consistency then you now you're talking okay because you're going to be doing what you're not expecting to be smart Okay does it take a certain level of understanding certainly but you're not trying to be a genius okay I'm not a market maven I'm not in here you know understanding every detail or a fundamental driving force behind all these moves but I understand by looking at price action what's the psychology behind it all and that's what we're dealing with in this episode because this is one of those
central market tenants that just glossed over in text Oh well you have to understand market structure you have to understand market dynamics internal pinnings of the market okay and that was the actual last thing the internal pinnings of the market that was an expression I learned from Larry Williams and the term extreme e but he didn't really go into great detail as to what the hell he was talking about until you spend a lot more time and money in his work and I'm not sure if it was planned because he is a an educator by
Trade but he is a successful trader as well so you know one could argue is it really meant to be learned all in one time who knows I don't know but all I know is if you spend time understanding these ideas that works in here you will be far far greater in terms of a price action trader then you learn in books or on your own because you just don't learn this stuff okay just by turning on the computer and gone to the internet unless you're watching My channel plug plug so anyway let's get back
to what we're looking at specifically in here now the first decline here and trades right back up into this level note that this price drop takes out a major well not major but a significant swing here as we trade into that level now again the main focal point is the higher time frame key level that 130 60 level okay we don't go to the lower timeframes hunting a pattern or a signal Or a setup and then try to find the level that supports that notion that's not how we're doing this okay you start on the
higher time frame chart and you find key levels okay that are obvious because if they're obvious that means it takes all the guesswork out now it may take some patience on your part that's really word P patience the long answer is you're gonna need to exercise a whole lot of patience because until price gets these higher time frame key levels you Aren't going to see institutional sponsorship behind the moves okay unless you find a move like we're describing here where we have a level noted on a hard time frame and another level based on that
same time frame that is a higher level support level so between these two levels here we don't have a whole lot in terms of higher time frame support long lines to you that would really expect to see price turnaround on a dime okay now we do have an intermediate term swing Lows here okay and we have short term swing lows here that cause pauses in the marketplace okay but we're not focusing on the short term we're trying to train our eye to see the intermediate term price swings okay so now let's take a closer look
as to what's taking place in here we're going to introduce the time of day and what we're going to do is we're just going to highlight with some arrows okay we're gonna look at specific little Areas where price made significant price highs and lows okay and what I'm doing is because on the higher time frame we had already established a bearish tone to the market in other words we were expecting this level to be sensitive and that we would expect to see price moving lower okay and where would be low moving lower towards this level
down here because it would be the next higher level timeframe support level so we have a whole lot of Range to work between okay and this gets to the central tenant of directional bias because a lot of traders it just escapes them and it's simply because they're expecting it to be again real easy to determine because the chart well you have to go and spend some time on a higher time frame because that's where it's going to tell you so we have a range of 291 pips between the high here and the low here these
two higher timeframe levels so 290 pips now watch What happens we're going to be looking at oops let me get the rest of my highs in here and okay so we have highs represented here okay and we're going to be looking for things that are generically repeating okay so we're going to introduce also support resistance but before that we have to break our chart down into time and day of the week now the double lines represents Sunday so this vertical line - this vertical Line represents trading for that week on a Monday from this vertical
line to this vertical line forever since Tuesday this vertical line to this vertical line is Wednesday and this is Thursdays trading and then Friday then we go into a new week on Sunday on your note pad right this very very big okay and underline it in bearish market environments okay what I mean by bears market environments if the daily chart is poised to move lower you have a 70% chance of seeing the high Of the week form by Tuesday's London open okay so if you have a bearish expectation in the market place expect the high
that we deform by Tuesday's long and open now sometimes you may get that weird crazy move that will take out Tuesday's high with Wednesday and that may be because of a major market you know moving indicator or report that comes out and that's gonna be that one wildcard event where you know sure you may have been in a profitable trade and If you didn't take any profits as you went down going into Wednesday's trading before it trades and runs your stop or runs you out of your position you know they're gonna happen and I can't
I can't I have not been able to find a way to avoid those types of things okay but by far and large if you look at when markets are trading softer and moving lower based on the higher time frame again we're a little more specifically dealing with The daily chart here okay but you can also move down to the 4-hour but really only if it's really not clear to you on the daily so again the daily or the 4-hour that's where your higher time frame key support resistance and bias is determined from because we're looking
at these higher level time frame support resistance levels that the institutional traders are going to be keying off of okay so again with the notion that this market is moving lower okay we would Reasonably expect to see the highly weak form on Tuesdays by Tuesday's long and open or Wednesdays London open at the very latest okay doesn't mean you can't see the highly weak form on Monday it just means that a large percentage of the time you'll start to see the high forming for that particular week by Tuesday's long and open okay and you can
see that is the event here okay and I promise you if it's the first thing you heard this it sounds like a whole lot of Hindsight mobile hindsight mumbo-jumbo it's just to perfectly cherry-pick go back over to chart yourself guys don't take my word on it okay study it that's how you get better at this dig into it okay when bullish market structures suggesting higher prices on daily chart look and see if the below of the week wasn't formed on Tuesday okay and the times that it isn't it's on Monday or Wednesday and that what
is that what Does that mean it means a whole lot as we're gonna discuss here we see the high form for this week on Tuesday okay and as price trades up to that point it's coming off of this low here okay so we have this low as a reference point and it'd be nice if I would cut that on the low before it was drugged away let's put that back where it belongs okay and what we're gonna do is run through all this all the way through the week okay because this level is Sensitive because
it's a nice swing low going into a key level and trade it off even this little bounce in here is tradable but we are focused on being what a seller because of what the premises that we have seen priced right up to this 1:30 60 level in a daily chart as we discussed earlier in this episode and as trade as price trades down and it starts to have these bounces we do not get all excited and frothing at the mouth Thinking that okay now it's going to trade higher and we want to be a buyer
okay I think classic chat chart patterns does this not look like a bull flag okay price rallies up consolidates and it's even doing what finding old support see here see the support see the support and what do they teach us in a textbook three points of contact confirms the support level right you don't think the dealers know that stuff they know what you're gonna do they're gonna hold price Here okay and then allow what orders to stack up what kind of orders are gonna stack up buying orders who's buying retail the less informed traders okay
well if they're buying it who's providing the other side of the trade the smart money what yep the smart money they're selling it to them lock stock and barrel okay who's gonna win an arm wrestling match the elephant or the child the little kid in the swimming pool it's gonna be Ellison now thing Gets in that poll boom the kid is taking completely out and the water is displaced so what do we see displacement okay price is now taken driven lower okay those that would have been trading what would be whatever their idea of this
is a climax reversal or something along the lines that would support us buying indication in here and again we're not arguing or making any case for that but we're just gonna assume for a moment that somebody out there in a Retail world assumed at that level was probably a good area to buy so if they bought here where would their stop-loss be right below that okay so price is driven where to where the liquidity is going to be here okay so here we have price trade down and trade right back up to what this level
now it becomes a another selling opportunity who's going to sell some more the smart money so they're gonna put some more their orders in and In boom it rides in the lower okay this short-term swing low here because we're not drawing the levels on it okay you can look at a lower 5 minute chart and see even greater dynamic support resistance levels but I'm using the 15-minute chart simply because you'll learn later on that your trade setups really gonna form on this timeframe but we're gonna keep it uniform and keep the continuity going and we're
gonna use this slow here price trades up to there And once we both below through it we we trade through it again okay but we come right back up in this old swing low here so I could have another level but to keep it clean the charm is gonna keep it you know just like you have here don't expect you know perfection in terms of your support resistance levels sometimes they'll don't knock your socks off and be so specifically you right to the minute oh not on the pip but we're only talking about here 14
pips in terms of Variants so again that's half less than half of what a normal stop loss is again for those who don't know I usually trade around with a thirty pip stop loss and again will understand later on why I use that later on again not now so we move into a new week okay price rallies up and this little pause here and turn down happens where look over here see that okay so price trades down okay find some short-term support which we're not going to look at because it's gonna be on the Five-minute
chart you can do that on your own rallies through okay and does what blows out a swing high why because maybe at this point some guys have figured out this is in a down move okay so they're gonna be doing what gonna be selling yeah those guys sometimes in the street okay get it right but do you think the elephant really wants them in the pool with them No Okay so what's gonna happen well they're gonna be short okay and they're gonna use this old high as a level to do what protect their position right
even if they're selling down here or here or maybe they saw this low here and they want to be a seller right there great what are they going to use this or stop-loss it could be this high here or this one so let's take a look at what happens here's your old high now I want to use that level and we're gonna just Go above it a few pips not much here you go when price trades right there the nature of the spread does its work right there what order would be resting here again assuming
that the retail traders are short there's gonna be a buy stop right here a buy stop so when that price trades up in OOP stabs into that level here what's gonna happen to that buy stop it becomes a market order to do what buy who's gonna sell it to them smart money and then when you see price Rally up like that bang what they do to drive down to their level okay and now this is where they liquidate all their short positions back here now they could have you know liquidated some in here okay and
that's what caused the the pause in here because now they're buying back some other net short position that they've assumed between the 130 60 and 150 level up here in this block of price action but as price trades down to this level Here okay they're essentially now no longer heavily net short they may have some short still on but essentially they have been unloading every time price dropped lower okay because they're larger institutional traders they have to be exiting during the move but certainly driving price down to it cific price point as we notice on
the higher time frame now when price gets to these levels here we could look for patterns the trade because again this Would be a higher level support level okay and then you can see price does indeed rally up okay and for those that had been using these points here okay and trade on a daily timeframe because there are nine to five desk jockeys and it can't be in intraday traders so you use daily bars to put their stop-loss orders okay those guys are crushed as well and left feeling bit wildered and like the game is
rigged and you just learned that it is in fact it is rigged And there but there's a means of understanding how it's rigged okay let's look at these specific times when price moved okay this high here takes place at fourteen forty five GMT or 1500 1500 GMT this high here takes place at 1500 GMT this high here is essentially 23 there's at 23:30 GMT and it's high here is 11 GMT this high here is 12 GMT and the high here is 6:30 GMT that's early New York oh I'm sorry neat I'm sorry Early alum an
open or Frankfurt this is New York open this is the very beginning of New York open this is Asia this is London close and this is London close as well so you can see there are specific turning points that are occurring at session open and closings okay and I promise that we're going to go into great detail as to what those specific time pockets are okay and in my trading I call them kill zones it's not because I'm supportive of Serial killing or or the notion of killing people I adopt the mindset of a sniper
but I don't I don't have you know suicidal or it's like psychological issues where I'm attracted to killing okay and so don't think don't think that's what this is I just use it to adopt a specific mindset okay and I view trading as a sharpshooting exercise okay much in terms of a sniper so it's not that I'm supportive of going out and you know shooting people I'm supportive of The idea of being a marksman okay so please don't send me nasty emails or or leave comments that I invariably forgot to turn off on my youtube
channel making comments about how you know I shouldn't be supporting the you know war or anything like that said please don't don't run with the idea of the sniper theme okay and think that I'm supporting into killing of human life but a lot of the themes I use and teaching comes from my way of learning so I had to create a Language for myself to understand what it is I was seeing in price action and it also it is valuable as a means of communicating or creating a vocabulary because a lot of this stuff it
is it came through just staring at charts now when I do get to concepts that I learned from other people I will always give credit to where credit is due okay I believe that should be always the case but you see many times and I've seen my Own work okay appear in things that you could buy on the Internet and I just recently bought a new course and I'm not gonna say who it is or what it is in this video but I was very disappointed to see something of mine and it is uniquely mine
and it wasn't credited to me and I'm very you know disenchanted by the whole thing but yeah I mean I might talk about it later on but certainly not gonna bring it up in This video series but if you do see a concept in this video series that I personally learned from someone else I will certainly do my very best to give them their credit as well let's look at the notion of fractals in price action and we're gonna move over to our second portion of price action and study this segment of price okay this
is the second portion of price that I was asking you guys to study and what I have here is I have the price levels on the 15-minute Basis because I remember we talked about how price is universally limited to trading within support resistance levels but each time frame has its own support resistance levels created as price gyrates up and down what I did here and this is certainly not every single lot of them but what I want to draw out with your eye is I want you to see there's a specific overall price structure here
okay now this concept is not going to be fully explained and understood by Watching this one video but if you spend time in the charts yourself you'll start seeing these things repeat over and over and over again and it's one of those things you have to keep looking at it before your eye gets accustomed to seeing it and then right away your brain will do the magic okay of seeing it remembering oh yeah this is what this is and you'll know naturally what you should be doing and that again and I'm talking About trading with
your gut okay this is what you do buy with your eye okay you're trading what you see price trades off of a level of support okay and we're just gonna assume that the 132 figure was significant enough to provide support and price rallies off here okay price comes back down trades down into that one thirty to thirty level essentially okay and bounces and runs through and creates a short-term support level okay now price has since been Trading higher from that low we discussed when price came down in our previous example when the higher time frame
we've found that support level now as price moved higher okay you can see this stair-stepping environment that you can see price doing and eventually it reaches the level of resistance now we're gonna show why it's a facade on your part to look at these lower timeframes and expect with any reasonable consistency to be able to see What's going to transpire next without having any idea what the higher time frames are doing now on a short-term level okay short term basis rather with the higher time frame premise in mind until a higher time frame barrier is
met and this is going to be in this form of resistance okay and that would be seen up here which we'll look at in a moment until that is met that barrier or that obstruction to higher prices one could capture trading opportunities when Prices finding support okay so I'm very well known for what I joined as the optimal trade entry which is simply nothing more than a Fibonacci retracement back to two sixty two percent or a seven or seven trace event level or my own level seventy point five which is between the sixty two and
seven percent rates they they have a very consistent level of reaction and price when they are hunted and I'm gonna give you some Examples on how just by using this price structure here okay how many times you can see these you know these signals setting up now again we're looking at the first week of August okay the first week of August and again we're assuming again the market is still bullish so we'll be looking for the low of the week okay now we reverse the script we learned earlier about the trading day of the week
four down moves we expect to see the High that week formed by Tuesday's long and open or Monday and the very latest by Wednesday's long and open but seventy percent of the time you see the high form on Tuesday or the low form on Tuesday in this case the low of the week okay cuz here's the end there because here's Friday's close here's the Monday's open the market opens on Monday trades lower this is the low of the week okay write this on your notepad when there is a large range bar okay whether It be
a daily or four hour or one hour or 15-minute we really doesn't make a difference as to what time frame it is but remember you have a large bar or a large candle large candles on any timeframe do not usually work both sides of the opening of that candle very much okay and what I mean by that well we're going to use this example here the market opened on Monday on this particular week it trades up a little bit but we're not talking about very Much here okay let's look it's exactly what we're looking at
here its moves up 25 pips it moves down 42 pips okay so it starts off going up about 20 it goes down about 40 and then starts to move higher but notice it doesn't work both sides at the opening very much if we're bullish we can reasonably expect to see any decline be very modest okay so we could be a buyer on one weakness with this with the understanding or a level of confidence that if this is a Bullish week and it trades slower okay go on Monday or Tuesday we could be a buyer that
find support okay but now prior to this price drop I'm gonna ask you what do you see here now we're looking at the one thirty to thirty level here but again because we move down to a lower timeframe what other level stands out you see this high here the short term high let's note that now I will admit it's not very much in terms of difference between here and Here okay this level let's note it so you can see what it is it's the one thirty two twenty six and this is the one thirty two
thirty level so it's not much in terms of pips but if this was an hourly chart or over four-hour chart this could very easily be fifty sixty different you know any number of pips that's greater than just less than ten here so again I'm trying to take your eye and train it on a conceptual basis and not limit it to a specific timeframe Okay the things that are generically inherent or sensitive to time frame is the hard time frame the daily for hour on one hour so the trend the directional bias the heart's high level
support resistance levels those things don't move they're very very very powerful they're static you have to correct directly relate them to the higher time frame again daily for hour on one hour no trade whatsoever you should never take a trade out Of having a key support level or resistance level that is either you're either from the 60-minute minimum four hour or daily chart okay if you do this your trading is going to move to another level immediately but it's also going to force patience which is a very hard characteristic for traders especially as a new
traitor you're not going to have that level of patience okay but by applying the hard time frames for resistance levels it's going to force You to wait and that's a good thing okay so that's it that's a characteristic of good trading that has a learned characteristic we just hope we don't open a book up say okay I read that chapter now I'm patient no you know what I'm talking about I mean you know we you've had your demo accounts you've over leveraged it you know $100 per pip just to see what would happen you know
what's gonna happen nothing nothing one in your pocket you Wasted time and if it lost money you didn't pay attention to that one what the ones that do you're sitting at work daydreaming that's the way you're gonna get out of having to ever have a work anymore okay so you know what you did you know what you do all the time so stop doing all that mess so now looking at this price action here okay we have this short-term high here okay we have these swing lows in here okay so what what in this block
of price what level In here is being worked any idea the 132 big figure okay 132 big figure so what we'll do is we'll just move this down okay and what I'll do is I'll take this level and I'm just going to put that here okay so we have a price level that's being worked here and we have a very short-term high here as well but this retracement here okay you see that we're gonna introduce briefly I don't want to do too much of this because I can very Easily turn this into a four-hour teaching
just on fibs and won't even scratch the surface on what's applicable with it if you pull a fib from that level okay this is a support level okay we have price here rallying up away from it making this high here okay you see that do you see now we put this right on the level because I want to be consistent about what I'm showing you this is the 70.5 level this is the 79% level and this is the 62% level price Comes down to 62 and bounces and then what does it do it rallies off
trades up into old lows old high resistance into Tuesday okay Tuesday trades down it makes a low the low here comes at 6:30 gmt thinking times day that's middle of frankfurt the very early stages of london open okay just go back here for a second the low on this day here forms at 1345 gmt the high that day on monday forms at 7:45 which is a limit open so now we have another minor move here and Retracement okay if you pull a fib from that price swing from here to here and I'm gonna take this
one off so you can see price comes right down to that 62% of jacent level now we're hunting or stalking buying opportunities okay but just 62% what else could we use okay well let's see what else happens around that 62% we had the 132 47 so isn't that really the 13250 level it's a big big round number right so you can see price comes down to that mid figure level and Then bounces so there's a confluence of support like that okay now price rallies up comes down bounces here trades out finds a high and retraces
to do what well this old high here once it's broken through its becomes an inversion level again it's resistance here once broken okay its role is inverted now it becomes the support rallies off okay and it comes back down on the very next day so you don't have to rush if you miss this move Fine then you start seeing on Wednesday price retraces okay and you would do what expected to find support we're here but now watch what happens you take your fit and the previous day's low pull it up to the high this is
the highest point from this low to this high as it retraces do you see what it's done here here's the 62% race Minh is 79 second trace mint level we have a confluence of support and resistance on that 70.5 level or sweet spot okay this is like That target crosshair on a sniper scope this is exactly what you're looking for the very low of this candle okay comes at exactly at 9:00 GMT that is the one that open kills them price rallies up takes off okay breaks through this old high okay see that old high
here breaks through that let's take our fit that we had drawn here off okay price rallies through it and comes back and does what finds an inversion level this resistance broken the role is inverted Bhoomi becomes what support okay now I'm gonna refrain from breaking down to a five minute chart just to show you the hospital trade entry here but you see this swing lock here this is the London close this little swing low here this occurs at London close write this down the internet pen every session high and low in other words the highest
high and the lowest low it makes during each session okay That means the London session the New York session the asian session okay you look at those three major trading sessions and you want to be looking for the highest high in the lowest low and it's easiest to do that research on a 5-minute basis okay and you want to be getting used to seeing what those ranges are for these individual sessions now when you use that information you'll be able to pull your fibs from these particular price points and you'll see The signals that evade
many people and a lot of times people watch my video and say well it looks like hindsight to me you'll see that this is the same stuff applied over and over again okay so we have old sorry a low here which is old highs here on Tuesday so these are all lower level support levels that are now dynamic so this level is good but you can fine-tune also okay but more importantly as price trades back down to this level here I'm going to show you This is the high and the low and here's the sense
at tracing level lying right on top of this support level so we have real support resistance with overlapping Fibonacci second I said tracing level with a directional bias in mind looking for higher prices okay so you could be a buyer on this candle here and this candle comes in at 2:45 GMT so you guys that work all day you could have been in participant on this move this is a Asia session trade price moves up blows Through a short-term height it creates on this day here and meets a otherwise unknown resistance level okay do you
see the facade here if you're just looking at these types of charts in a 15 minute basis if you're looking at sub 60 minutes anything less than 60 minutes without having a reference point on the higher time frame you really are throwing darts in the dark you have no idea what you're aiming for okay you may Think you know what you're doing because the price is trading up and maybe you're drawing trend lines and all that business look if you don't have the higher time frame premise of mind you are gambling there's no other way
of saying it you're just simply gambling so now we're gonna look in a moment at what this catalyst was okay and it's gonna be very clear to you it won't be like all this is I'd say picking it and you're gonna see it's so clearly obvious why it Turned here but eventually priced us breakdown and trades down breaking all of the Oh higher highs higher lows higher light hi honey and it's all broken here this low is broken here so now we have a break-in market structure so we're gonna learn more about in later modules
but as price breaks down okay this support level as we see it at my little bounce here price comes down breaks through it and trades right back to it now okay so now if you pull a fib From this high to this low you can start seeing overlapping and you can do this on your own chart that's his videos getting very long you can see there's this selling opportunity the candle here comes in at 6:00 GMT this is Frankfurt opening at the very beginning of Frankfurt various trades down find some support okay if you just
look over here where price starts to take off in here this little pause or consolidation it bounces right at that same point comes Up and starts making a larger range okay and creates a tap to this old swing low is resistance and in trades lower and breaks through this swing low trade softer back right back down to old lows that I did not have load on the chart as a horizontal line it bounces trades up to a known level of resistance okay and comes back down and starts consolidating but it's consolidating around that 13250 level
so that's just calibrate our level Here okay I'm gonna leave that there and I'm gonna take this one off just so it won't be confusing to us when we go out to a higher time frame chart because I want to illustrate what it is that's transpiring here and now up here if you look over here on the left I'm gonna start on the right hand side this is essentially the 134 figure so what we're gonna do is there's going to highlight the 134 okay in it there was uh 133 98 Was the high that day
but we're gonna see there's an actual high on the higher time frame that this would have been utilized as a reasonable expectation expect price to be either pausing at that level or maybe a little bit above it excuse me or below as we have here now we're going to drop out to a 4-hour chart okay and here is that level right there okay you see these old highs it's essentially worked that 134 figure how about this old high see that let me take These vertical lines off sorry if I gotta get this off and it's
just drive my eye right to it you can see that price it slipped aggressively layer right there and as price ran out to that old high in here it's reasonable to expect that at least this would be a pause or a reversal and you see that if you go back farther look at these highs see that how about if we go out to a daily chart here's those highs week just looked at look at this hi look at The Loews here see the highs here you don't think that level sensitive okay you see help you
solve that here okay so again let's go back down to the 15 minute chart price trades down from there okay until it does what it finds support okay this level in here we're just going to borrow as horizont online and we're going to use the very extreme okay now this is illustrating the again the Facade of using lower timeframes to justify the trade without having a higher time frame premise okay we have the 132 10 level this is essentially what that is and that's a level that I've talked about in weeks since this time of
this recording if we got to a 4-hour chart here's that 132 10 level okay price comes down hits it right there or Ally's off look at the time it spends at support resistance at that level see that Okay when price trades down like this and rallies off go back down to a 15 minute time frame it was in a consolidation so I was asking you when we were doing our first episode what you saw here okay now this is the market maker business model okay and we'll talk more about this as we go along but
we generally see a consolidation a rally a retracement then another leg up and a pause and a leg up in an eventual reversal with a Failure swing in other words here's a high it fails to go higher and then it breaks down then you start seeing the market moves lower with opportunities to sell okay there are really two legs up and then two legs down and there is an zenith point here there's an an origin point here and a conclusion point on the right side okay they built a block of orders okay they rally the
price up they is the dealers okay the market makers and then They have another leg up if you look at price very generically if you say okay here's the low and it rallies up it makes this price swing essentially using this low here this is the second leg here okay now we're not looking for a perfect symmetry but the overall price structure will always be very similar to what you see here the price move lower okay we have a high down to a low okay you can see the second leg here okay so we have
Price move and then consolidation and they let move lower it so that's the second leg so there's two phases up two phases down but there's a reactionary high that's formed here okay so they rally price up and then they sell off so the accumulation they accumulate Long's here they rally price up and as prices rally in they distribute and then they start selling on the other side usually what happens is as folks over here are expecting it To continue and they're buying over here because why they're looking at clothes over here drawing trend lines and
I think okay it's prey to the trendline let's start buying and it breaks and then they don't know what they're doing so much of the same way does it on the upside same thing will happen here folks start seeing these stair steps going lower lower lower they'll draw their trendline again this is why I'm not a fan of trend lines but you can see how This is a very textbook trendline so when price gets here okay let's be a seller really why because the 15-minute chart says so and if it's a trendline watch what happens
Wow we've made money boom we got crushed watch what's happened to K we move into another market maker business model we go into a consolidation a fake rally then they take two stops out Lindos that are right on the market say they could have been buyers down in here okay there's could Be retail traders that were being buyers down here and they would've been right bang you take them out it activates their cell style their cell stop becomes a sell order at the market who's gonna buy it from smart money and you see this extrapolated
huge move rally up okay now think like over here we have a consolidation a rally and then a consolidation a rally consolidation a rally and a reversal of sorts and then a breakdown okay let's look at what we're Looking at here we have a consolidation a rally the consolidation a rally a failure swing the market breaks down and creates a false rally and we move lower move lower rally move up into old resistance okay and this is where we're at right now so you see you can see there's a general repeating theme here okay they're
not always gonna be identical but they're gonna be very close in terms of their structure okay and this is what I refer To as a market structure you need to see what price is trying to do okay and key off a support resistance use time of day use day of the week okay and let's add that real quick here you can see that the low was formed on the initial leg up but you're now in the second stage okay this is where we apply it's more of a most an advanced approach to utilizing but you're
also implying time then the study of time is important okay so you have the price rally here from the Previous week in consolidation and then it rallies up so this is when you get these weeks that yeah you do have a low form on on Monday or Tuesday rallies off and it makes a very good potentially profitable trade but then you have the reversal failure swing and it trades lower and takes out the weekly low why did it do that take the vertical lines off and take the barriers or blinders that you have on thinking
okay ICT said the Week is bullish that means it's going to be the low the week on Monday or Tuesday or certainly latest by Wednesday's lemon open so therefore buy and hold well there's a little bit more to it than that and that gets back to where we at in terms of the overall market structure okay so now on the other side of the business model so now are we going to continue move lower very well could why because we went up to that 134 and failed okay there's a lot of a lot of Fun
a lot of other things that we could build on and again I'm not trying to give you a trade but there's certainly a lot to suggest that this could potentially become a nice turning point if you look at the high here down to this low it's a very significant retracement point and we'll just leave that for another time but if price continues to move on higher then we can assume that this is a very solid swing low this formed and we could see you Know this this high challenge but we don't know for certain we
just look for confluences of supporting resistance with a bias in mind and then trade on that and overall consistently applying that mindset you'll see that there's as a means of finding consistency in your trading you you you you You you