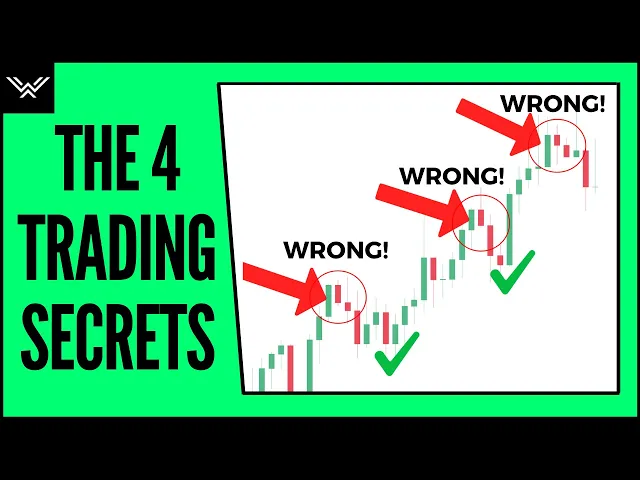
[Music] hey guys this is Rick from wise trade and in this video I'm gonna show you exactly what I discovered after 10,000 hours of trading first to make sure you have the video set to 1080p so that the chart quality is clear the first discovery is that price is never too high or too low when I was first starting out I always thought to myself that price has to turn out this level of support and resistance because price is already too high or too low which is the wrong way of thinking about it when price
starts to trend it will go on and on and on so here's an example on the pound Kiwi as you can see we had a level of resistance here with four rejections before price finally breaks through showing the heavy bullish presence now in your mind you spot this level here that acted as support so you draw it in but as you can see price breaks right through and you're probably thinking I wasn't going to take that trade anyways because it was a fresh breakout so next you look left and you see this next level here
so you draw it in and as you can see price had a slight bounce but then proceeded to break right through again now you spot this level up here that is acted as resistance and you notice that the last time price got here it tanked down and now you tell yourself price is looking higher already and we just blew through three levels so this level must be a good short trade price initially stalls before again breaking it right through so then you look left and notice this next level of resistance and say okay this is
finally it price is way too high now it can't just keep going and we are also approaching overbought RSI and look at these great candle wicks rejecting this area but again boom it breaks right through so coming up to this next level is where the actual reversal occurred everything that has come before this level showed zero bearish presence price does not truly show the first sign of slowing down until we have these four rejections at resistance a break of the triangle and a bearish engulfing candle which is where the true reversal trade occurred so again
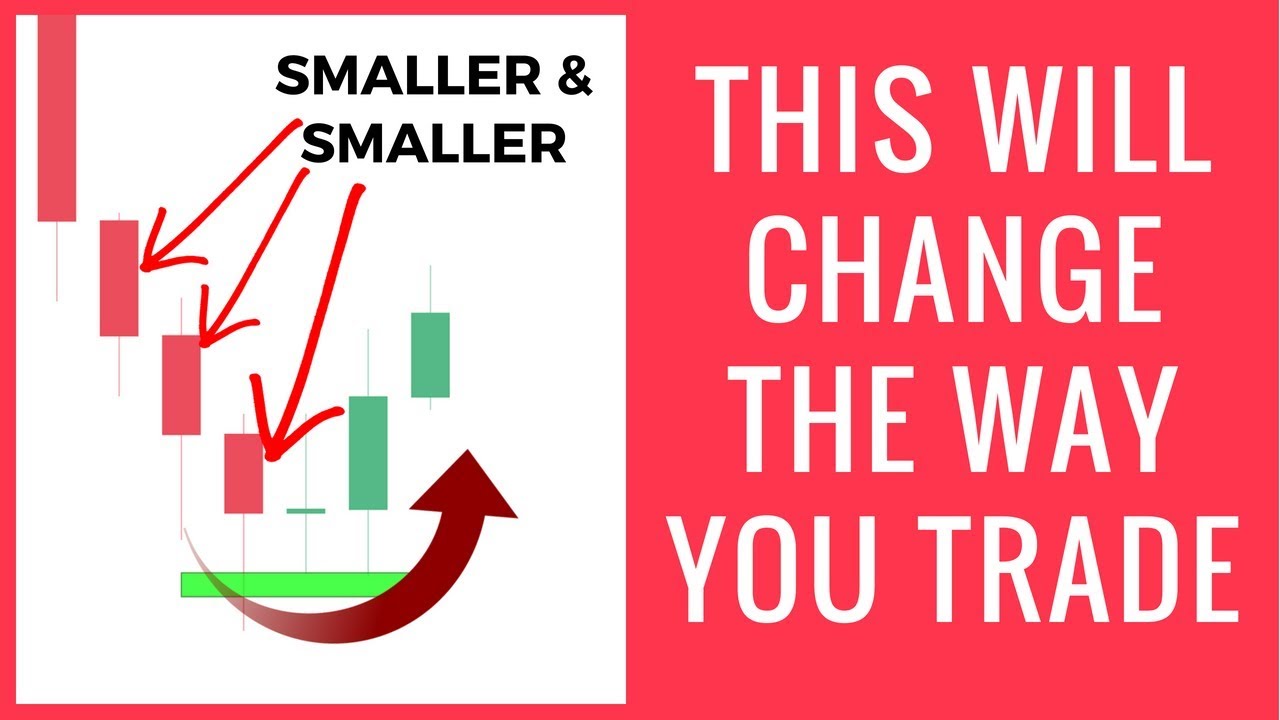
price is never too high or too low always wait for price action and confirmation that it is actually ready to reverse now on to the second discovery when price breaks out there often isn't a pullback that occurs a lot of traders like to trade the pullback after a fresh break but often when price breaks out from a huge turning point such as a key weekly or monthly level there often isn't a pullback as price starts to move with heavy momentum so this is the Aussie dollar pair this red arrow here is where the trade we
will analyze occurred as you can see this area is very key and has acted as both support and resistance a vast amount of times so let's zoom in and I'll show you what I mean so as you can see price hits this level of key support and broke out this is very bullish because we have a break of the trendline break of minor resistance and a bullish engulfing candle most traders want to wait for the pullback to occur and then enter a trade long but as you can see there was no pullback that happened because
of the heavy bullish presence and price took off leaving many traders in the dust as they missed this amazing trade so you're probably wondering why does this pullback not occur for a pullback to occur you need two things to happen you either need people who went long to start closing their positions or you need sellers to start shorting this pair now if you're even a beginner trader you know that there is a high chance that neither of these two things are happening and if they are happening it is not happening enough to a scale where
it can trigger a pullback there are only buyers in the market right now causing it to only have one direction think about it from your perspective let's say you have seen price in a downtrend for months and months before finally reversing and you enter a trade long here why would you all of a sudden close it so early the second it starts trending upwards you wouldn't now think about it from a seller's perspective you notice a fresh breakout showing the heavy bullish presence why would you jump in front of the trend and enter a trade
short here you wouldn't again without buyers closing their long positions and sellers entry short it only has one direction to go now to add more feel to the fire more traders will continue entering the market long here and people who are already in long positions might continue adding more positions as well which only drives the momentum harder now I'm not saying that pull backs don't happen as there is plenty of times when you do have pull backs occur you just have to know how to act in both situations or else you'll miss good trades so
you're probably wondering how do you get around this problem to not only take advantage of breakouts without pull backs and to not miss amazing trades but also not to get caught holding the bag when a pullback does occur we explain this concept more in depth on our website along with a lot more free content so check the description below for that now the third discovery is to always check correlations between pairs what this means is you might spot an amazing trade but if other correlating pairs are telling you something different be very careful now I'm
not saying that the trade won't go in your favour but you have to be careful here's an example on the dollar cad you notice a level of resistance here so you draw this in price then comes up and then you notice all these beautiful candles rejecting this area so you're thinking this is a great short trade if you had entered this trade your stop-loss might have been somewhere around here and price would have most likely taken out your stop-loss before it moved down now if you had checked correlating pairs such as the dollar Swiss here
you would have noticed that price is in a fresh uptrend and is heavily bullish showing the strength of the dollar now jumping to the euro dollar you see the same thing it is in a heavy downtrend showing how weak the euro is against the dollar which again shows the dollars strength now price did end up reversing but again you have to always be careful trading against the dominant trend as swings will occur that don't always work in your favour so again always check correlations to understand the bigger picture of the currency in question now the
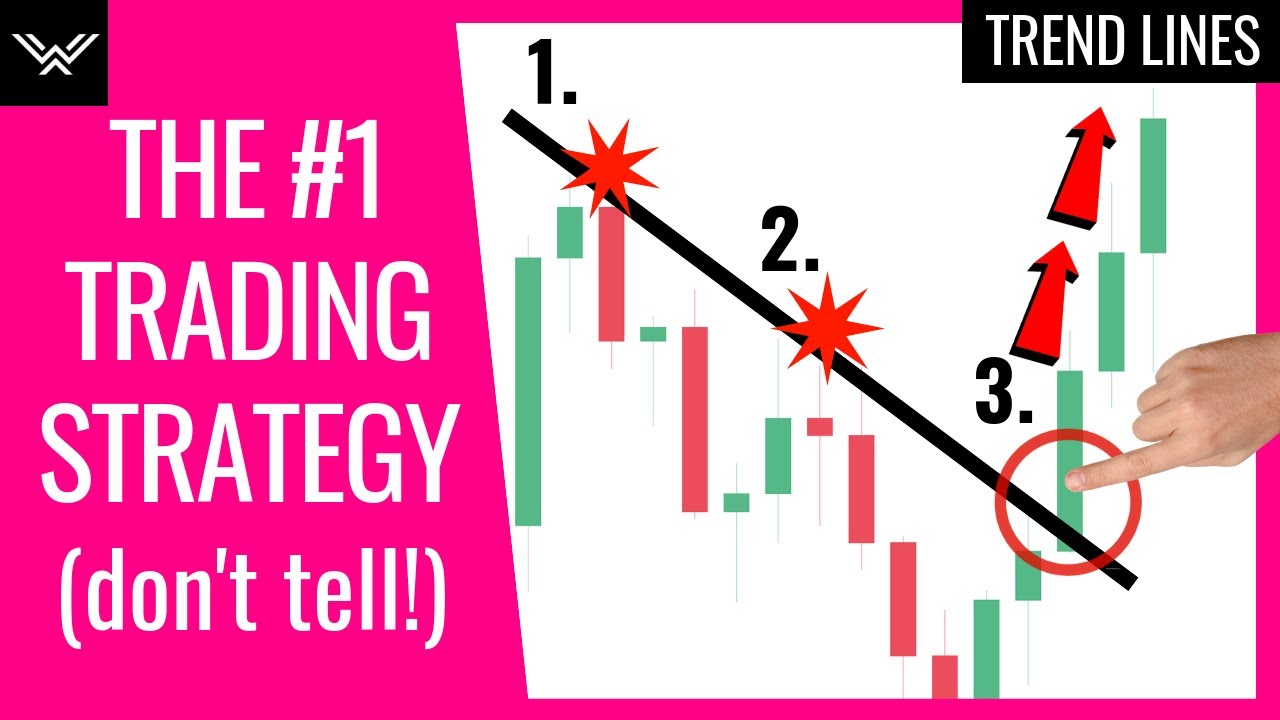
fourth and final discovery is that there will always be something negative in the way of your trade what this means is you spot a great trade with tons of confluence but you also spot negative factors in the way trust your analysis if it has been tested over time and if the pros outweigh the cons take it so here's an example here is the Kiwi dollar you look left and noticed that this is a key weekly level priced and creates an inverse Head and Shoulders pattern which is a bullish reversal and then breaks out confirming the
reversal priced and creates a small pullback which gives you a good trade now some of our beginner traders didn't take this trade because they saw this level in the way which made them miss this great trade that ended up taking off from experience there is always something in the way of a good trade focus on the bigger picture and you'll know where the market is truly headed and you can disregard these minor levels now to recap the four key points one price is never too high or too low always wait for the market to tell
you what it wants to do - there isn't always a pullback during a fresh breakout three always check correlations to see the bigger picture four there is always something in the way of a good trade so just make sure the pros outweigh the cons and take the trade now most importantly in the comments below let us know what key things you have discovered about trading Forex over time and also let us know in the comments what kind of video topics you want us to cover and we'll work our best to create them for you please
like and subscribe to our channel to show your support as this goes a long way so thanks for watching and I'll see you in the next episode [Music]