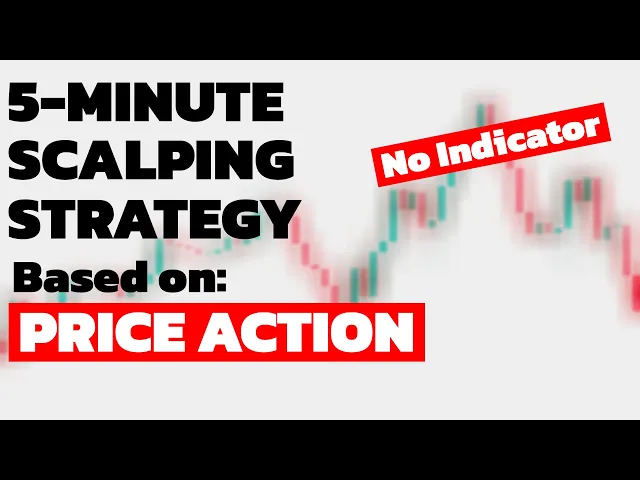
what's up everybody welcome to another scalping lesson and today's video I want to teach you a scalping strategy that is based on price action analysis no indicator is used in this strategy and all we have is only a price chart stay tuned and let's get started alright the scalping strategy that I want to explain in this video is one of the popular trading strategies in the market and has been used by Traders for many years now as I said in this strategy we don't use any indicator and all we have is just a naked chart
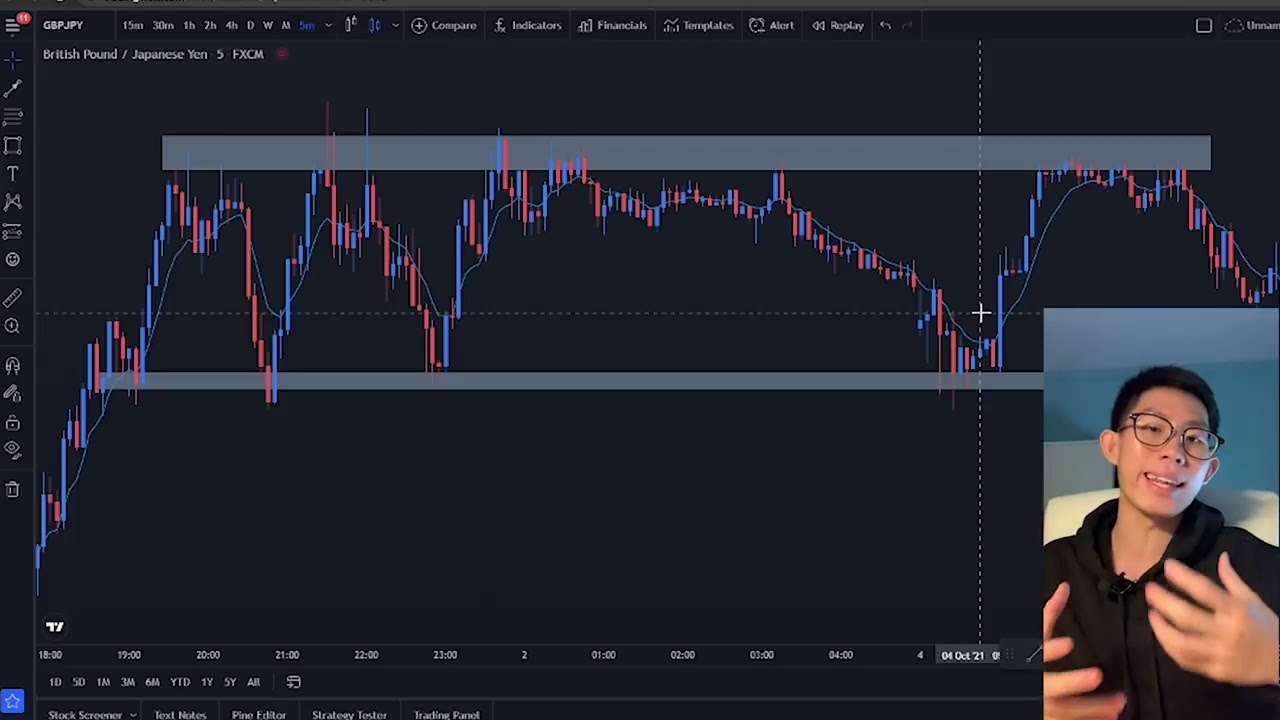
and this strategy we use two time frames five minutes which is used for trade entry and 15 minutes which is used for identifying general movement and levels of the market we start this strategy on 15 minutes time frame and after identifying the high and low levels of the market we switch to five minutes time frame for discovering a potential trade entry alright now let's see how we trade based on the scalping strategy on 15 minutes time frame when a candle is closed for example let's begin from here when this candle is closed we mark two
lines on the high and low of the candle here we choose this tool which we can use it for drawing lines and here in this level for the high we draw a line and another one here at the low level of the candle after drawing the lines we switch to five minutes time frame please pay attention that here for illustrating the strategy I'm I'm using the pass data but in practice you work with the right side of the chart actually when a new candle just started to forming and opens here we work with the candle
before that in practice when this candle is closed instantly we must start drawing the lines for low level and high level of the candle alright let's get back to where we were candle here started at 7 UTC now we switch to 5 minutes time frame and seven UTC actually that 15 minute Scandal started here please pay attention that one candle on 15 minutes time frame is equal to three candles on five minutes time frame started at 7 UTC one two three and these three candles are actually the price movement inside that one candle and 15
minutes time frame now if the fourth candle raised this level we enter a trade we must wait until the candle is closed above this line so we enter a long position here as the new candle is opened placing of stop loss for this position depends on the distance of these two lines which is actually the distance from low to high of the candle on 15 minutes time frame if the distance is short we can set our stop loss below the line and if it's far from our trade entry we can set it somewhere in the
middle for example in this case we can set it here below the low of the metal candle and for the profit Target we set our take profit order at the level that makes the rescue reward ratio equals 1.5 let's get back to 15 minutes time frame and here let me show you another example let's consider this candle when this candle is closed on 15 minutes time frame similarly we Mark the high and low levels of the candle like this and then we switch to 5 minutes time frame let's see if the price rolls the resistance
level candle was started at 8 15 UTC which is here one two three candles and if the fourth candle breaks this line we enter its rate so we can enter a long position here as the new candle opened for this position we set the stop loss here below the low of the third candle and profit Target at 1.5 rescue reward ratio let's get back to 15 minutes time frame and let me mention an important Point here when a doji or a spanning top forms on the chart it's better not to consider them for trading because
these candles show indecision in this period you can trade based on them but the risk is a little higher for example let's consider this candle and see what's going on with this let's mark the low and high words Point tool candle started at 7 45 we switch to 5 minutes time frame and here it is candle started here one two three and the fourth candle closed above this line so in this case we can enter a long position but if you pay attention to the points movement here you can see that it's totally flat so
the risk is a little bit higher in this case so when a doji or spanning top forms on the chart it's better not to consider them in this trading strategy alright these two examples were for advancing of the price and and declining of the price we do the same but here breaking of the support level is important to us for example here when this candle is closed instantly we Mark the high and low width line tool foreign started at 9 15 we switched to 5 minutes see how the price played out 9 15 here it
is one two three candles and the fourth candle breaks this line and closes below this level so we can enter a short position here as the new candle is opened the stop loss for this position can be placed here in the metal somewhere below the high of this third candle and the profit Target at 1.5 risk to the board ratio let's get back to 15 minutes time frame and disclose other important points related to this strategy here we got a green channel it's actually a pullback following this declining of the price and let's see what
our strategy does with the screen candle we Mark as high and low that's our line tool candle started at 10 15. switch to five minutes time frame and here it is one two three and the fourth candle didn't break this level so in this case our strategy correctly didn't give us any signal for opening a long position we get back to 15 minutes time frame uh please pay attention that the fourth candle doesn't always break the high or low levels for example if we consider this candle and we mark it slow and high foreign at
10 45 year one two three and here in this case you can see that the fourth candle didn't broke this level so we don't enter any short position here at this point you may uh think that maybe this was a short candle that this happened but for example if we also consider this candle which is a long red candle showing selling pressure after marking the low end High 11 or into five minutes started here one two three and for this case you can also see that the fourth candle didn't break the supportable soul here also
we don't enter any short position this strategy is strong enough to not give regularly false signals in the times that market show pulled back or in the times that market becomes a little bit weak in situations when turning points of the price is happening but please pay attention that this strategy doesn't generate 100 guaranteed signals and losing trades are part of the game this strategy works best when the price is advancing or declining and lose its reliability a little when the market is flat so it's better to stop trading and the times that the market
is flat and wait for the times that you can clearly see advancing or declining of the price to run this strategy successfully and profitably you need to manage your risk properly this is a scalping strategy and you're gonna actively trade in a day and you must understand that losing trades are part of the game and it's impossible to win every single trade so you must exactly determine how much you will lose if the market suddenly turn against your possession for active trading such as scalping strategies there is a risk management strategy which is called one
percent role I have a complete guide on this the link is also placed in the description of this video and I highly recommend you to watch it because without a proper risk management strategy you cannot successfully unprofitably run the scalping strategy that I explained in this video not only for this scalping strategy but for any other trading strategies that you want to use that's very important to manage your risk properly alright that's it thank you for watching this video if you have any questions feel free to ask and leave a comment for me I'll answer
your questions as soon as possible if you haven't subscribed to my Channel Please Subscribe and hit the Bell so you get the notifications of my new video see you guys in next video and good luck with your Trading
![EASY Scalping Strategy with NO Indicator! ONLY Price Action! [Nobody Knows This NEW Strategy]](https://img.youtube.com/vi/GEYCVmH5AbQ/maxresdefault.jpg)


![BEST TradingView Indicator for SCALPING gets 96.8% WIN RATE [SCALPING TRADING STRATEGY]](https://img.youtube.com/vi/2U5VTWBBK8U/maxresdefault.jpg)