you guys have a good idea of how the power of three actually works and why it happens we're going to take a look at how to use it um just by looking at candlesticks on the higher time frames and you can use this to determine your daily bias and the draw on liquidity for the day so to start things off as you guys can see here we have one Candlestick we're going to take an example at how we can use power three on The Daily time frame so the last day was bullish let's just say
we're in a clear uptrend from this candle what will usually happen is once this day closes we will open during Asia session accumulate the candle will go a bit like this London session it will start to push lower and as New York starts to open we'll see this candle start to move back up and then eventually take out the previous day high which most of the time will be on your draw liquidity for the day so this this will be how the candle ends up looking and the best way to explain that is during the
sessions we will have Asia for example these are not the Times by the way I'm just giving an example this is Asia session this is London and this is New York what we want to see happen during this time is we aim acculate during Asia session for bullish will manipulate to the downside during London session and then we can see that reversal and continuation during New York session and that is going to be where we take out that previous day's high so basically on The Daily time frame it's just power of three between these sessions
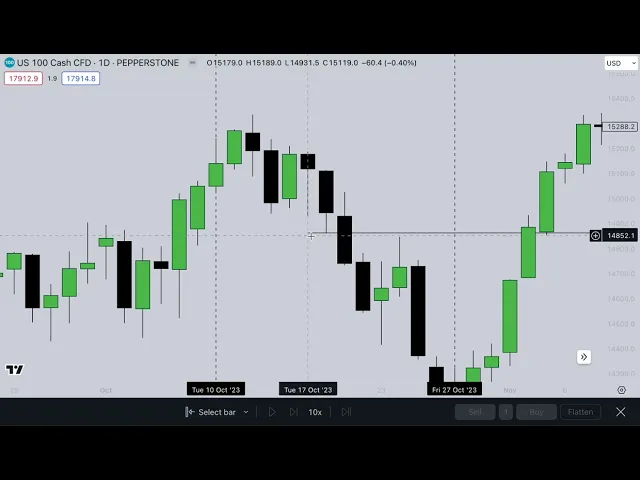
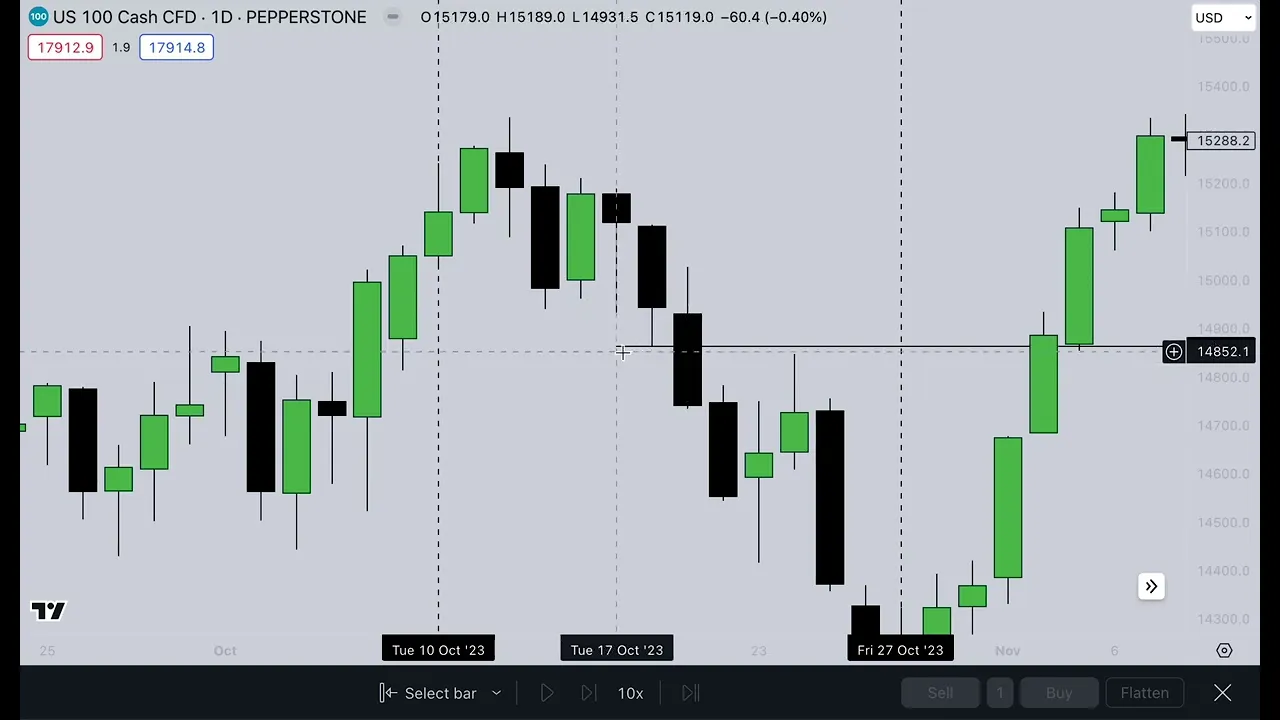
now we can take a few examples at this let's just look right here for example these three candles we are in a clear uptrend here after bouncing off a higher time frame level so what can we expect after a large bullish day Wick into the body during London and we go and try and take out this High what can we expect from the next day we're still in an uptrend Wick into the body and go during New York to close Above This high of the previous day so we can go on bar replay and take
a better look at this let's just see how it plays out here so we can start from this day on and let me go 3x speed just see how it works out so one moment hold on let's slow that slow that down if we can here we're going to go off this bar here I want to take a look at this on the monthly time frame you'll be able to get a better idea of it um just because of how the monthly candlesticks will move because this doesn't just happen on the daily time frame it
also happens on the weekly the monthly the hourly the 4H hour time frame and the 4 Hour is actually where I found my entry so let's just take a look at this and this is how it's pretty much going to move so you can see Wicks into the body closes above the high Wicks down closes above the high Wicks down close above the high Wick down close above the high Wick in close below the low Wick in close below the low as you can see majority of the time we Wick down into the body of
the previous candle before we start pushing up so that was just an example of how the candlesticks can move on the monthly um but basically that's how we want to do it on the daily and we can see this play out in many scenarios so once you've determined a clear Trend that that's how you can determine your drawn liquidity for the day so let's say we're trading within this zone right here and we're bearish let's say um this is the day you're trading price is about up here um you're not really sure where to target
this isn't necessarily the most valid daily order block so you're looking for a close Target maybe because you're unsure on the day this would be your draw for the day so if you're in this day and price is around here and you find your entry to go short this is where you're going to take some profits off right here and then of course you look for other lows but again in a bullish scenario if you're Wicked in you can expect to always take out this high so that's always going to be an area that you
can trim or Target for the day so just to briefly go over it again when we are in an uptrend here so either you guys can determine that and I'll make another video about it but either sweeping an external level or maybe tapping into an area of accumulation and you start to see a reversal now you're in an uptrend you've determined that now you can expect oh if I'm going to trade this day what do I wait for it to happen Asia opens accumulates wakes into the body during London New York starts to open you
take your Longs and Target this previous stays high and then of course other levels higher than that but this will always be your drawn liquidity um for the day if you're in in uptrend now there is certain days as you can see in here that's going to be pretty difficult to trade because we're pretty much just chopping around at these alltime highs this is more of a macro thing but obviously days like this you're not going to get clean entries th These are times where you sit out of the market when you see this stuff
kind of happening you wait for a clear Direction so once we saw a break in that we were able to take shorts that whole week because we broke some real structure but that's a different point this is basically just drawn liquidity and how candlesticks move in the power of three so yeah if you guys have any more questions on that um I will be happy to answer them but as for these candlesticks that you know don't go in the direction you want like days like this that is because there are higher time frame levels getting
involved when you see very prominent lows or highs in the market on an external level on The Daily like this big low up here once price Taps into to where that low is that's when we have a rejection so when we're at these important levels in the market um these are not you know the most high probability days to continue to rip Longs we're also within an order block on The Daily time frame there um we're having trouble pushing through it so things like that you can consider um but yeah mainly for this just draw
on liquidity if you're trading a day and you're bearish it will likely Wick into the body during London take out the previous day's low if you're bullish it's going to Wick into the previous day's body and take out the previous day's high and continue if you guys have any questions let me know um but besides that moving on to the next video here