In this course I'm going to teach you everything you need to know about getting started with day trading we'll break down day trading into easy to understand Concepts from Market structure and price action to volume spread analysis trading indicators and strategies we'll cover it all in a clear and concise manner so like subscribe and let's get started the price chart of any Market may appear Like a random distribution but this is not so recent studies show that around 30 percent of the time a market will be in a definite Trend the rest of the time
price will trade more or less in a sideways range your job is to recognize Trends early as they emerge from non-trends or as reversals of Prior trends so first you must know the basics of Market structure and how to find Trends on any Market Market structure refers to The overall state of the market which can be labeled as either an uptrend downtrend or consolidation identifying the current state of the market is the first step when you want to day trade an uptrend is characterized by a series of higher highs and higher lows this means that
each Peak and Valley on a chart is higher than the previous one indicating that buyers are in control of the market Downtrends can be identified by looking for lower lows and lower highs in a downtrend each subsequent high and low should be lower than the previous one indicating that sellers are in control of the market the consolidation occurs when the market is neither in an uptrend nor a downtrend this means that the price is moving in a range-bound manner with no clear direction to determine a consolidation look for a series of highs and lows that
Don't show a clear uptrend or downtrend a change in Trend occurs when the market transitions from an uptrend or downtrend to consolidation or vice versa to identify a change in Trend look for a series of lower lows and lower highs that transition to higher highs and higher lows or vice versa it sounds basic but understanding Market structure is essential to any successful day trading activity So day trading success is quite dependent upon being on the right side of the trend but also executing the trade at an optimal time the main problem is that not all
Trends are created equal and there are multiple Trends spread across many many time frames that exist simultaneously how do you determine a strong trend you have two choices to use price action or to use trading indicators many day Traders especially beginners Are drawn to indicators hoping that an indicator will show them when to enter a trade I prefer to rely first on price action I also use indicators in my trading and I will show you later which are the best ones to use but price comes first you don't need an oscillator to tell you if
there's a trend happening price is mainly a consensus between the sellers and the buyers and is influenced by human psychology and by supply and demand now individual candlesticks will Give you a great insight into human psychology if you learn how to analyze them correctly I don't want to bore you with the basics you just have to know that each Candlestick displays the Open high low and close of the time frame the direction upward or downward of the time frame and the range of the time frame the Candlestick has a wide part called the real body
this real body represents the range between the open and the close price And the long thin lines below and above the body are referred to as wigs Tails or Shadows in day trading you need to have momentum on your side momentum refers to the sustained increase or decrease in the price of a market it's a measure of the Velocity at which the price changes and momentum analysis is one of the most important skills a day trader can learn there are two ways of looking at momentum the first one just looks at the Overall trend strength
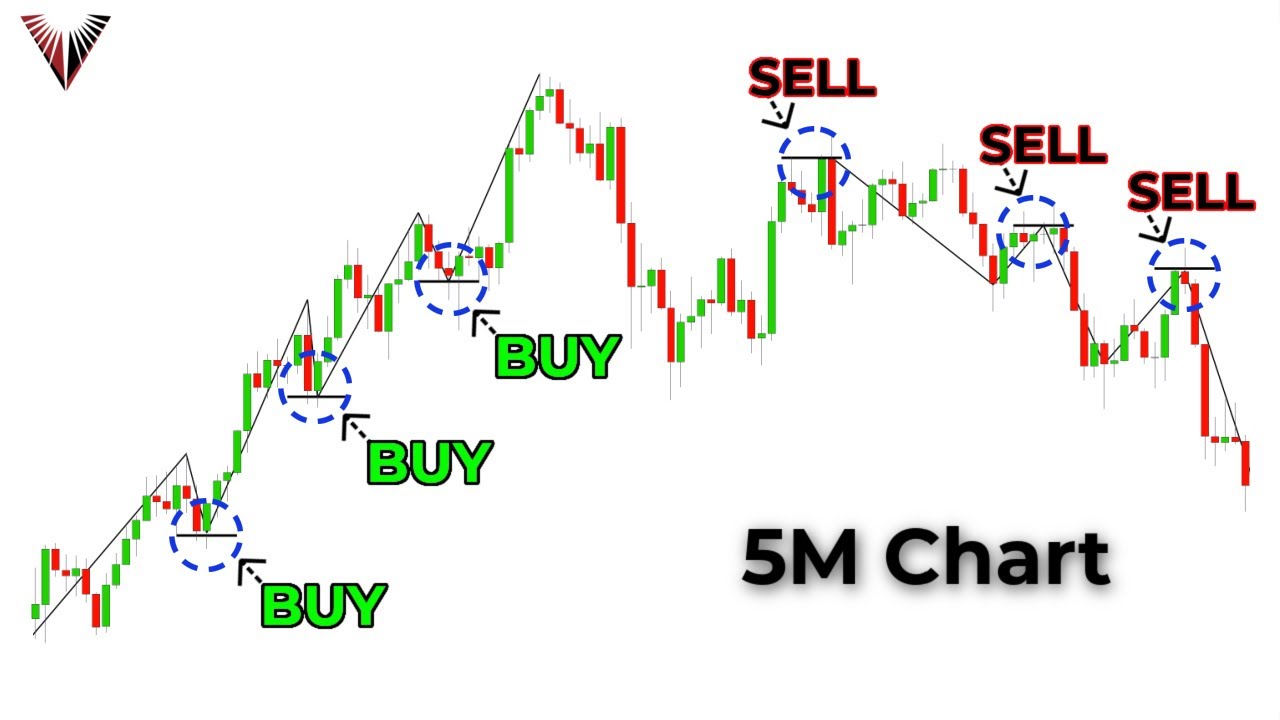
and a price is in a strong or healthy Trend you can say that the momentum is bullish or bearish at the same time momentum also exists when we just look at individual candlesticks so by analyzing recent candlesticks you can determine the price momentum here are the main rules for determining the strength of a trend and its momentum number one the market breaks its previous swing high or low we talked About this before a trend is generally defined by a series of higher highs and higher lows in the case of a bullish trend or a series
of lower highs and lower lows as a bearish trend that's the first condition of a trend number two the distance between swing highs or lows meaning how far the swing highs or lows are apart is a sign of trend strength if the most recent swing high was far above the previous swing High that shows that the market has a lot of buying interest and strength if a swing High forms just barely above the prior swing High the price may still be in an uptrend but is not moving as strongly three most of the candlesticks are
Trend candles in the direction of the trend a trend candle has a body that is greater than 50 percent of the entire bar range if a candle closes above its opening Price it's a bullish Trend candle and if the candle closes below its opening price it's a bearish trend candle so when you day trade and read candlesticks search for Trend candlesticks by analyzing the bodies if you see many recent green Trend candles for example you're probably in a strong uptrend number four there is very little overlap of the bodies of consecutive candles the degree of
overlap with the previous Candle tells you the current market phase and the power of the price bar in a strong Trend there is very little overlap of the bodies of consecutive candles for example in a minor uptrend many candles have lows that are at or just below the closes of the prior candles some candles don't even test the clothes of the prior bar the point is if you find a minimal overlap between a candle and the preceding one it implies urgency Again and this bearish down move many bars have highs that are at or just
above the closes of the prior bar this shows strength and it's an important sign because the market is unable to go higher and it keeps pushing lower number five there are bars with no Wicks or small wicks in either direction this again indicates urgency in the market for example in an uptrend if a green Trend candle opens and immediately Trends up it means Traders were eager to buy it as soon as the prior candle was formed if it closes near its high Traders continue their strong buying in anticipation of new buyers entering right after the
bar closes 6 gaps between the bodies occasionally you will find gaps between the bodies of the candles for example the open of a candle might be above the close of the prior candle in an uptrend or below the close of the prior candle in a downtrend Again a gap is a sign of urgency and a sign of Market strength 7. Trend candles after a gap this is even more powerful not only the market formed a knob Gap like in this example but it continued with a strong Trend bar indicating the conviction of buyers and their
willingness to push price higher 8. no retest of previous breakouts we'll talk about breakouts later but you probably know the classic way to trade Them you must wait for prices to retest the breakout level a retest refers to prices reversing Direction after a break and returning to the breakout level to see if it holds the tendency is for prices to return to the break-off level which should now act as a support and attract buying interest but in a strong Market you will not get a retest the buyers are unwilling to let the price drop lower
number nine no significant trend line Breakouts plotting trend lines on a chart is one of the easiest ways to get a quick idea of a market strand or Direction when drawing trend lines in a downtrend you draw them above the price connecting the high points when you draw trend lines in an uptrend you draw them below the price connecting the low points at least two swing highs or swing lows are needed to draw a trend line in Either direction now a broken trend line is a technical signal that can suggest a change in Trend but
in a strong Trend you don't experience breakouts of significant trend lines number 10 sideways corrections after trendline breakouts in a strong Trend when a trendline breakout occurs there's no momentum behind the move there is sideways price action a sideways drift occurs when the price Trades within a fairly stable range without forming any distinct Trends price action instead oscillates in an horizontal range or Channel with neither the buyers nor sellers taking control of prices 11 small Corrections and sideways pullbacks in an uptrend we have more green candles than red ones this means that the buyers have
more power and are increasingly moving the market upwards Also during a market controlled by buyers the red candles are getting smaller as the sellers can drive the price down so the corrections will be small and in some cases the price section will appear in a sideways range conversely during a market controlled by sellers the green candles are getting smaller again Corrections will be smaller when you compare them with downward waves 12. breakout candles have large bodies and small wigs when the price finds support or resistance in its way it usually manages the push through with
a strong candle a breakout candle that has a large Trend body for example and small leaks or no Wicks is a sign of strength the larger the candle the more likely the breakout will succeed 13 weeks below green candles during uptrends and above red ones during downtrends So in a strong uptrend you will also see a lot of Wicks below the green bars this represents a good signal that the buyers are in control of the market and that are trying to push the prices upwards you will also see a lot of Wicks above the red
bars in a strong downtrend this shows that the sellers are in control and that are successfully pushing the prices downward despite the initial reaction of the buyers I hope you realize that candlesticks Provide a lot of information about who is in control of the market than most Traders realize almost every candle offers important Clues as to where the market is going stay close because in a future module we'll add the volume component for this analysis now I don't want to bore you with a multitude of candlesticks used in day trading when I'm trading I tend
to heavily rely on two special patterns as The entry trigger the first one is the PIN bar a pin bar is a price action pattern which is supposed to Signal a reversal maybe about to take place in a market notice of the red body of the candle is found at the bottom of the Candlestick and the long week is found at the top sometimes the body of the candle will not be found right at the bottom but it will always be found in the bottom half of the Candlestick in the case of a Bullish pin
bar the body of the bullish pin bar is found at the top of the candle and most of the wick is found at the bottom another Candlestick which must be highly important in your day trading activity is the engulfing candle firstly engulfing candlesticks begin and end every movement in the market whenever you see the market go from being in an uptrend to a downtrend at the beginning of that movement an Engulfing Candlestick is present in some shape or form engulfing candles are the result of big money coming into the market usually by large Banks or
other financial institutions this is what makes engulfing candles such a great entry trigger the one defining characteristic of the engulfing candlesticks is they have a large body which is always bigger in size than the body of the candlesticks in immediately before it the engulfing candle wraps Itself around the previous candle the setup begins when we see a large bullish candle which happens to be immediately followed by a bearish candle the second candle being the bearish engulfing one notice of the body of the bearish engulfing one is bigger than the body of the bullish candle seen
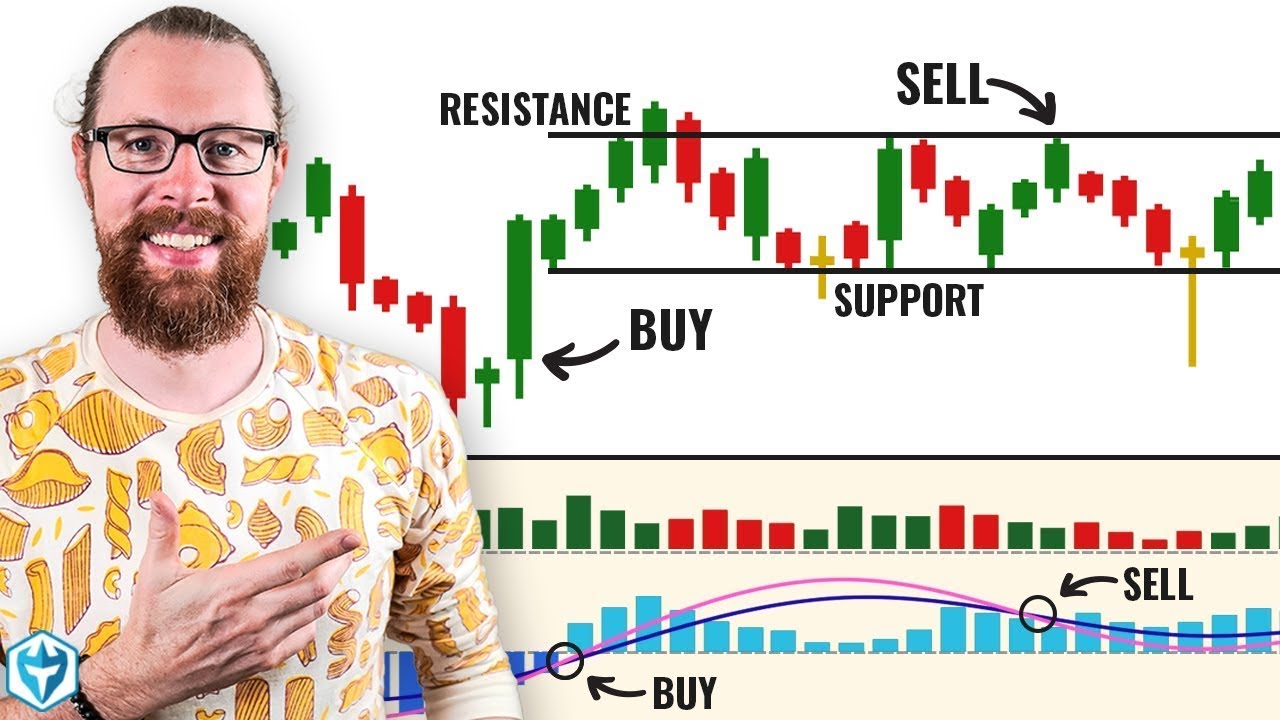
before it if you want to increase your chances to succeed at day trading you must align yourself with big players in a market I do this by using supply and demand when I first started day trading I focused on support and resistance levels these are the specific price points on a chart which are expected to attract the maximum amount of either buying or selling a support is a price area at which you can expect more buyers than sellers a resistance is a price area at which you can expect more sellers than buyers but over the
last years I've slowly Incorporated supply and demand in my day Trading plan this trading approach takes the best of support and resistance and adds the concept of Supply instrument news events speculation and General market action caused different groups of traders to place buy and sell positions resulting in changes to the supply and demand in a market these changes manifest visually as the Rises declines and consolidations you see on your charts when you see price Rising it means demand outweight Supply When you see a price following Supply alt weights demand now changes in Supply and demands
happen when the banks and other big players decide to enter their positions we retail Traders can cause price to rise or fall because we don't have enough money only the smart money with their high buying and selling power can make price move and the banks never Place their full positions all at once their positions are very large so they must break them into smaller pieces and Place each trade individually around a similar price to avoid pushing price away and potentially forcing the entry at the bad price in day trading it is all about finding points
where the banks have initiated positions and then jumping into trades when the price returns to the supply or demand area supply and demand trading is a method where the idea is to find points in the market where the price has made a strong Advance or decline and Mark these areas as supply and demand zones demand zones form when Banks place a large number of buy positions this creates an imbalance and results in the price aggressively moving higher these are the support levels of supply and demand Trading Supply zones are points where the banks place a
significant number of cell positions resulting in price aggressively moving lower these are the resistance points where Price could fall and if price returns to a certain Supply or demand Zone it has a high probability of rejecting these areas so how to identify the best supply and demand areas do they trade here's my process in the first place you look for Sharp Rises and the coins in price these are the first signs that smart money are active you can call them Market imbalances big price shifts in One Direction To find the main zones you look for
fast impulse up moves keep an eye on big green candles Trend candles we talked about them in the previous modules the long bodies and with little to no wicks once you have identified a fast impulse move it becomes a lot easier to find the base of the zone you find the most recent red candle before the impulse move and place a line at its high price and another line at the most recent Swing low that formed at the source of the move some may choose to place the first line at the open price and the
second one at the most recent low you can choose any method you want to find Supply Zones look for fast declines again yellow 4 Trend red candles with long bodies and little or no wicks you then find the most recent up candle before the sharp down move and place a Line at its low price and another line at the most recent swing high that formed at the source of the move in theory price has a high probability of reversing once it returns to the source of the decline before you start day trading supply and demand
there are two key rules you need to understand to find the right zones on the chart and to trade them correctly using your entry method first rule is that all zones rarely work A big misconception is that the longer the market has been away from a supply or demand Zone the better chance the market has of reversing when it eventually reaches the Zone this is wrong recent zones are far more important supply and demand areas which have been created recently are far more effective than zones which were created a long time ago second rule is
to trade only fresh on touch zones another big misconception is The idea that supply and demand zones have the power to cause reversals more than once like support and resistance levels too again this isn't true supply and demand zones are one-time use when price hits a Zone and reverses the Zone loses its power the probability it will cause another reversal in the future is lower foreign ERS get confused between the concepts of supply and demand and support and Resistance so let's talk about the difference between these two concepts supply and demand zones are advanced concepts
of support and resistance they both indicate points where the price can reverse the big difference between the two is that support and resistance often works on historical older and tested levels while supply and demand especially on Fresh levels support and resistance trading is particularly strong in multiple touches Of the previous levels when you day trade based on support and resistance you mainly look for points where multiple reversals started from similar prices here's a level with multiple reversals you can see that each of the reversals originated from prices which are quite close to one another so
a support level must be found somewhere close to where this price movement started now when trading supply And demand things are different if you want to day trade using this concept you'll mainly look for new zones a supply or demand zones is a fresh untouched area where price spent less time you don't watch in the history of a market for the validity of the zone you don't wait for multiple retests of the same area another difference if price will break the support Zone then the support will become resistance and vice versa this is A common
day trading strategy which is actually very powerful when traded correctly we'll talk about this later but in the case of supply and demand this concept doesn't apply a supply Zone which is broken doesn't turn into a demand Zone I would even say that all support and resistance lines were originally supplies or demand zones this is how support and resistance were created they are essentially the Confirmed supply and demand levels so supply and demand are fresh levels or zones where a price has not been determined yet therefore these levels are valid to trade support and resistance
are levels which are already confirmed probably the biggest problem when trading support and resistance levels is the fact that price will often fail to turn exactly on the level itself you know it so well you expect the perfect Bounce when you place your level but oftentimes price will either remove slightly beyond the level before reversing all will reverse before touching the level and that's the main advantage of supply and demand they offer you a bigger area at which the market should reverse you don't have to find an entry at an exact point you have a
whole Zone you can use to place your positions Now there are four types of supply and demand considering how the price approach the supply and demand Zone and how it left the Zone again I've labeled them into continuation structures and reversal structures continuation price structures include the drop base drop and the rally base rally patterns and the reversal price structures are the drop base rally and the rally based drop patterns the rally base rally is a type of demand Zone which forms during an up move being a continuation pattern the market structure is very simple
we first have a rally then a consolidation or the base and finally another rally which creates the demand Zone a rally based rally will always form a demand Zone it can never create a supply Zone the drop based drop is a type of Supply Zone which forms during a down move also being a continuation pattern So a drop based drop will always form a supply Zone a Zone which if the market returns to should push the price back in the direction of the movement that created the zone the drop base rally is a structure which
forms a demand Zone in a market these zones differ from the first price structures mainly because of their location in the market if the rally based rally and the drop based Drop Zones only formed during trending Movements the drop-based rally zones will only be found when the market changes from moving down to moving up it's a reversal pattern the rally based Drop Zones form when the market reverses from moving higher to moving lower when they are completed a supply Zone will have formed in a market which should cause the market to fall again A reversal
structure understood the basic principles of supply and demand your next step is to Learn to read the volume well volume spread analysis is the study of price in relation to its corresponding volume it tries to find out the differences between supply and demand in day trading VSA is very important because it tracks down the professional activity the moves of the smart money first you need to know the components of the volume spread analysis first is the spread the spread is the difference between the opening and closing of the Price volume is the number of transactions
during a time interval then we have bearish and bullish volume bearish volume shows bearish activity bullish volume shows bullish activity then we have above average high volume this is the highest volume in the current session Which is higher than the average volume and then we have the ultra high volume it's the highest volume in the current session this indicator tells you whether the Volume is ultra high high low or average it's called the volume spread for VSA it's very easy to read volume using it red means ultra high volume yellow means high volume green is
average volume and blue is low volume now VSA can seem difficult but I'll try to keep it as simple as possible there are two major applications of VSA namely sign of strength and sign of weakness sign of strength occurs when the supply Is drying up after a downtrend and demand increases meaning more buyers come in and there are less sellers in the market this imbalance between supply and demand causes the market to rise sign of weakness occurs when demand is drying up after an uptrend and Supply increases in other words more sellers come in and
there are less buyers in the market this imbalance between supply and demand causes the market to fall When I'm day trading I'm looking for different signals of sign of strength or sign of weakness VSA goes hand in hand with a well-known analysis method developed by Richard Wyckoff Wyckoff stated that changes in a market price are the result of an effort which is represented by the trading volume so effort volume versus the result price if the price action is in harmony with the volume there is a good chance the Trend will continue but if the volume
in price diverged significantly the market trend is likely to stop or even change direction based on this here are the best sign of strength volume patterns for day trading first is the downfrost the downtrust appears as a bullish pin bar or a doji bar having an ultra high volume or above average volume spread of the down frostbar is extremely low meanwhile the volume is relatively High VSA implies that if the spread is low then the volume should also be low but in this case there is a Divergence between spread and volume so there is more
demand than Supply potentially causing price to rise in the near future then we have the selling climax the selling climax appears as a high spread bearish candle having a noticeable downward rejection week but on ultra high or above average high volume The signals that the market could rise in the future because there is more demand than Supply the selling climax signal could have a downward Wick whose size is around 25 to 50 percent of the candle's body size then we have bearish effort lower than the bearish result this appears as a high spread bearish candle
whose spread is larger than the previous candle spread but its volume is lower than the previous scandal's volume An effort meaning volume has not been made but there is a result the spread this disagreement between price and volume increases demand and reduces Supply causing the market to potentially rise in the future next is the bearish effort higher than the bearish result disappears as a low spread bearish gamble having spread lower than the previous Scandal spread but its volume is higher than the previous candle's Volume an effort has been made but there is no result in
this case there's a disagreement between volume and price which might rise in the near future we have also done no Supply bar this appears as a low spread bearish candle having a downward wake whose volume is lower than the previous two candles volumes no Supply bar means that there is a lack Of Supply causing price to rise in the future an all Supply bar is a continuation signal and is effective only if it appears in the direction of the trend there are other VSA sign of strength signals but from my experience these are the most
effective ones to incorporate in your day trading strategy now let's talk about the different types of sign of weakness first is the up thrust the up Frost Appears as a bearish pin bar or doji bar having an ultra high volume or above average volume the spread of the up thrust bar is extremely low while the volume is relatively High in this case there's a disagreement between spread and volume which signifies that there is more Supply than demand potentially causing price to fall in the near future next is the buying climax the buying Climax appears as
a high spread bullish candle having a noticeable upward rejection week projected on ultra high or above average high volume this signals that the market could decrease soon because there is more Supply than demand buying climax could also have an upward week representing 25 to 50 percent of the candle's body size then we have the bullish effort lower than the bullish result this is a high spread bullish candle whose spread is Larger than the previous candle spread but its volume is lower than the previous scandal's volume VSA states that if there has been no effort made
then there should not be the result these Divergence between price and volume increases Supply and reduces demand causing the market to decrease in the future then we have the bullish effort higher than the bullish result This is a low spread bullish candle having spread lower than the previous candle spread but its volume is higher than the previous candle's volume VSA suggests that if an effort has been made then there must be a result in this case there's a disagreement between price and volume resulting Supply to become more than demand and causing price to fall in
the near future and then we have the no demand bar this is a low spread bullish candle having Upward week whose volume is lower than the previous two candles volumes the no demand bar means that there is a lack of demand and Supply is overpowering demand causing price to fall in the future no demand is a continuation signal and not a reversal signal and is effective only if it appears after bearish momentum in the direction of the trend there are other VSA patterns you could follow but for now stick with this if you want to
learn more about VSA Check out this video after you finish watching this one analyzing VSA was a really game-changing moment in my day trading it will be hard at first but with time you'll see the volume patterns more clearly volume spread analysis is one of the most powerful day trading strategies which reveal the true sentiment in the order flow of the market most day Traders are using lagging indicators in their analysis and their Lagging signals can only be known after the event don't get me wrong this doesn't make them useless they can clarify and confirm
your bias but leading indicators or signals are the ones you should consider adding in your technical analysis leaning indicators give signals when the trend is about to start whereas lagging indicators are those which follow price action my favorite leading indicator is the volume we talked about it in the previous Module because it communicates the involvements of smart money volume spread for VSA indicator became an important tool in my day trading routine supply and demand concept is another leading tool from the multitude of lagging indicators I also use a couple of them but the most important
one is the view up so let's talk about it the volume weighted average price gives you the average price a market has Traded throughout the day based on both volume and price and this tool is important especially in day trading the viewer appears as a single line on intraday charts similar to a moving average view up is a simple indicator the price is either above it or below it that's why it's an easy measurement on whether a market is cheap or expensive on the day you can use it to help you pinpoint intelligent entry and
exit points for Your day trades and at the same time it can help you to determine Trend changes often quicker than a moving average for day trading you can read The View up to generate buy and sell signals this can be simply done by comparing the relationship between view up and the current market price if the current market price exceeds a rising view up this suggests the Buy Signal if the price Falls below a falling view up it suggests a sell Signal View up can also be used to detect Trends and changes in price if
price action stays above the view up this signals that the price is in a general uptrend if price action stays below the view up they signals a general downtrend and using v-wop to identify support and resistance levels can be another useful function in day trading you can use view app to identify dynamic levels and buy when price retraces testing the level And sell when price rejects a dynamic resistance area mostly Traders are using the daily view up but you can also day trade based on the weekly and even monthly view up weekly view up shows
you the trend depending on where the price is trading above or below in relation to the view upline again one of the simplest uses of the weekly view up is for finding pullback opportunities View outline acts as a support if the price is trading above it and as a resistance if the price is trading below it [Music] anchored view up is another variation which has an edge over the default version I'm using trading View and you can find the anchored view up in trendline tools the anchored view obtains its calculations to a specific price bar
you Choose evolved view up always starts with the first bar of the day and ends with the final bar of the day but in some situations you would prefer to analyze the view of line based on another starting point and be able to extend that view of line beyond the end of the trading day anchored v-wop allows you to specify the price bar where calculations begin making it easy to see whether buyers or Sellers have been in charge since a very specific point in time with anchored view up you choose a first candle you are
anchoring the indicator to that bar you have full control and you get flexible starting and ending points so how do they trade using the anchored view up a good strategy is to look for key price swings or turning points in recent price action to Anchor The View up you basically Place The View up on these Key levels the most common strategy using the anchored view up is the pullback trade a pullback occurs when the price that's on an extended move upward or downward makes a small movement in the opposite direction towards the anchored view up
line to trade a pullback setup you find an uptrend with price making higher highs and higher lows then you anchor The View up on a key pivot Price trades of course above the angle view up and you patiently wait for a price to make a pullback to the downside returning to the view of line This is a chance to buy the market in this Zone you can find a demand area or a VSA pattern as an entry look how price reacted to the anchored view upline the first pullback after we applied the line was a
perfect bounce rate another day trading strategy is to Anchor The View up on the highest volume candle I said it before high volume means there's an interest in the market and if it's combined with a move higher in price then it's often used as a signal of strong upward momentum in this example we identified the highest volume we added the anchored view up and the line immediately offered several opportunities to buy the dip You go with the flow of the highest volume and try to catch another swing to the upside when price comes back to
the anchored view up as a standalone study or when viewed with other oscillators the anchored view up is a must use tool in day trading pivot Points are my favorite day trading indicators pivots are fixed support and resistance levels based on the high low and close of the previous day unlike lagging indicators pivots don't change As you change your time frame once you plot them on your chart at the market opening they remain there until the market closes and one more important aspect pivots are being used by big players in recent years I focused on
the central pivot range I came to know about the central pivot range concept after reading the logical Trader by Mark Fisher CPR is a range of three lines one above And one below the central Pivot Point the fundamental idea behind this indicator is that a particular trading range captures everything about a market sentiment thus this range can be used to predict the price movement of the following days so how to read the price action using the central pivot range when the CPR makes higher highs meaning the CPR is higher than the previous day that indicates
that the market is in an Uptrend when the CPR makes lower lows is lower compared to the previous day this indicates that the market is in a downtrend as long as the price is above the CPR it's generally known as a bullish day and as long as the price is trading below the CPR we are in a bearish day The Wider the central pivot range the more difficult for the price to break the area this basically means that wider Central pivot ranges are more powerful than a narrow waist CPR have a look at this chart
this was a wide CPR day and when price retraced that area it found support and was unable to go below it happened when the CPR was narrow the price broke on both sides and no clear Trend during that day just sideways price movement and lots of consolidation so if the CPR is too narrow it's unlikely it will offer a solid support To resistance area also when the central pivot range is wider often but not always such days are range days where price moves from one range to another throughout the day look at this example we
had a strong move upward so the next day the CPR was quite wide we had a range day around this area and remember the previous rule a wide range means that is more difficult for the price to break the area Another observation is that the narrow Central pivot range can lead to a big trending day and the wide Central pivot range can lead to quiet and range bound days in this example you can see a very narrow range day which lead to a huge move during the day observe how the price was trending in One
Direction with lots of momentum and of course after such a strong trending day the next day was a wide range CPR with sideways price Action this is an efficient way to analyze price quite different from the classic price action techniques and there's another high probability day trading strategy and that is the fresh Central pivot range if on any given day price didn't touch its CPR it will be considered as a fresh CPR for the next coming two or three days here's an example the price made an aggressive move downward and the next day price action
didn't touch its CPR so That was a fresh CPR day an important area to keep an eye on for the next several days CPR is a powerful support and resistance area essentially each pullback to the pivot range is a buying opportunity within an uptrend and the selling opportunity in a downtrend at the beginning of the day the first step you need to take is to analyze the position of the CPR relative to the previous day If it's higher you know that during the day you'll be searching for long entries if it's lower you want to
short the market if the CPR is wide then the price will most likely find support or resistance at the CPR but be prepared for ranging conditions if the CPR is narrow you can have a strong trending day but at the same time the CPR may not offer much support or resistance [Music] as I said before a lot of day Traders are using lagging indicators and then they complain that day trading is hard if you use RSI stochastic or macd and try to find overbought and oversold signals then I agree you won't enjoy day trading much
I also focused on this lagging indicators when I started a day trade no shame in that but nowadays when I'm analyzing a lagging tool I mainly look for divergences because they offer Leading signals I use the stochastic indicator but you can replace it with any oscillator you prefer in day trading divergences should be one of your most important tools because they signal momentum coming into the main Trend or indicate a possible reversal when the trend is nearly over again leading signals a Divergence occurs when the price and the indicator provide conflicting Signals by moving in
opposite directions there are two types of divergences regular and hidden a regular bearish Divergence appears during an uptrend when the price is making higher highs by the indicator the stochastic indicates a lower high that's an indication of Market exhaustion and a possible sign of Market reversal or at least a short-term correction a regular bullish Divergence appears during a downtrend when the price is Making lower lows but the oscillator records higher lows thus the regular bullish Divergence suggests a possible Market reversal or a short-term correction in a bullish hidden Divergence the oscillator makes lower lows but
the price makes either a higher low or a double bottom low this type of pattern occurs mainly during uptrend Corrections in this example the price was in a very Strong upward Trend and recorded an important correction the price failed to record new lows enclosed higher than the previous downward swing if we look at the oscillator it recorded a lower low thus forming a hidden Divergence and signaling that a possible upward movement is on the cards in a bearish hidden Divergence the oscillator makes higher Highs but the price makes either lower price or double bottom highs
This type of pattern occurs mainly during downtrend Corrections in this example after a strong uptrend the recent price action indicated a downward momentum with price making lower highs the oscillator recorded higher highs thus forming a hidden Divergence with regular divergences the oscillators indicate momentum shift and thus points toward the reversal of the trend this implies that the regular Divergence warns that the end of the trend is Expected hidden divergences signal momentum coming into the main Trend suggesting a possible continuation in the main direction of the trend the reason why so many day Traders fail when
taking Divergent signals is because they take counter Trend signals they spot a regular Divergence and immediately think the market will reverse a smarter way to trade divergences is to identify the main Trend maybe with price action maybe with a view up or the CPR indicator and find divergences that go along with the trend in the case of an upward Trend you ignore bearish regular divergences those appearing on the top of the oscillator and search for bullish regular divergences you also look for bullish hidden divergences in the case of a downtrend you ignore bullish regular divergences
and search For bearish regular divergences and bearish hidden divergences and this way you have a higher probability of a successful Divergence trade [Music] the location of the Divergence is very important adding the filter of location can usually enhance the quality of your Divergent signals instead of taking trades just because of a Divergent signal you'd wait for the price to move Into a previous Supply or demand Zone and only then look for divergences and Trend shifts to time your entries in this example you see an uptrend with two divergences however the first one completely failed and
the second one resulted in a massive winner what was the difference if we analyzed a big picture we see that the first Divergence happened in the middle of nowhere And the second Divergence formed at the demand area as a day trader you must first identify your support and resistance zones or supply and demand areas and then let price come to you such an approach will impact your performance in a big way volume brings many advantages and could be of tremendous help when it comes to analyzing divergences if the price is rising in an uptrend a
Divergence is visible but the volume is reducing it may show that there is little interest in a market and the price May reverse similarly when the price is rapidly declining and forms a Divergence but the volume is low it could mean that the institutional Traders are not interested in the price Direction so the price might soon reverse to the upside a high volume after the Divergence Usually indicates more interest in the market and the presence of institutional Traders a Divergence confirmed by a rising volume represents one of the safest trades I hope you see how
supply and demand volume and divergences are interconnected I know that many day Traders are dismissing Divergent signals but from my experience combined with other leading tools they can offer very reliable day trading setups Breakouts can be a very powerful tool in your day trading Arsenal allowing you to capitalize on strong Market movements first let's start with the basics a breakout occurs when the price breaks through a key level of support or resistance this can be a bullish breakout where the price breaks through a resistance level or a bearish breakout where the price breaks through a
support level now not all breakouts are created equal One of the biggest challenges of trading breakouts is avoiding false ones a false breakout is when the price temporarily breaks through a key level only to quickly reverse and Retreat back into its previous range this could be caused by a lack of follow through from the buyers or sellers or by market manipulation this can be frustrating for day Traders as they lead to losses and missed opportunities so the Big Challenge in day trading is knowing how To avoid false breakouts one key strategy is to wait for
confirmation this means waiting for the price to close above or below the key level or waiting for a strong search in volume to confirm the Breakout another tip most Traders when looking to trade a retest will Mark the point where a breakout has occurred using horizontal lines and this is one of the reasons why you fail at Trading retests a far better way of marking the points is using areas By marking the breakout Point as an area instead of a line you give yourself the benefit of not having to guess the breakout point if there
are several highs for example and you mark the level using a line then you won't be able to know which highs the market is going to return to by having a Zone you can cover multiple highs it's much easier this way additionally it can be helpful to look at indicators to confirm the Breakout So analyze the view up and the central pivot range on the other hand a valid break of the curse when the price breaks through a key level and continues to move in the same direction to identify a valid breakout look for a
significant surge in volume and price momentum as well as confirmation from the same indicators one popular strategy for trading breakouts is the break and read test technique this involves waiting for the Price to break through a key level then waiting for a retest of the level before entering a trade in the direction of the Breakout in this example the initial move higher and through the resistance level must be followed by a strong and Rising volume it takes effort for the market to move away the same applies here and you should see this move reflected in
the volume of the next few bars if you don't see this then you know it's Either a trap set by the smart money or there is simply no interest from Market participants to take the market higher at this stage if it's a valid move then the volumes on the initial break will be well above average and Rising at this stage you want to see the market pull back to test the former resistance level but very important this should be followed with low or falling volume since we are now developing a bullish Trend higher and expect
to see rising market with Rising volume so very important you want to see strong and Rising volume on the breakout and low volume on the pullback then at the retest level you want to see another increase in volume it isn't enough to Simply see the market touch a broken level as a new supporter resistance when the market revisits a level after breaking it you want to see some sort of confirmation that the Previous support level turned into resistance and vice versa a previous resistance turned into support a simple method to enter into trades at a
retest of the breakout level is by using price action more specifically using Candlestick patterns such as engulfing candles or pin bars we talked about them in a previous module here we have a breakout area when you see a market breaking a support level see if there are any Candlestick Patterns you can use as an entry into the trade here we can see that when the market reached the area a bearish engulfing candle formed volume confirmed a move high volume on the breakout and low volume during the pullback so a valid short signal the beam bar
is one of the most powerful price action signals during retests and the signal rely the most in my trading a pin bar signals that a reversal may be about to take place in the price action Trading pinball signals with support and resistance and volume confirmation is perhaps one of the most effective ways to day trade the very best pinballs stick out at the retest level the bigger the rejection and the bigger the pin bar the more powerful the signal the best beam bars are the large and obvious candles that as soon as you flick over
to your chart you notice them high probability pin bar at the retest level needs to have the weak sticking Out from all other candles and above average volume to confirm the active participation at the retest risk management and trading discipline usually rank very low on the priorities list of most day Traders you shouldn't neglect this topic let me share my best tips that will help you improve your trade and risk management first tip is the most obvious one you must be aware of the risk you will take on each trade and the reward you will
receive prior to The trade execution this means knowing where to place your stops and your profit targets a trade should only be placed when the anticipated reward from the trade matches or exceeds the risk being taken assessing the risk factor should be easy you basically determine a portion of your Capital to be risked on each trade a fixed percentage of your capital for example one or two percent per trade is decent based on this percentage you Determine the invalidation point of the trade the point at which your assumption has been proven wrong this is the
location to place your stop loss and again if you risk one percent of your Capital your reward must be higher than this second tip is to stop closing trades without a good reason have you ever exited a trade due to a fear of giving back unrealized profits only to see the market continue in your intended Direction I'm sure you have this is something everyday Trader has to master the ability to control emotions in a way that allows you to trade based on pure technical analysis one way to keep your emotions in check if you feel
the urge to close a position early is to Simply ask yourself why am I causing this position if your answer is anything other than a technical one you are likely making a decision based on emotions Another tricky component to risk management is the ability to control exposure with correlated traits when it comes to money and risk management this means that trading instruments which are positively correlated will lead to increased risk let's say you trade Forex you spot a demand Zone on pound dollar and you decide to enter a long position at the same time you
also see a bullish Divergence on the pound Yen and you also Decide to take the trade when these trades are opened then you will have two correlated traits that could either double your win potential if the bond keeps rallying or double your losses if the bond suddenly sells off this is why it's essential to avoid opening positions for highly correlated instruments another important tip understand the impact of Leverage on your risk Management Leverage is simply a way of trading with more money than you actually have in your account now using leverage can maximize gains however
it can also increase losses too if you are leveraged and you make a profit your returns are magnified very quickly but at the opposite side losses will erode your account just as quickly and too many people have lost their entire trading accounts just because of Their High Leverage remember the greater the amount of Leverage on the capital you apply the higher the risk that you will assume if you are conservative and don't like taking many risks or if you are still learning how to trade a lower level of Leverage like five to one or tenth
one might be more appropriate keeping your position small and limiting the amount of capital for each position is a good start to learning the proper Way to manage Leverage another tip keep a journal and review your trades most Traders will never look at their trades again after they have caused them they will just move on to the next trade and forget about what they did before giving a trading journal offers two potential benefits first it provides a place where you can come back to and revisit all your best trades to see what you have done
wrong and how you developed over time And second it will keep you from making mistakes during your trading sessions at the end of each week and month go back and see what you did notice common problems and spot your strengths these observations can help you exploit your strengths and highlight the areas you need to work on another tip is to give your stop-loss room to breathe most day Traders misunderstand what the stop loss really is At its core it's the price where your trade idea is no longer valid but placing stops too close too close
to the current price is one of the most common mistakes day Traders make how many times have you been right about the Market's Direction your trade signal was right but you still lost money somehow this keeps happening to you because your stop loss is too small when your day trade the market can move unpredictable and if you place your stop Too tight there is a high chance that you will be stopped out before the price continues to go in your direction position sizing also plays an important role in this equation my advice lower your position
size and slightly increase your stop loss to give the price enough room to breathe when you day trade you must have a trading rules checklist but checklist must State all your entry criteria underneath each other And every time you are about to enter a trade you revisit your checklist and check off the things you can see on your charts with a checklist it becomes obvious right away if a trade really matches your criteria or not again if you can visually see that the trade that you are about to take is breaking your rules you are
most likely to avoid those painful mistakes here's a simple example of a day trading Checklist is the market trending or ranging is there a significant level of support or resistance or Supply or demand nearby do you have a clear entry trigger do you have validation from the volume is there a confirmation from The View up or the central pivot range do you see a Divergence do you have a decent risk to reward Ratio or do you have the proper mindset to trade another tip is to have realistic take profit targets many day Traders put way
Too much emphasis on having higher take profit levels and don't understand that this doesn't tell you anything about the quality of your strategy you'll end up setting unrealistic profit targets far away from your interests thinking that by using a wider take profit you can increase your risk to reward ratio using a wider take profit means device won't be able to reach the level as easily and if your stop-loss strategy isn't on point you will most likely see A decline in your win rate you need to be able to determine a suitable profit Target one that
gives you a realistic profit Target but also gives you a sensible risk reward this is one of the biggest lessons in day trading find Confluence on your charts the more technical tools that validate the price move or simply confirm the significance of a price level the stronger that level is confluences when there is more than One signal coming together at the same point in a market when you find the setup that has the same signal from multiple methodologies you have found a high probability trading opportunity and there is a high chance of the trade working
out successfully conference can be found when you combine the different elements we've discussed price patterns view up pivots support or resistance supply and demand and volume When some of these tools meet at a single location on the chart it is considered a point of confidence in this way you are combining more than one trading technique to increase your odds of winning on your trades when they trading there are too many markets to keep track of too many strategies to backtest and you need to narrow it down when I first started trading Forex I used to
have a template with over 20 currencies and I tried to Monitor all of them you know the outcome many missed trades which resulted in many poor trades taken out of frustration or fomo so you need to narrow it down follow three markets at most you have a lot of things to cover when day trading Market selection and preparation pattern recognition risk reward indicators volume position size entry level price action trade management it's easy to become overwhelmed again narrow it down And you don't need to trade the entire day there is enough money to be made
trading only a few times each day and you should come up with a suitable trading schedule that caters to your needs and trading goals you don't need to sit in front of the screen all day I know that there's a tendency to try to squeeze every dollar out of the trading day so you don't miss any profit but when you have reached your profit Target or you stop seeing setups simply stop Trading I now have a simple role when I'm day trading I must close my positions at the end of the day even at all
you should never turn a day trade into a swing trade and hold it overnight you know the feeling you open a trade hoping for a quick profit and instead of closing it you find yourself justifying staying in a bad trade the second day this is one of the deadliest scenes a day trader can make you need to change Your mindset think about it you can always get back in but it's hard to recover from a big loss so if you're wrong take the loss and come back when the timing is better in my first years
I used to average down on losing trades imagine you buy 10 shares of a company at fifty dollars in the anticipation of selling them at around 60 dollars instead the price breaks the support level and drops to forty dollars you have lost the trade And you should have been stopped out but instead of accepting the loss and moving on you buy another 10 shares at forty dollars it's unlikely that the price will hit your initial Target of 60 dollars but now you're hoping the price will rally back to 45 or 50 at 50 dollars you
sell all of your shares and you even recorded some profits it's very tempting to average down on a losing trade with the hope of getting out that break even but you shouldn't do it Averaging down or losing trade is a recipe for wiping out your account ninety percent of the time maybe you will profit when you average down but that 10 of the time you are wrong you will blow up your account another common mistake is to day trade low conviction trades because you can't find anything better if you take more trades than your strategy
dictates because you can't find high probability setups that's a warning Sign this is often a result of boredom or a lack of discipline since this trades occur outside of your trading plan they are less likely to perform well trade only what your strategy dictates if the market is quiet or the trade entry conditions are not there just wait out this is one of the most important tips don't believe anything you heard until you have tested and try it out for Yourself what used to work two years ago on Forex Market may not work today on
the stock market a strategy I use on the 15 minute time frame on Amazon may not work for you on a 5-minute chart of Euro USD that's a common mistake among day Traders they don't understand that different strategies work on different markets you only find out what works for you by rigorous testing and Analysis back testing is the most underutilized Weapon in day trading it allows you to witness how your plan would have theoretically performed had you been trading it for the past months with this information you can objectively confirm whether or not your trading
plan will make you money in the future so don't ignore back testing and forward testing now let's be clear day trading can be profitable but it isn't a get rich quick scheme day trading can be simple but Don't make the mistake of thinking it's that easy I know that there are many websites that try to tell you differently that you just have to read about it for a couple of days and then magically you'll become a day trader so let's be realistic you won't become an instant millionaire overnight in this course I wanted you to
learn the correct Foundation facts secrets and the concepts that actually work in day trading but in order to make The most out of this trading course you have to adapt and adjust these Concepts to what you might already know making money with day trading is possible but it requires some time discipline effort and commitment on your part if you watch the full day training course and learn something new please show your support by giving us a like it goes a long way and if you haven't watched our previous trading course about technical analysis you definitely
Must watch it either and check out our Academy program if you want to further level up your Trading until next time