large players or Banker funds are often referred to as whales this is because when these Banker funds open large positions it can heavily affect the price action therefore an indicator was created that tracks the complete model of the banker flow operation Cycles allowing you to gain insights into the movements of these whales and potentially enter into profitable positions based on the information the indicator we are talking about is the banker fund flow indicator this indicator not only reveals where the price is likely to move but also provides valuable insights into the inflow and outflow of
money in the market we will be showing you exactly how the indicator can be read methods for entering into positions with it along with a strategy that utilizes the indicator let's first add the indicator to the Chart head over to the indicator search Tab and search for the banker fund flow indicator select the indicator made by black hat and add it to the Chart as you can see the banker fund flow indicator has now been added to the chart now let's change the indicator settings to do this navigate to the banker fund flow indicator settings
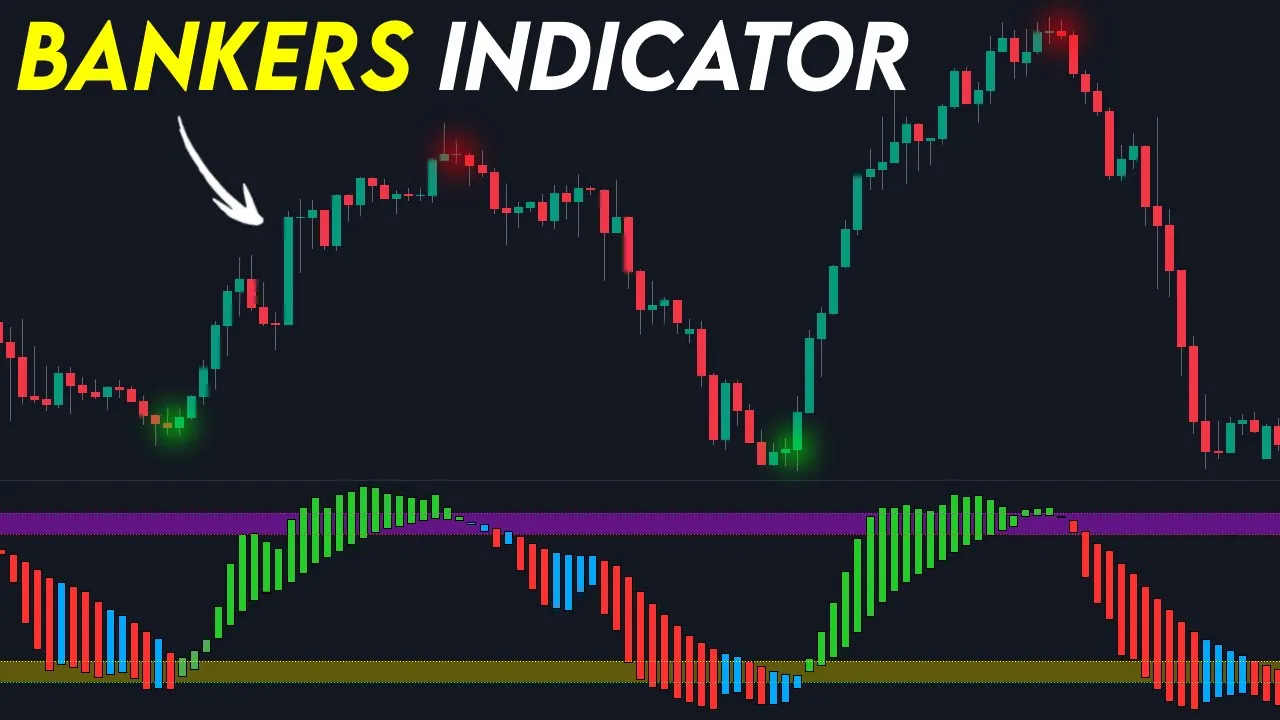
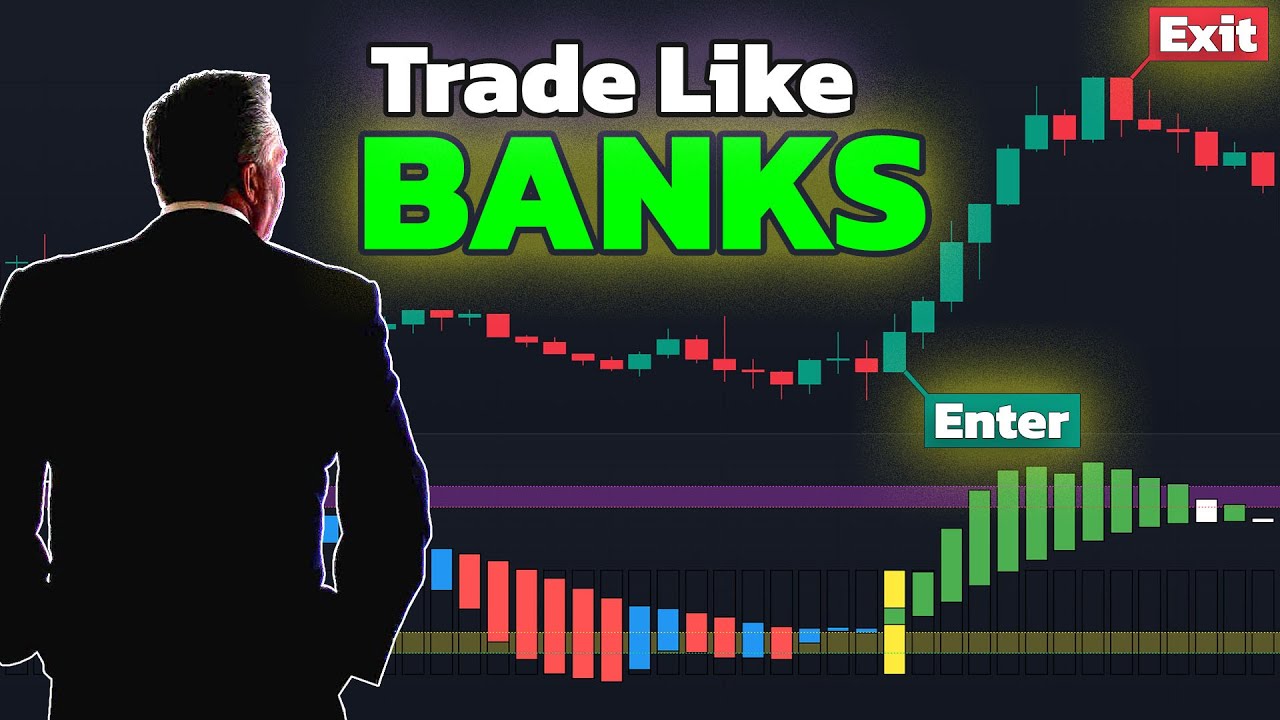
tab as you can see the input settings can't be changed therefore we will only be changing the style settings of the indicator we will be unticking the upper plot candle checkbox that was all that we needed to do let's first understand what the components of the indicator are the first component of the indicator is the threshold lines which are characterized by the horizontal yellow and Purple colors which play a crucial role in this indicator these lines act as key levels that indicate the threshold for significant fund flows within the market the yellow threshold line represents
the lower level indicating a potential surge in buying activity initiated by the banker funds on the other hand the purple threshold line represents the upper level implying a potential increase in selling pressure from these influential players by monitoring the movement of the indicator in relation to these threshold lines Traders can gain insights into the overall Market sentiment and the participation of Banker funds moving on to the candlesticks plotted by the indicator each holds valuable information about the Dynamics of the banker fund flow Trend the first Candlestick of interest is the green one which signifies an
increase in the position of the banker this green Candlestick suggests that the banker funds are accumulating positions indicating a potential bullish sentiment or an upward Trend in the Market conversely the white Candlestick represents a decrease in the position of the banker when this Candlestick is plotted it indicates that the banker funds are reducing their positions possibly implying a bearish sentiment or a downward Trend in the market next we have the Intriguing blue Candlestick whenever a blue Candlestick is plotted it serves as an important signal for Traders this particular Candlestick indicates a weak Rebound in the
banker fund Trend suggesting a relatively weak or temporary recovery it signifies that although there might be a slight uptick in the fund flow it might not be strong enough to support a sustained upward movement in the market finally we have the red candlesticks when a red Candlestick is plotted it serves as a strong indication of a potential reversal or a bearish trend in the banker fund flow this is because it generally indicates that the banker fund is exiting from the position the appearance of a red Candlestick suggests that the selling and exit pressure from the
banker funds has intensified leading to a decline in positions and a shift in Market sentiment toward the downside now let's take a look at how the indicator can be used to enter into positions the first method involves looking for the candlesticks on the banker fund flow oscillator to switch its colors when the color on the banker fund flow indicator transitions from blue or red to Green while being below or at the yellow threshold line it indicates a favorable buying opportunity this color change suggests a potential shift in the market sentiment with buying pressure gaining strength
and signaling a bullish Market bias Traders can consider entering a long position when they observe this color switch As It aligns with the indication of increased buying activity from the banker funds conversely when the color of the candlesticks on the banker fund flow oscillator switches from green to red or blue while being at or above the fuchsia colored threshold line it suggests a suitable opportunity to enter into a sell position this color change represents a potential increase in selling pressure from the influential Banker funds indicating a bearish market sentiment Traders can interpret this color switch
as a signal to capitalize on downward price movements and consider initiating short positions another method that is frequently used for reading the indicator involves looking for differences between the price action and the banker fund flow indicator in this case we can see that while the price is making higher highs the bank fund oscillator is making lower highs this indicates that there is a bearish Divergence forming between the price action and the banker fund flow indicator we can also see that the candlesticks on the banker fund flow have switched to Red because of these signals it
is likely for the price to make a bearish move if we take a look at how the price action played out we can see that this indeed was the case in this case we can see that the price made a strong bearish move causing for a lower low to be created despite this we can see that the banker fund flow oscillator has made higher lows indicating that there is a bullish Divergence forming combining this with the fact that the candlesticks recently switched from red to Green it becomes likely that the price will be pushed in
the upward direction if we look at the price action after this setup occurred we can see that the price indeed ended up moving in the upward Direction while the indicator is already quite profitable you might have noticed that the indicator seems to provide more false signals when there is a low amount ount of volume in the market or when the price is ranging because of this we will be adding a few extra indicators to the chart in order to create a full strategy that utilizes the banker fund flow indicator the first indicator we'll be adding
to the chart is the whole Suite indicator by in silico but before that if you are looking for a crypto exchange where you can hold or day trade crypto then check out by bit they currently have some of the lowest fees along with many trading possibilities such as spot derivatives nft and even options trading sign up via the link in the description to get up to a $30,000 sign up bonus along with zero maker fees for the first 30 days navigate to the indicator search Tab and search for whole Suite select the indicator made by
en silico and add it to the Chart the next indicator we will be adding to the chart is the volume oscillator search for the volume oscillator indicator and select the indicator made by trading view now let's change the setting of the indicators the first settings will change are for the volume oscillator navigate to the volume oscillator's settings tab and click on the style tab here we will be changing the color of the volume line now let's change the whole Suite settings head over to the input settings of the indicator here we will be changing the
length from 55 to the Fibonacci number of 34 in order to identify shorter term trends that was all that we needed to do now let's take a look at how we will be combining the indicators first we will be using the whole Suite indicator to provide insights into the short-term Trend by analyzing the whole Suite indicator we can identify the direction of the Market's momentum helping us determine whether the trend is bullish or bearish next our attention will shift to the banker fund flow indicator which plays a crucial role in assessing the prevailing sentiment in
the market this indicator enables us to gauge the involv ment of influential Banker funds and their impact on price action by monitoring the color switches and Candlestick patterns on the banker fund flow indicator we gain valuable insights into the buying or selling pressure exerted by these significant players however analyzing the trend and sentiment alone is not sufficient to ensure there is sufficient participation and volume in the market we will incorporate the volume oscillator into our analysis the volume oscillator helps us measure the amount of volume that is currently present in the market by confirming the
presence of robust volume we can validate the validity of price movements and potential trading opportunities now that we know how we'll be using the indicators let's take a look at some entry examples we are currently looking at gbpusd on the 1our time frame here we can see the following first we can see that the price was previously in a downtrend we know this because we can see that the whole sweet line was red however we can now see that the whole sweet lines switched back to green indicating that the shorter-term trend switched to bullish this
aligns with the recent upward move that was made by the price action if we look at the banker fund indicator we can also see that it recently switched from blue to green while being at the yellow threshold line this indicates that significant players have started entering into positions both of these signals indicate that it's a good idea to enter into a buy position however before we do so we will need to check if there is enough volume in the market to do so let's take a look at the volume oscillator indicator as you can see
the volume oscillator is currently above the zero line this shows us that there is high chance of there being enough volume to push the price further in the upward Direction because of this let's enter into the buy position here we will be placing the stop loss at the recent swing low for the takeprofit we will be targeting a 1.5 time risk to reward ratio now let's see how the trade plays out in this case we are looking at Australian dollar to US Dollar on the 1hour time frame here we can see the following first we
can see that the market is starting to head in the upward Direction after a longer term downtrend we can see that the price was making higher highs during this upward movement despite this if we take a look at the banker fund oscillator we can see that the oscillator was making lower highs along with this the banker fund oscillator C candlesticks recently switched from the green candlesticks to the red and blue candlesticks indicating that significant players are exiting their positions if we take a look at the whole Suite line we can also see that it's switched
to Red meaning that both the whole suite and the banker fund flow indicators are indicating a bearish signal in order to make sure that there is enough volume in the market to push the price further in the downward Direction let's check the volume oscillator we can currently see that the volume oscillator is above the zero line indicating that there is enough volume in the market because of all of these signals let's enter into the sell position we'll be placing the stop loss at the recent swing high for the takeprofit we'll be targeting a 1.5 times
risk to reward ratio now let's see how the trade plays out I hope you were able to see how the banker fund flow indicator Works how it can be read and how it can be used to enter into profitable positions if you did please leave a like and sub subscribe to the channel if you have any questions feel free to leave a comment


![BEST TradingView Indicator for SCALPING gets 96.8% WIN RATE [SCALPING TRADING STRATEGY]](https://img.youtube.com/vi/2U5VTWBBK8U/maxresdefault.jpg)