what's up guys in this video I'm going to cover everything you need to know about the Lux algo signals and overlays indicator the very indicator that really made Lux algo originally known today and also the indicator that is very much inspired the hype train behind all of the ridiculous signal indicators being marketed all over the Internet which to be honest completely sucks but this indicator from the very beginning has always been focused on providing signals and overlays that can be used to form confluences in anyone's trading and this very innovation of pushing out updates consistently
based on user feedback has made it the number one most used paid indicator by far in history and you can see for yourself if you go to the top custom indicators of all time in the trading View Community scripts you can see the legendary relics of the past 10 years like Chris Moody and lazy Bears indicators which are all free and then just scrolling down a tiny bit it you have the Lux algo signals and overlays that has a lock on it that is now ranking here amongst the most popular custom indicators of all time
so in this video we're going to cover how this indicator actually works the ways it was designed and intended to be used what's new in version 6.0 and of course how to use it on your charts so enough context let's just get right into it so this indicator as a tool kit can be used alongside many forms of technical analysis but it really has everything you possibly need from Trend following tools reversal indicators and optimization methods so if you want it was also designed to be used as a standalone indicator that can fit really any
trading style now the amount of features here may be a bit overwhelming and the ideal way to use this indicator is to First explore through all of the features in the settings over time pick and choose two to three that you think best suits your style of trading and stick with those to create your own use cases so before we get into some examples and how all the features can be used together let's just highlight all of the current features included in the indicator we have normal Trend confirmation signals with green and red arrows as
well as strong signals marked by the plus symbol specifically designed to help you confirm fans candle coloring with purple green and red to visualize Trends developing between normal and strong contrarian signals mode with normal and strong signals as well also specifically designed to help traders who like to trade against the trend or spot reversals exit signals marked as blue and orange x marks that apply for both confirmation and contrarian signals to suggest potential take profit points six plus indicator overlays to help you visualize Trends find reversal points and get Dynamic areas of support and resistance
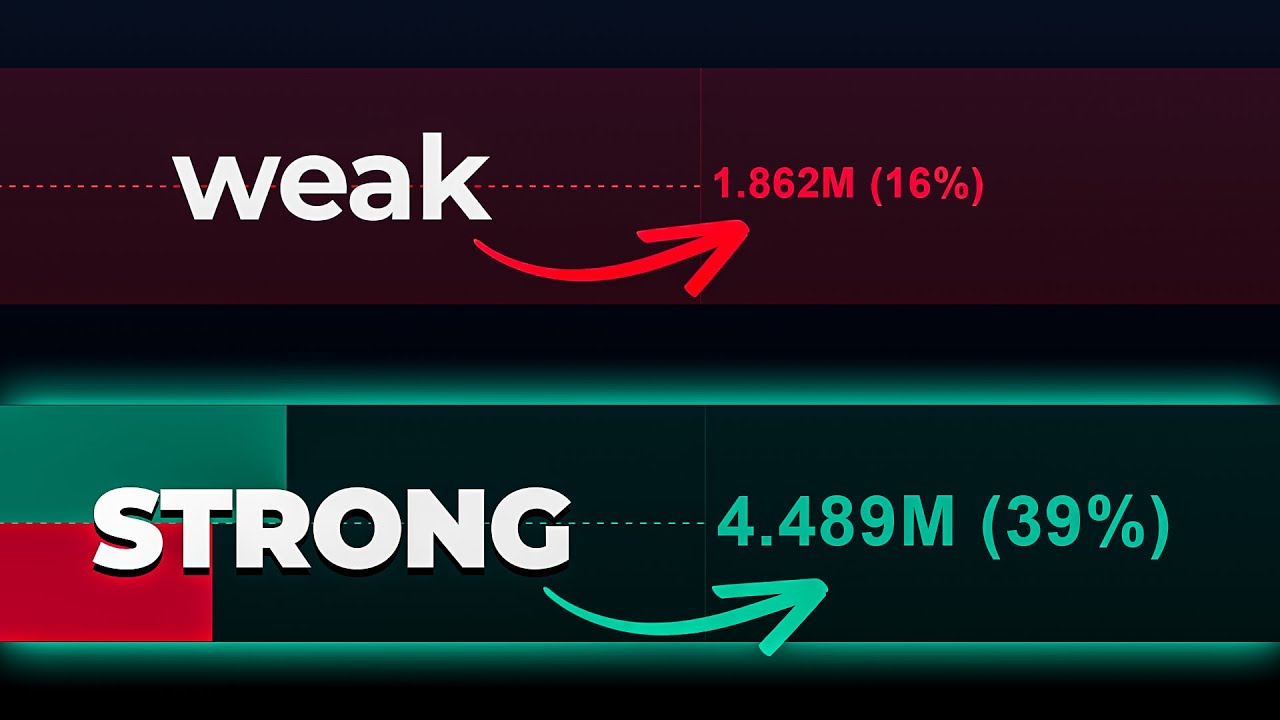
most people end up just using one or two of these beginner friendly presets to enable multiple features at once so you can use recommended combinations of signals and overlays in one click signal filters also within the presets and filters drop down so you can filter confirmation signals with indicator overlays and other metrics within the indicator a complete dashboard with very useful to know metrics such as Trend strength volatility volume analysis and more then there's also fully functional alerts with deeply customizable features like getting multiple conditions to trigger within one alert as well as the highly
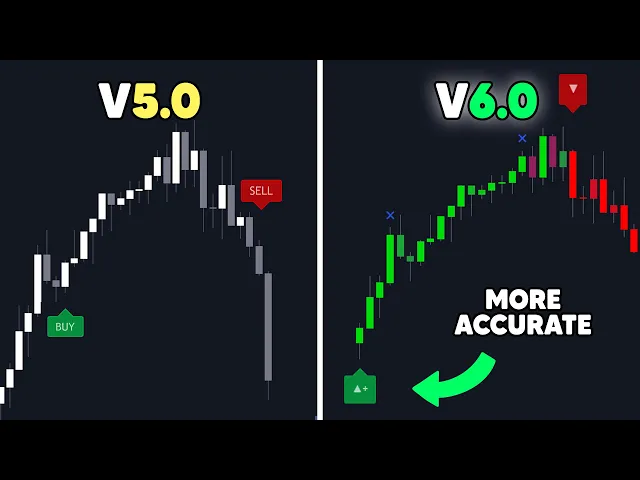
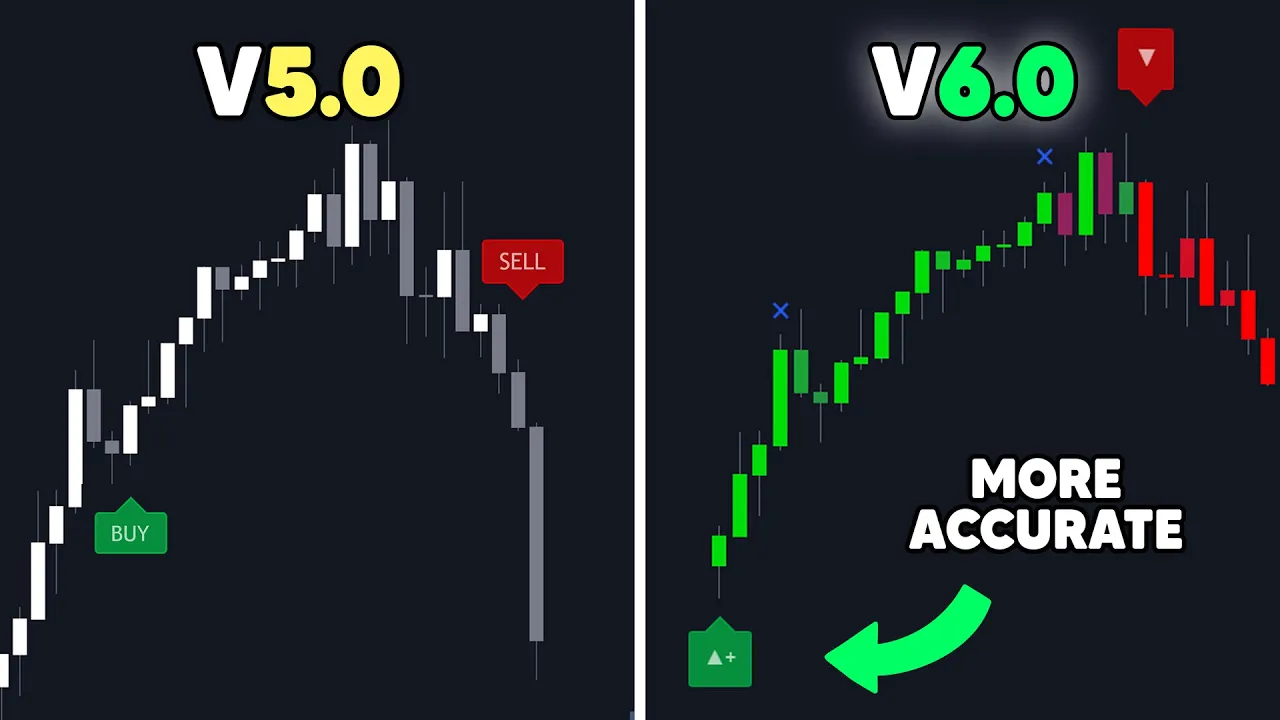
useful custom alert Creator to generate signal alerts that are filtered by other aspects of the indicator and all of this we managed to fit into one single indicator and by the time you're watching this video there may be a lot more features or some things change since we're actively developing it to be better and better over time for example on the day of this video release we just published version 6.0 which has upgraded the signals algorithm to dynamically adjust itself which is from our back tests on all assets reduce false signals by nearly five percent
without introducing any more lag and this doesn't mean since the signals on V6 are better than V5 that you should ever follow them blindly just means that the algorithm is more efficient and we even have the labels a part of this displaying so that the intended usability of the signals is more easily understood and just because there are signals on your chart does not mean you should ever take trades solely on this alone the tools are for educational purposes only and you will end up losing money if you follow any indicator blindly so anyway let's
get into a very basic demonstration of how the signals and the candle coloring is really meant to be interpreted the confirmation signals can generate normal and strong labels and what's important to know with these is that these signals are directly correlated to the candle coloring so you can accurately see the development between Trends and navigate through ranging markets as best as possible if the candles on this mode are actively switching back and forth to purple or just primarily staying as purple then this is generally an indication that the market is ranging and there's no established
Trend here and this comes especially in handy if you're using the signals because for example a positive sign for an uptrend to occur rather than a fake out on a confirmation signal is to see candles consistently holding as green with good price action this would indicate to a Smart Trader that the market is strong and likely to continue in an uptrend and vice versa for opposite signals and the candles holding as red it's also important to note with all signals and features in this indicator and all of Lux algal premium indicators together nothing repaints and
all of the signals are confirmed and permanent on the chart once a candle has actually closed so now into some more specifics for normal confirmation signals these often occur within smaller trends friends retracements or just as signals that you may not want to trust as much directly however you could of course get a normal signal and then watch the price action and candle coloring to see it become a strong uptrend so these normal signals aren't something you should completely ignore but when you get a strong signal you can just be a bit more confident that
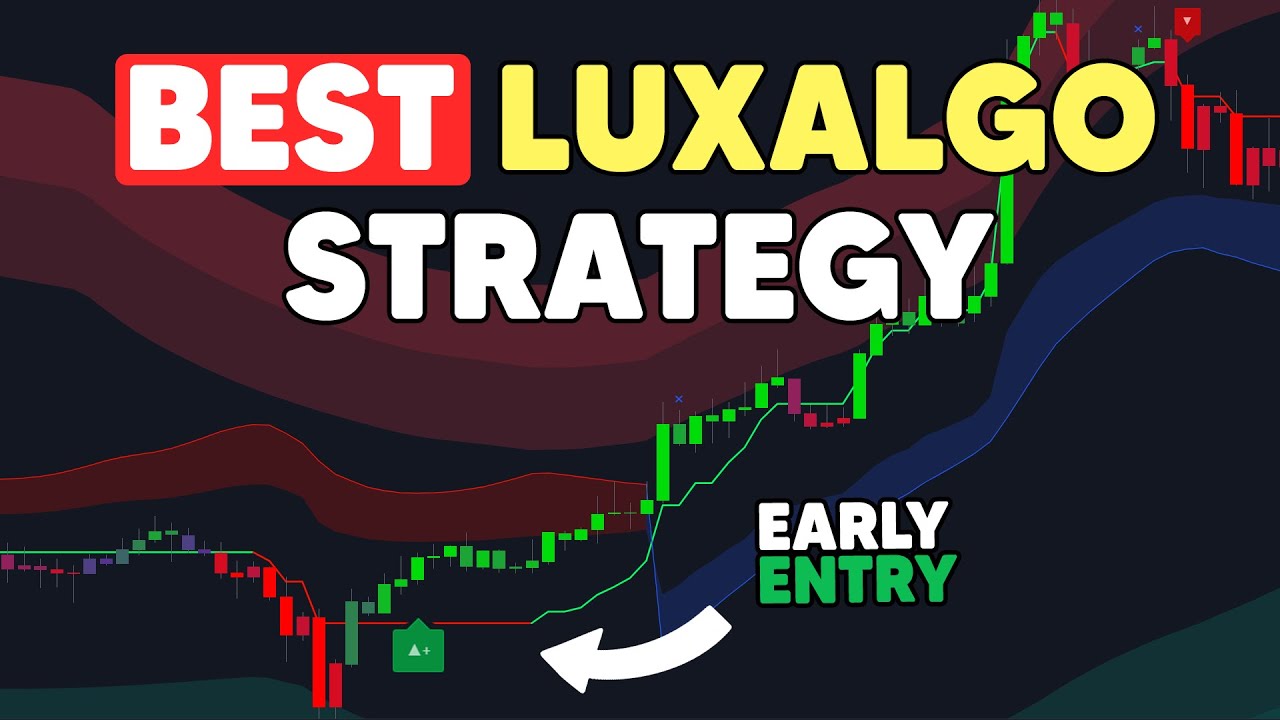
the market is already within an established Trend and so that's just the basics for the primary aspect of this indicator now let's get into some of the indicator overlays so here we have gone into the settings of the indicator and just enabled the smart Trail and the reversal zones overlays on the chart and now by using these overlays alongside the signals and candle coloring you can find a lot more compliments so what does this actually mean though and how could you actually make a trading strategy with the signals and the overlays in this indicator well
maybe you could look to enter on a retest of the blue smart Trail only when price prints a signal above it and then look to exit when price hits the upper reversal zone or another basic idea here could be when price exits the bottom reversal Zone and prints a signal to enter and then consider taking profit once price simply reaches the Red Smart Trail area of resistance or another one could be to even wait for a blue exit signal inside of a red reversal Zone then wait for price to exit their reversal Zone as your
entry use the confirmation signal as just a simple confirmation during your trade and take profit once price reaches the bottom blue level of the smart Trail or you could of course just do regular discretionary analysis alongside your regular trading instead of trying to create some magical strategy that's going to outperform any other that already exists and this is generally what we recommend for people to do because we believe that indicators are best used as supportive tools for decision making and this is what this toolkit really gives you in a comprehensive sense like you can totally
switch things up here based on how you are interpreting the indicator for example if you didn't choose to exit exactly on the blue line of the smart Trail you could have got more confidence is a great time to exit a short position once you got that red exit signal inside of the smart Trail afterwards or on this chart we can see on the left you probably wouldn't have wanted to trust this confirmation signal because right after it what do we see purple candles and it would have been smart to be aware of this and not
take any trades just based on this signal alone and the same thing goes for this strong signal it probably wouldn't have been a good idea to trust this signal because right after it we can see again there's purple candles and this is simply a good thing to be aware of and even another example in this scenario as price makes its way up to the Red Smart Trail maybe you'd be extra confident that now is a good time to take profit or enter a short position because price actually just had a blue exit signal and touched
the upper reversal Zone with the smart Trail at the same time afterwards so these are great examples of using the indicator for Confluence and within the signals and overlays indicator we put so much of a focus on discretionary analysis that we even built in the contrarian signal modes that if you're someone that doesn't like to trade Trend or you're just looking to create a strategy with signals to try and catch tops and bottoms or if you actually like to trade ranging markets more than Trends then this is the mode that you may like to use
better as well of course you can even adjust the candle coloring to be contrarian if you wish too so using these together you will now notice in ranging markets they actually perform quite better than the standard confirmation signals which are specifically designed to confirm Trends you could also maybe use the trend catcher indicator overlay on top of this setup if you want to get some sort of hybrid approach to analyzing the underlying Trend Within These ranged markets so you can see with all of these examples we really designed the toolkit to cater to truly any
style of trading and give it to you all in one place and the last part of this indicator we are going to cover is the presets and filters so we can see after resetting the indicator to its defaults and simply an enabling the smart Trail filter from within this drop down at the top of the settings menu by doing this we can filter out the signals that are not aligned with the smart Trail indicator overlay which directly can give Confluence in every signal that can now generate on the chart so there's not much of a
buy sell indicator feeling to it anymore and the signals are automatically filtered out when they aren't aligned with features like the smart Trail here however it's important to understand that applying filters to signals do not necessarily make them instantly better than using the indicator without them because between every technical indicator there are still trade-offs so while we can now use confirmation signals and retests of the smart Trail as great optimal entry points at times the indicator may miss signals or the retests themselves of the smart Trail and the same is also seen here with another
filter we just turned on within the indicator called Trend strength filter which basically just uses the trend strength metric in the dashboard to only generate confirmation signals that align with a trending Market which can clean up a lot of that noise during retracements as well as the ranging markets however the trade-off seen here now with this filter enabled is that at times the indicator will actually just completely Miss Trends in the market which is why we still need to be aware of the price action candle coloring or other forms of analysis to give us the
right Confluence instead of just relying directly on the signals so hopefully this rundown covers most of the aspects of the Lux algo signals and overlays indicator conceptually helps you understand how you can actionably use it in your trading by using features together with the signals and also shows you how we designed the indicator to actually help people develop their perspective on ta and trade with indicators as supportive tool tools for decision making and to put it more simply this indicator specifically covers everything you'd ever need in an extremely comprehensive way when it comes to technical
indicators with Dynamic features all in one place but if you're not the biggest user of traditional ta and you're more interested in trading price action then I highly suggest watching this video which covers our other premium indicator called the Lux algo price action Concepts and all of this is a part of our Lux algo premium suite you can get access to on luxalgo.com so make sure to check out all the links Down Below in the description and shout out to the team at tradingview for sending us this neon sign thanks for watching hopefully you found
this helpful and I'll see you guys in our next video