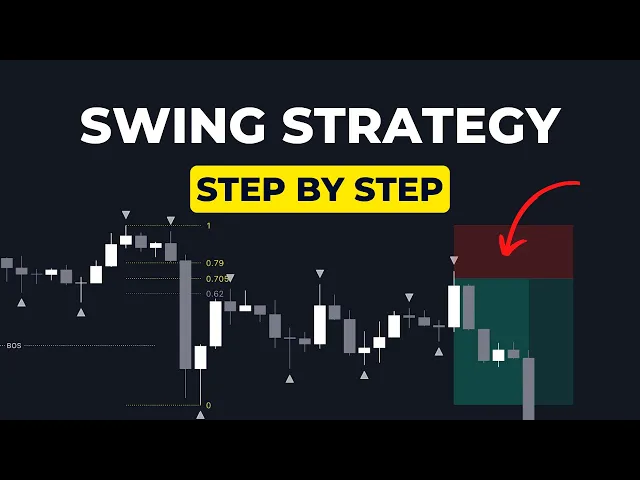
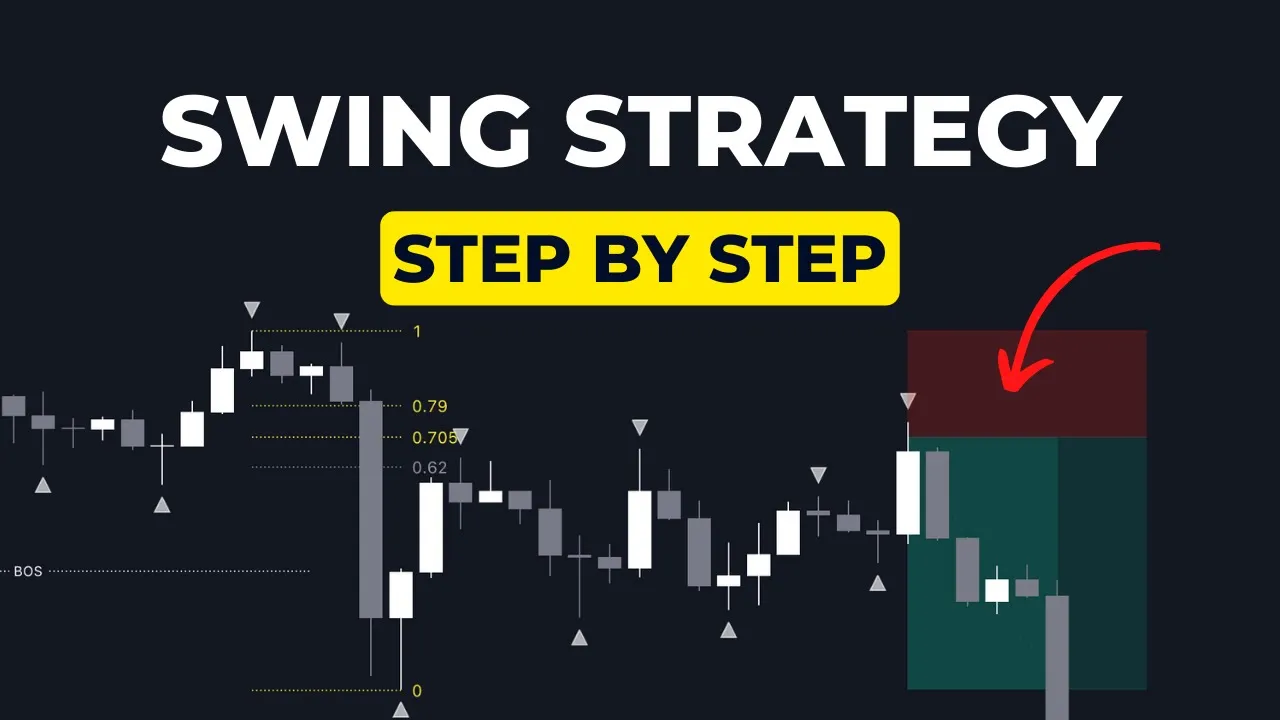
if you are a Trader who isn't profitable yet who works full-time or is just looking to simplify their trading and reduce their chart time then watch this video till the end to see how you can do this by only using the 4-Hour time frame I will provide you with a free trading plan Link in the description before we get started and go through the trading plan step by step I get questions all the time on whether the community is still going whether we still do our daily live sessions yes we do I've been adding more content to the course weekly Market breakdowns for the swing strategy pointing out the trade examples that are coming for the week ahead and obviously trade the Silver Bullet sessions every single day so we'll be moving over to a monthly subscription soon so jump in whilst you can so first thing to do is get your chart set up you can do this by following the the trading plan um first we'll be using the fractal indicator to determine our swing points to make things 100% mechanical and also to determine our liquidity points and then we'll be using the Fibonacci retracement tool with the point 79 the 705 levels um as our entry zones you can take entries from either of these they will usually overlap with other PD arrays okay so this is the main focus of this trade setup okay internal range liquidity to external range liquidity when we trade from internal range liquidity back to external range liquidity it is higher probability as we are trading with Trend so here you can see NASDAQ is in a bull market making higher highs and higher lows when we trade back into internal range liquidity being this this fair value Gap here discount pricing as well this is going to be higher probability because we are trading with Trend so this strategy is split between two models we've got reversals and then we've got continuations the reversal model this is an example of that and it's basically after price takes out the previous swing high or low and then obviously gives us a market structure shift but to confirm this we need a sweep of liquidity um before this happen so on this this example here you can see price swept the current lower low and then we broke above the previous lower high therefore giving us a market structure shift we come back down tap into demand uh the order block the 7. 79 is just always going to overlap with with those kind of areas and then we're just looking for obviously confirming this with displacement so is there a fair value Gap in discount or premium if we're looking for shorts and then obviously entry at the OT levels so with the continuation model we're take it we're taking entries from the second phase after that reversal okay it could be the third phase the fourth phase um but essentially we need at least one more leg after the initial Market structure shift so this was the market structure shift this is our reversal model so we've got a sweep of liquidity uh the market structure shift take trades from the 7 down to this low but then obviously we broke through that we displaced through that um everything else all of these rules are met and then we trade back into value but we don't need a sweeper liquidity because price has already confirmed this shift lower Okay so we've had one move lower and then a second move lower um and then obviously we don't need a sweep of liquidity in this continuation model okay so here we've got the trade plan for reversals so essentially just ass sure ensure that each step of the trading plan is fulfilled before entering a trade and then these are the steps for the continuation model okay so when you're doing your your back testing when you are journaling your trade you can you can track the performance between reversals and continuations so let's get started with an example on NASDAQ this is a trade that occurred this month and obviously you can see price is making higher highs and higher lows we can draw on our dealing ranges like so and you can see obviously higher highs higher lows breaking out of that making a higher high higher low another higher high another higher high again and then we take out that high this becomes the higher low low and then we sweep that high there what do we do we just Place lower taking out previous higher low if we take out a previous high low we've broken the uptrend and now we are looking for shorts do we have a sweep of liquidity because this is a reversal setup we're trading against Trend here is our sweep of liquidity we draw on our OT and once price starts pulling back we'll be looking for entries our break of structure is here so we're looking for entries from either the 7 or the 79 we can place our order obviously on once we start pulling back we'll play price out in a moment so you can see price drops lower here we can then alter our FIB tool alter our entry does price start pulling back now no we go lower once again and it looks like now we have put in that low and we started retracing so we alter our our FIB to once again and then we alter our entry so we're looking for a 2. 3 to 2.
4 move from 7 from 79 be 3. 7 okay I usually just take my entry from the the. 7 to avoid missing out on the move you can see price tapped it in at the 7 there we've obviously got this huge imbalance here in terms of this fair value Gap price fills there and you can see we continue lowerer hitting Target price never really went into any draw down on that position this is a more recent position here on Aussie New Zealand you can see once again price is in an uptrend making higher highs and higher lows so we can draw on our dealing ranges and what we're waiting for is obviously a sweep of liquidity to look for shorts so our dealing range was broken to the downside we've taken out this previous higher low this higher low failed to create a new high we swept this previous higher high so when we sweep that previous higher high and then take out the previous higher low we've then had a shift in Trend to the downside so we can look at putting on our FIB tool here obviously got this internal range liquidity in terms of this fair value Gap price trades back into the 7 and we get entered into that and we're looking for the lowest hanging through we looking for price to return to the low that it puts in after breaking trend so price would have tagged you in if you were looking for a 79 here as well so maybe you'd want to split your entries between 79 and 7 who knows but obviously 79 increases risk reward up to like 3.
6 R and then you can see that one played out perfectly entered in the initial entry on the Thursday taken out the following Tuesday so a reasonably quick trade there uh for a swing trade dollar Singapore dollar here again again this is a reversal entry we're going to show some some examples of some some continuations in a moment but what we can see is price is creating higher highs and higher lows once again there was this continuation over here which also had a sweep of liquidity um huge stealing range high to low we're not looking to do anything but you can see here price tapped into internal range liquidity and went lower this wasn't the point 7 so there was no trade here for me but I'm not looking to do anything until price breaks out of this dealing range we're expecting this low to get taken we then got that continuation below the low so were looking for another continuation price moved lower stuck to my trade management rules and then this was a break even trade you can see the price never returned to the low and it would have been taken out for a loss after some time but it's because we're trading within such a large dealing range um in this situation here you can see a lot smaller dealing ranges are being made um obviously creating this high high low expecting this to to get taken out we don't displace above there we just get a sweep of liquidity this obvious becomes the higher low we break below that so we have a break of structure so obviously this then becomes our new dealing range we've got internal range liquidity here this fair value Gap so alter that FIB obviously to the lowest point after that break of structure and we're looking for an entry up here at the0 79 let's see what we get price tags Us in would have tagged you in at the the 79 as well increasing rest Rod uh price goes into a slight bit of draw down but eventually we get that expected move why did we expect that move because we swept liquidity broke structure to the downside Euro Aussie another reversal trade so in this example it's a long trade can you see where we're going to be getting long in this example we draw on our dealing ranges lower high to lower low so got some smaller lower highs in here we then break out to the upside no trade no fair value gaps we then break lower once again this becomes our lower high to our lower low we then break structure to the upside taking out these lows so we had a sweep of liquidity and then we had our break of structure body close above now we're looking to see whether we've got a fair value Gap in discount yes we do so therefore we're expecting a return to where internal range liquidity to then continue back to external range liquidity being these highs place our OT tool on price trades back into the 7 spiking through that fair value Gap again you would have been tagged in at the 79 and price continues there to Target for another take profit of course there are losses within this strategy as well guys but I'm just showing you the textbook examples this is what you want to look for on the charts you're going to expect losses from time to time as well um but of course we just want to ingrain in our minds what a profitable trade setup looks like okay so of course I'm going to show you the profitable trades some of you guys like oh you're not showing losses you're not showing losses the profitable trades are the most important ones okay as long as you're sticking to the rules and you've tested the strategy and then you forward tested the strategy you want to focus on what does a profitable trade look like too many of you are asking um everyone online to show you uh losing trades why do you want to see a losing trade you want to ingrain in your mind what a profitable trade looks like and you want to replicate that that time and time again as long as you're reviewing your losses and they are valid and you are not breaking your rules that is fine that is part of your trading Edge so then you can see obviously price traded higher um from there no real uh setups there for for me and me and the members on that continuation but we were expecting that after we put in this bottom go over to uh dollar Swiss this was a really textbook trade this was actually a continuation so you can see here this previous high low was taken out therefore we shift bearish we didn't get a setup for a reversal model there was no setup here because we didn't come back to to 7 price continued lower so now we've confirmed the bearish trend okay if I draw our dealing ranges once again you can see higher highs and higher lows okay I'd recommend you doing this to ensure that you are trading you're are trading with uh with the trend and uh make sure that you you've obviously got your structure drawn on you and the current order flow are we bearish are we bullish so here you can see bullish High highs higher lows now we've taken out the previous higher low now we've shifted bearish we're expecting a lower high to be put in here to then continue for a lower low and that's what we do so this is our current dealing range whilst we're in this dealing range we're expecting continuation back to this low okay so we place on our OT tool we're looking for a return to the 7 we we get that we take out some internal liquidity as well and price continues way beyond our Target because we're continuing this already confirmed bearish Trend why was this uh this trade a continuation because we'd already taken out a higher low and then we' taken out this lower low here with a lower high okay so this was the first leg now we're trading now we got a second leg and now we're trading the third leg okay so this is a continuation because we've identified that there needs to be at least one more leg after the initial Market structure shift okay so where was so where was the initial Market structure shift the in initial Market structure shift was this break of structure here so that was the initial shift and then there was one more leg and now we're trading the third leg okay perfect setup that on on dollar Swift many uh many members obviously took that trade absolute textbook and then we've got a couple of examples here on Euro New Zealand for continuations these are continuations that happened to not have a sweep of liquidity as well okay so this dollar Swiss continuation did actually sweep this High here so we did have a sweep of liquidity as well however this Euro New Zealand doesn't have a sweep of liquidity there's two examples here so you can see price was in this bearish trend lower lows lower highs very simple bearish order flow we then shifted bullish here and then shifted bullish once again so obviously we've had this initial leg and then we've had a second leg up obviously breaking this that's a confirmed bullish Trend therefore now we can look for Longs within here if you want to price returns 2. 7 so that would have been the entry there after we see the breaker structure above continuation back to the highs that's entry one entry two this becomes our dealing range okay higher low to higher high delete this previous setup here higher high high low to higher high okay so what we're expecting now is a return to internal range liquidity the same thing that happens here higher higher low higher high return to internal range liquidity in discount continue back to buy side liquidity okay continuation model first leg second leg we're trading the third leg internal range liquidity back to external range liquidity where is our internal range liquidity this fair value Gap here does that align obviously with our entry zone of course it does it's within discount and then we're looking for entries from the point 7 back to external range liquidity tapped in absolutely perfectly here and then just flies to take profit so there six textbook examples for you there is losses within this as well I will show you one that was taken recently on dollar single dollar and that was this continuation model here okay so lower high to lower low internal range liquidity we're looking for a move back down to external this was the entry from the 7 and then obviously that got taken out there as you can see for a stop loss no opportunity to manage this the only way that this could be avoided is if you're going to bring higher time frame analysis into that taking some higher time frame liquidity etc etc but it's just not needed within this strategy um so yeah any questions drop them down below Maybe I'll do a back testing video on this um if there's enough demand for it but yeah Link in the description for the trade plan and if you want to join the team and get obviously the weekly Market updates for this and then trade it with us live every day within the group full trading Plan full video lessons obviously going more in depth than this to make it fully mechanical for you guys get into the group obviously before we increase prices once again and of course there is some one-on-one packages as well if you want three times 60 Minutes included with your lifetime memberships okay so massively discounted there if you are interested make sure to like And subscribe and I shall see you on the next video if you are a Trader who isn't profitable yet who works full-time or is just looking to simplify their trading and reduce their chart time then watch this video till the end to see how you can do this by only using the 4-Hour time frame I will provide you with a free trading plan Link in the description before we get started and go through the trading plan step by step I get questions all the time on whether the community is still going whether we still do our daily live sessions yes we do I've been adding more content to the course weekly Market breakdowns for the swing strategy pointing out the trade examples that are coming for the week ahead and obviously trade the Silver Bullet sessions every single day so we'll be moving over to a monthly subscription soon so jump in whilst you can so first thing to do is get your chart set up you can do this by following the the trading plan um first we'll be using the fractal indicator to determine our swing points to make things 100% mechanical and also to determine our liquidity points and then we'll be using the Fibonacci retracement tool with the point 79 the 705 levels um as our entry zones you can take entries from either of these they will usually overlap with other PD arrays okay so this is the main focus of this trade setup okay internal range liquidity to external range liquidity when we trade from internal range liquidity back to external range liquidity it is higher probability as we are trading with Trend so here you can see NASDAQ is in a bull market making higher highs and higher lows when we trade back into internal range liquidity being this this fair value Gap here discount pricing as well this is going to be higher probability because we are trading with Trend so this strategy is split between two models we've got reversals and then we've got continuations the reversal model this is an example of that and it's basically after price takes out the previous swing high or low and then obviously gives us a market structure shift but to confirm this we need a sweep of liquidity um before this happen so on this this example here you can see price swept the current lower low and then we broke above the previous lower high therefore giving us a market structure shift we come back down tap into demand uh the order block the 7. 79 is just always going to overlap with with those kind of areas and then we're just looking for obviously confirming this with displacement so is there a fair value Gap in discount or premium if we're looking for shorts and then obviously entry at the OT levels so with the continuation model we're take it we're taking entries from the second phase after that reversal okay it could be the third phase the fourth phase um but essentially we need at least one more leg after the initial Market structure shift so this was the market structure shift this is our reversal model so we've got a sweep of liquidity uh the market structure shift take trades from the 7 down to this low but then obviously we broke through that we displaced through that um everything else all of these rules are met and then we trade back into value but we don't need a sweeper liquidity because price has already confirmed this shift lower Okay so we've had one move lower and then a second move lower um and then obviously we don't need a sweep of liquidity in this continuation model okay so here we've got the trade plan for reversals so essentially just ass sure ensure that each step of the trading plan is fulfilled before entering a trade and then these are the steps for the continuation model okay so when you're doing your your back testing when you are journaling your trade you can you can track the performance between reversals and continuations so let's get started with an example on NASDAQ this is a trade that occurred this month and obviously you can see price is making higher highs and higher lows we can draw on our dealing ranges like so and you can see obviously higher highs higher lows breaking out of that making a higher high higher low another higher high another higher high again and then we take out that high this becomes the higher low low and then we sweep that high there what do we do we just Place lower taking out previous higher low if we take out a previous high low we've broken the uptrend and now we are looking for shorts do we have a sweep of liquidity because this is a reversal setup we're trading against Trend here is our sweep of liquidity we draw on our OT and once price starts pulling back we'll be looking for entries our break of structure is here so we're looking for entries from either the 7 or the 79 we can place our order obviously on once we start pulling back we'll play price out in a moment so you can see price drops lower here we can then alter our FIB tool alter our entry does price start pulling back now no we go lower once again and it looks like now we have put in that low and we started retracing so we alter our our FIB to once again and then we alter our entry so we're looking for a 2.
3 to 2. 4 move from 7 from 79 be 3. 7 okay I usually just take my entry from the the.
7 to avoid missing out on the move you can see price tapped it in at the 7 there we've obviously got this huge imbalance here in terms of this fair value Gap price fills there and you can see we continue lowerer hitting Target price never really went into any draw down on that position this is a more recent position here on Aussie New Zealand you can see once again price is in an uptrend making higher highs and higher lows so we can draw on our dealing ranges and what we're waiting for is obviously a sweep of liquidity to look for shorts so our dealing range was broken to the downside we've taken out this previous higher low this higher low failed to create a new high we swept this previous higher high so when we sweep that previous higher high and then take out the previous higher low we've then had a shift in Trend to the downside so we can look at putting on our FIB tool here obviously got this internal range liquidity in terms of this fair value Gap price trades back into the 7 and we get entered into that and we're looking for the lowest hanging through we looking for price to return to the low that it puts in after breaking trend so price would have tagged you in if you were looking for a 79 here as well so maybe you'd want to split your entries between 79 and 7 who knows but obviously 79 increases risk reward up to like 3. 6 R and then you can see that one played out perfectly entered in the initial entry on the Thursday taken out the following Tuesday so a reasonably quick trade there uh for a swing trade dollar Singapore dollar here again again this is a reversal entry we're going to show some some examples of some some continuations in a moment but what we can see is price is creating higher highs and higher lows once again there was this continuation over here which also had a sweep of liquidity um huge stealing range high to low we're not looking to do anything but you can see here price tapped into internal range liquidity and went lower this wasn't the point 7 so there was no trade here for me but I'm not looking to do anything until price breaks out of this dealing range we're expecting this low to get taken we then got that continuation below the low so were looking for another continuation price moved lower stuck to my trade management rules and then this was a break even trade you can see the price never returned to the low and it would have been taken out for a loss after some time but it's because we're trading within such a large dealing range um in this situation here you can see a lot smaller dealing ranges are being made um obviously creating this high high low expecting this to to get taken out we don't displace above there we just get a sweep of liquidity this obvious becomes the higher low we break below that so we have a break of structure so obviously this then becomes our new dealing range we've got internal range liquidity here this fair value Gap so alter that FIB obviously to the lowest point after that break of structure and we're looking for an entry up here at the0 79 let's see what we get price tags Us in would have tagged you in at the the 79 as well increasing rest Rod uh price goes into a slight bit of draw down but eventually we get that expected move why did we expect that move because we swept liquidity broke structure to the downside Euro Aussie another reversal trade so in this example it's a long trade can you see where we're going to be getting long in this example we draw on our dealing ranges lower high to lower low so got some smaller lower highs in here we then break out to the upside no trade no fair value gaps we then break lower once again this becomes our lower high to our lower low we then break structure to the upside taking out these lows so we had a sweep of liquidity and then we had our break of structure body close above now we're looking to see whether we've got a fair value Gap in discount yes we do so therefore we're expecting a return to where internal range liquidity to then continue back to external range liquidity being these highs place our OT tool on price trades back into the 7 spiking through that fair value Gap again you would have been tagged in at the 79 and price continues there to Target for another take profit of course there are losses within this strategy as well guys but I'm just showing you the textbook examples this is what you want to look for on the charts you're going to expect losses from time to time as well um but of course we just want to ingrain in our minds what a profitable trade setup looks like okay so of course I'm going to show you the profitable trades some of you guys like oh you're not showing losses you're not showing losses the profitable trades are the most important ones okay as long as you're sticking to the rules and you've tested the strategy and then you forward tested the strategy you want to focus on what does a profitable trade look like too many of you are asking um everyone online to show you uh losing trades why do you want to see a losing trade you want to ingrain in your mind what a profitable trade looks like and you want to replicate that that time and time again as long as you're reviewing your losses and they are valid and you are not breaking your rules that is fine that is part of your trading Edge so then you can see obviously price traded higher um from there no real uh setups there for for me and me and the members on that continuation but we were expecting that after we put in this bottom go over to uh dollar Swiss this was a really textbook trade this was actually a continuation so you can see here this previous high low was taken out therefore we shift bearish we didn't get a setup for a reversal model there was no setup here because we didn't come back to to 7 price continued lower so now we've confirmed the bearish trend okay if I draw our dealing ranges once again you can see higher highs and higher lows okay I'd recommend you doing this to ensure that you are trading you're are trading with uh with the trend and uh make sure that you you've obviously got your structure drawn on you and the current order flow are we bearish are we bullish so here you can see bullish High highs higher lows now we've taken out the previous higher low now we've shifted bearish we're expecting a lower high to be put in here to then continue for a lower low and that's what we do so this is our current dealing range whilst we're in this dealing range we're expecting continuation back to this low okay so we place on our OT tool we're looking for a return to the 7 we we get that we take out some internal liquidity as well and price continues way beyond our Target because we're continuing this already confirmed bearish Trend why was this uh this trade a continuation because we'd already taken out a higher low and then we' taken out this lower low here with a lower high okay so this was the first leg now we're trading now we got a second leg and now we're trading the third leg okay so this is a continuation because we've identified that there needs to be at least one more leg after the initial Market structure shift okay so where was so where was the initial Market structure shift the in initial Market structure shift was this break of structure here so that was the initial shift and then there was one more leg and now we're trading the third leg okay perfect setup that on on dollar Swift many uh many members obviously took that trade absolute textbook and then we've got a couple of examples here on Euro New Zealand for continuations these are continuations that happened to not have a sweep of liquidity as well okay so this dollar Swiss continuation did actually sweep this High here so we did have a sweep of liquidity as well however this Euro New Zealand doesn't have a sweep of liquidity there's two examples here so you can see price was in this bearish trend lower lows lower highs very simple bearish order flow we then shifted bullish here and then shifted bullish once again so obviously we've had this initial leg and then we've had a second leg up obviously breaking this that's a confirmed bullish Trend therefore now we can look for Longs within here if you want to price returns 2.