all right so in this video we will be discussing how to um how to test reliability of um a questionnaire and also I'm going to construct some uh table for descriptives of a a questionnaire we have a sample questionnaire and then um so these are the three variables being measured by these three by this um questionnaire knowledge on waste reduction behavior and effect of waste reduction so these are all lyer scales with 10 items and then we're going to test later um if this question is reliable and how many um statements will be left um when it's already reliable and um I also prepared some sample data these are all fictitious data that is let's say we have um conducted a pilot testing for this data I mean for that for that questionnaire so these are the oh for the first variable these are the 10 statements for the second variable so will be the 10 another 10 statements and for the third variable and so on so those are these are the data collected using that um questionnaire for this sample questionnaire so how to test the reli reliability of this data so the first thing to do is to check first if there are negatively stated um statements so that we can reverse uh the data of a negative stated statements so in this example I have put I put asterisk to statement two which is saying I am not familiar so this is a negatively stated statement and the rest are positive I understand the concept I know the three Rs I am familiar and so on so those are positive except for the statement to which is negatively stated so we are going to um reverse the the data collected for this statement too same thing here in um second variable these are all positive statements I believe and there's nothing to reverse here so we don't put any asteris in those 10 statements for the third variable we actually have um the seventh statement so you might be missing some of the statements that that might be negative but um the jamovi software which we'll be using we'll be using later for testing reli reliability um it will suggest that uh those statements or which statements are uh can be or a possible um negative statements or needs uh to be reversed but it's just adjusting so you don't need to just change it directly you have to check the statement first if it's negatively stated all right so after change putting asterisk for those negatively stated statements so we are going to go back to Exel file this is the data and then we're going to highlight everything highlight the data so we're going to go to conditional formatting under home and then conditional formatting we're going to highlight cells and then press between so we're going to put one and five so that it will highlight uh numbers between one and five because the data is only we are expecting data with it should be between one and five Beyond five or less than one um it is it must be an error so that's why we are highlighting it so that we might we can check if there are errors that we have encoded because there um there are possibilities of encoding repetition like this or sometimes we'll leave it leave it blank if it's like this we just remove um the repetition so we make sure that the data there's no more error before you check the reliability test we have here one and five so if it's like this and you're confused whether it's one or five you just look at the data of this participant so this is um every row is uh is one participant and these are the um the responses the participant in the first variable as you can see majority is five so you use five so just choose the majority or the dominant number in that uh participant so let's check the rest making sure that there's no more error so we have here a blank so let's check the responses of this participant or this respondent and majority is four so I'm going to put four here and this repeated five so let's just um leave it as five and we have four all right so I think um all those data are already um corrected now we're ready to put this in um in our software so let's save and then you download Jovie so you can go to um google. com and find Jovie download this is a free software used for um doing some inferential statistics for reliability testing you can download this either of these um version so but I already downloaded this so I'll just open mine uh Jovi a little outdated but it is um probably similar to the latest version so let's open it and um so this is how it looks like for Jovi so it's easier to use than an the ESP SPSS except that SPSS has more functions than this but at least we have some at least uh the most common um formulas we needed for computing um statistical researches so let's open let's um open this menu and press open then go to browse and then locate the sample data so I put it in the desktop and here is the sample data open it and it will reflect here so automatically the first row will be understood by Jovi that it's the heading and then we're going to go to factor reliability analysis so and then we're going to check the Chron boox Alpha and the Chron boox Alpha if item is dropped so we're going to put all those first variable statements from 1 to 10 so you can you can do it one by one or all all at once all right so we have um the failing Mark but don't forget that when we go back to our statement in our first variable the first state second statement is um it's it should be reversed because it's a negative lated statement so we're going to go down and go to reverse scaled items then reverse the second statement so it will generate another um run back Alpha so what we are after here is a 7 at least point 0. 7 CR boox Alpha to make it um reliable so if it's not reliable so we are going to look for um under if item dropped it should be bigger I mean the biggest cronbach Alpha here which is um the second statement so this means if you drop the A2 or the second statement this will be um it will become bigger I mean this will be the new Chron boox Alpha so let's remove the second statement and the new Crono Alpha will be the0 547 it's still uh not passing but at least it's better combo Alpha and then let's continue removing some statements so we have here the six statement which is 0.
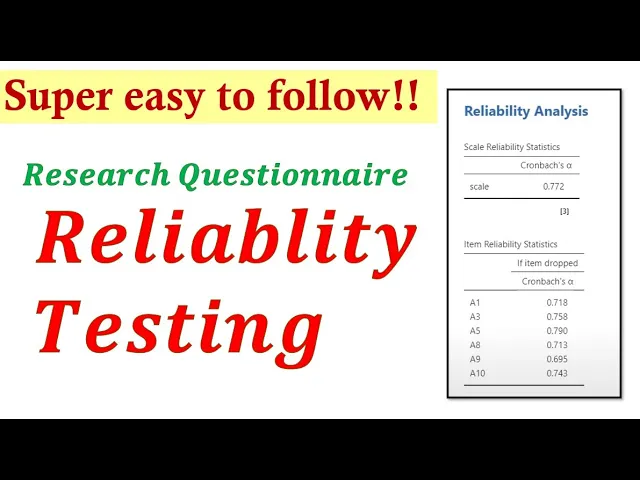
623 it's the highest so meaning if we're going to remove the six state so this will be the new Chron boox Alpha so it's saying that among the worst I mean the among all these statements the worst statement is the sixth so let's remove it and then so it's now 623 so let's continue removing until it reaches 7 so the highest tier is um statement seven so let's remove that and then it's still 682 so let's continue removing we can remove for statement to get a passing score of 0. 772 so we have these six statements left and what we have removed are 2 46 and 7 so let's put it here in our um table for liability test if you go down or you can construct your own table like this so it uh what's the result again 0. 772 so 0.
772 it's reliable and then um we have deleted or removed four statements two 4 6 and 7 so that means we're going to remove that in our um word so this statement two four six and seven so what we have is statements 135 8 910 so there are six statements so it's all good as long as it's not less than four less than five statements so let's say if it's four statements left then even if it's a passing questionnaire you have to reconstruct and redo pilot testing because it's too few questions for one variable so at least you'll have at least five statements left so you better create a lot of statements so that at least when we remove um at least you still have at least five statements left so in the data also we're going to remove 2 4 6 and 7even for the first variable let's remove this 2 4 6 and seven now for the second variable so let's go back to Jovi and put this back and let's open um I mean let's put the second variable which the B I name it B you can use other letters if you want then let's um it's a it's a failed Crown boox Alpha so let's choose the biggest which is under the if item dropped it's 649 so we're going to remove B6 to make the cronbach alpha 649 so it's here but it's still a failed score so we're going to improve that by removing the seventh statement so it's going to be 689 after removing seventh statement still it's uh uh failed score so we're going to continue removing so we're going to remove the ninth statement to get a passing score which is 714 so let's put it in our relab test table the second variable is 0. 714 it is reliable now let's go to our statements so what are those um statements that is being removed we'll go back to our Jovi and let's see here it's 6 seven and N that needs to be removed so let's remove those statements 67 and then nine so we still have um around seven statements left which is all good then uh under the data so I'm going to remove also 67 and9 for letter for the second variable 6 7 and 9 all right so now let's proceed to the third variable which is C let's put this B back and then let's move to C Okay so so now we have this and um it's a failed cron box Alpha and remember that under the statement 7 okay in the third variable under the statement 7 is a negatively stated statements so we're going to put it in reverse scaled items so that the computer will automatically reverse the scores and now it will generate a new chbox Alpha so it is still a failed chbox Alpha so we're going to remove some statements to improve the score so uh based on the if item dropped it is suggesting to remove this fourth statement to improve the score to . 577 Let's remove the fourth statement and then we'll continue removing um the highest will be the seventh statement the one which is reversed we're going to remove that to make the crown boox Alpha of 628 now we still have um failed Crown boox Alpha so let's continue removing we have we can remove the six statement to get a passing score of 717 so let's remove the six statement all right so this is now passing score and we still have a lot of statements left we only removed three statements so it's 717 so let's put it here so in research you are going to put this reliability test table in chapter 3 under instrument which is your your basis for a reliable instrument so those are passing scores and now you're going to remove the statements in the variable where the jov is suggesting to remove so we have four six and seven so let's remove those statements for six and seven all right now um let's remove as well here in the under the data um statement four data and then six and seven we have seven data left or seven columns left let's save this first so next is we are going to um prepare this table I mean this questionnaire we're going to con construct um the mean and standard deviation of each statement which very essential in um creating tables in the chapter 4 which you are going to analyze the statements which where um the where it has the highest mean uh among all the statements in each variable so let's prefer this um we only need three columns so we're going to remove two columns delete entire column so I'm going to put mean description and standard deviation or SD so let's adjust the column all right do the same here let's remove two columns delete entire column and then copy paste this heading mean SC um description and the standard deviation then adjust then the same procedure here going to remove two columns and then copy paste the the heading all right so after that we're going to add one more Row for the grand mean we're going to click here then press tab or you can you can do manually uh heading or insert insert row below if you want to but I believe it's faster if you just simply press Tab and then all right grand mean same thing here in the second variable so click here and then press tab then grand mean click press Tab and then Grand me all right let's save this so we're ready for those for our table and what we need is to get the values from our data so let's go back to Excel file and then we're going to calculate this so we're going to um add column in between these two variables let's press um let's right click here and then press insert to add one column so let's name it a column A for the first variable and then above the C1 let let's press there right click and then press insert to add one more column let's name it B for the C column so we don't need to add since there's already space for C then we're we'll take the average okay average of each participant in the in each variable so it's equals average and then highlight so making two decimals since it's an average leave it in two decimals and then um you double click the corner of this cell in order to get um the the average of all uh all rows next we are going to do the same thing here in b equals average so take the average then add two decimals then double click so all these um rows will be having the same computation taking the average same thing in C equals average so as you can see it's very long answer so it's this um decrease the decimal into two so it would look neat and then press the corner twice in order to automatically compute all those averages now let's go um the bottom we have here um when I do the same thing take the average but it's now for the column so average of this column all right so a of that column then make it into decimals then drag from the corner so that we can get the the average of all columns same thing here at the bottom we're going to put standard deviation so equals and then stdv that s because s means for sample to parenthesis then go from the top so the same thing going to the 68 row so this will be now the standard deviation so decrease the decimal into two decimals then drag so that you can get all the standard deviations of every row we can put some colors for this grand mean and Grand standard deviation so we call it grand mean because it's the mean of all means so you are taking the average of averages these are all averages and you're going to get the average of that so it's called um grand mean now remember that our statements or I mean the table is in column so we're going to write it in column so this data we're going to transpose it into column instead of row so I'm going to copy this and then right click somewhere um then paste spral then values then click transpose so value so that you will not copy you will only copy the value not the formula and then transpose so that it will change to column then degreas all right so we're going to move this standard deviation to put space for description going to copy and paste there or you can just drag like this we going to do the same procedure for the rest of the um the variable so paste special values and transpose so I'm going to drag this going to the right side to give space for description same thing here copy P special values and then transpose so I'm going to drag this to the side to put space now um for uh putting the description of each mean depends on the scoring guidelines of each research but let's say um let's just use this standard uh range or low very low usually it's 1 to 1.
5 it's um low oh very low so 1 51 up to 2. 5 that's low 2. 51 to 3.
5 that's moderately high or moderate 3. 51 to 4. 5 that's high 4.
51 to5 it's very high so in some um in some studies they distribute equally for the range like having an interval of8 so from 1 to 1. 79 1. 8 to 2.