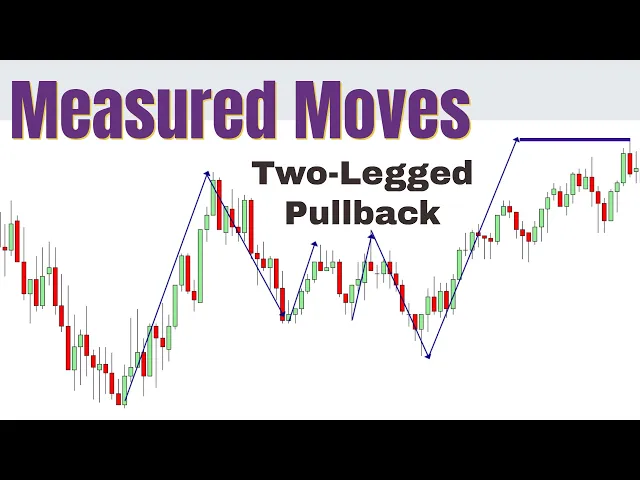
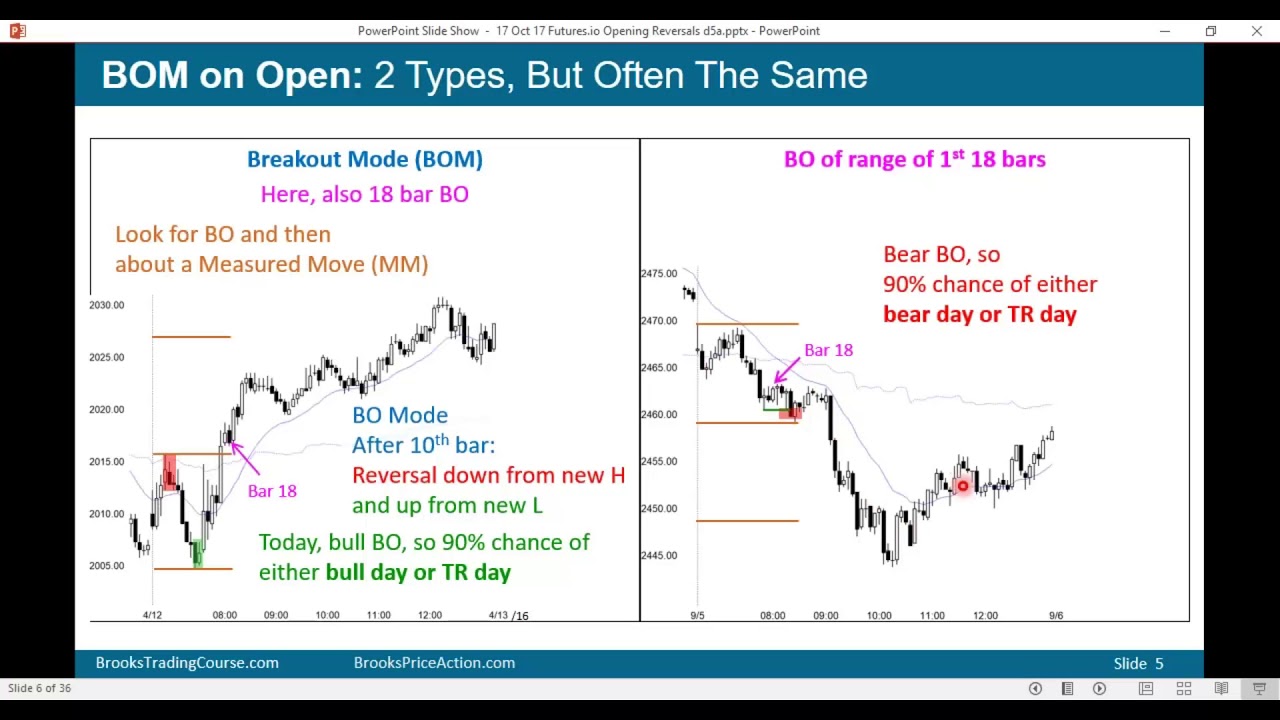
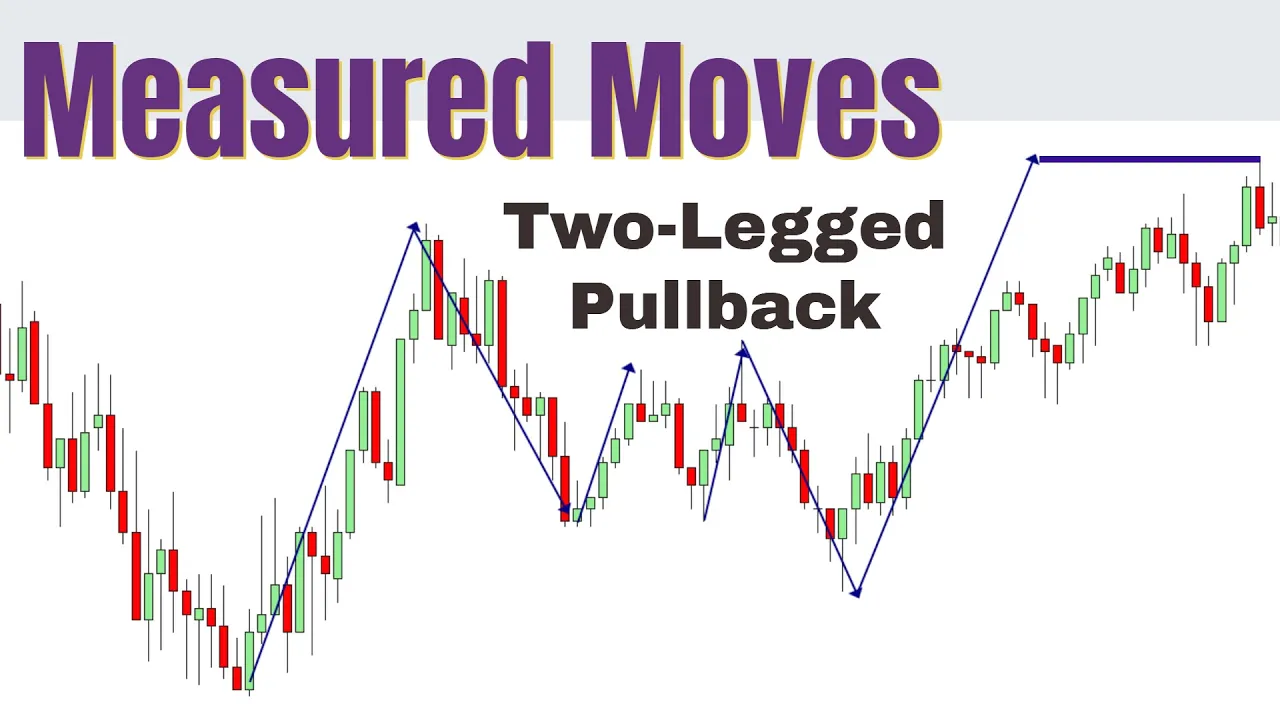
market geometry is a real thing and together with price action they are interrelated and not just two separate entities understanding market geometry can help trader understand price action and can help trader to predict where the moves are most likely going to happen because overall market loves two moves in twos and you guys can see i've proven this many times market overall likes two moves in twos there's a thing called two-legged pullback and it works it is tied to human psychology and we can use a tool that is called a measured move and measurement basically relies
on predicting the second lag that is most likely going to follow because market just is not moving in just this one moves up down up down you guys can see that the market has corrections and what the measured moves relies on is you're going to measure the first lag of the price action that is occurring so at this point on this is a downtrend and we have a first leg working lower and you have a break of a trend line and you know according to price action rules that the sellers are going to be looking
for a new low and you may be wondering if you're holding a runner or some sort of swing position where is the move most likely going to go so this is how we can use the measured moves you guys can see this is the first leg this is the second leg it wasn't quite measured but it goes deeper than that because there are two legged moves inside a two legged moves so this would be on the slightly bigger picture a bigger leg one leg and this would be the second leg so you guys can see
one leg pull back second leg here we have a leg working up higher one leg correction second move up and inside this two-legged move up there is two like a move down this one is not measured at all but market moves in tools market creates two like a pullbacks here we have a move working up higher we have a break of a trend line so we are expecting a new high and we have a move up but as you guys saw on the previous example this two legged move up one leg second leg up that
is slightly more choppy this was one leg and it creates the second lag with this bigger lag so measured moves can be used to help you navigate the markets and where you should be keeping your runners they are not a single tool that you should be using alone this is just a helpful tool that you can have in your toolbox while you're trying to read the price action just look at the measured moves and here's a another example here's a one leg down pull back second leg down break new low market laps two moves in
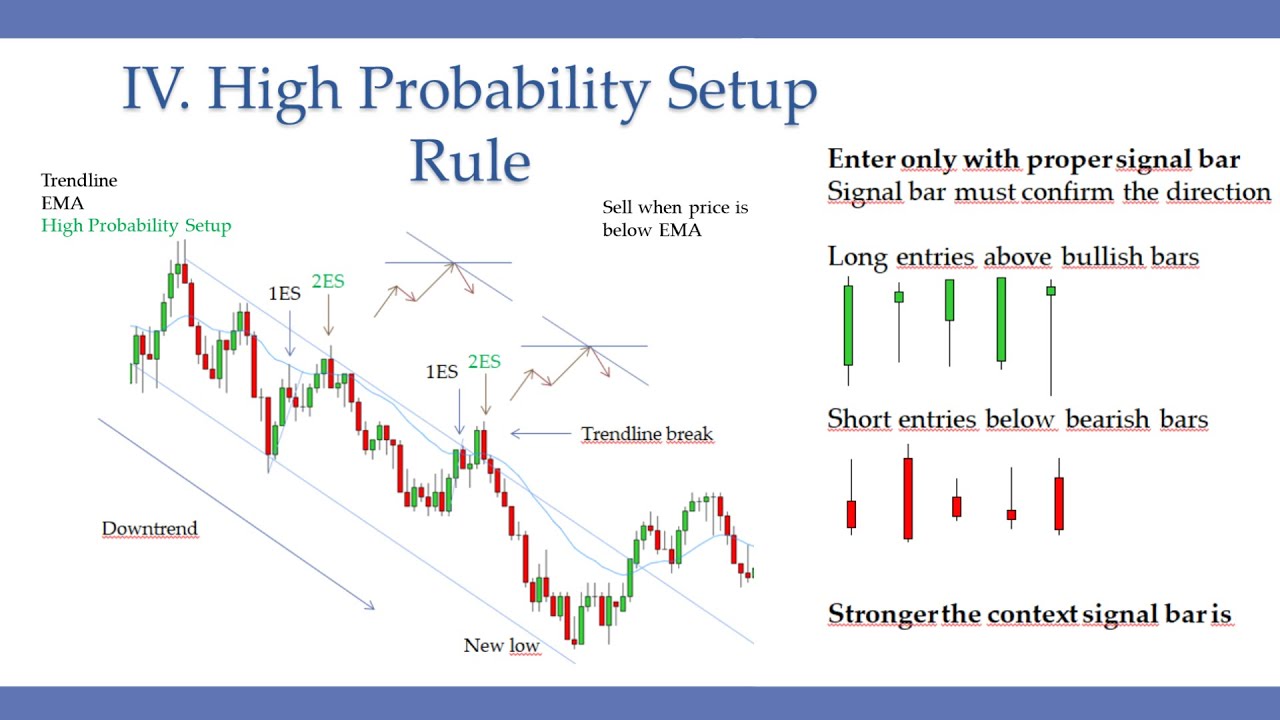
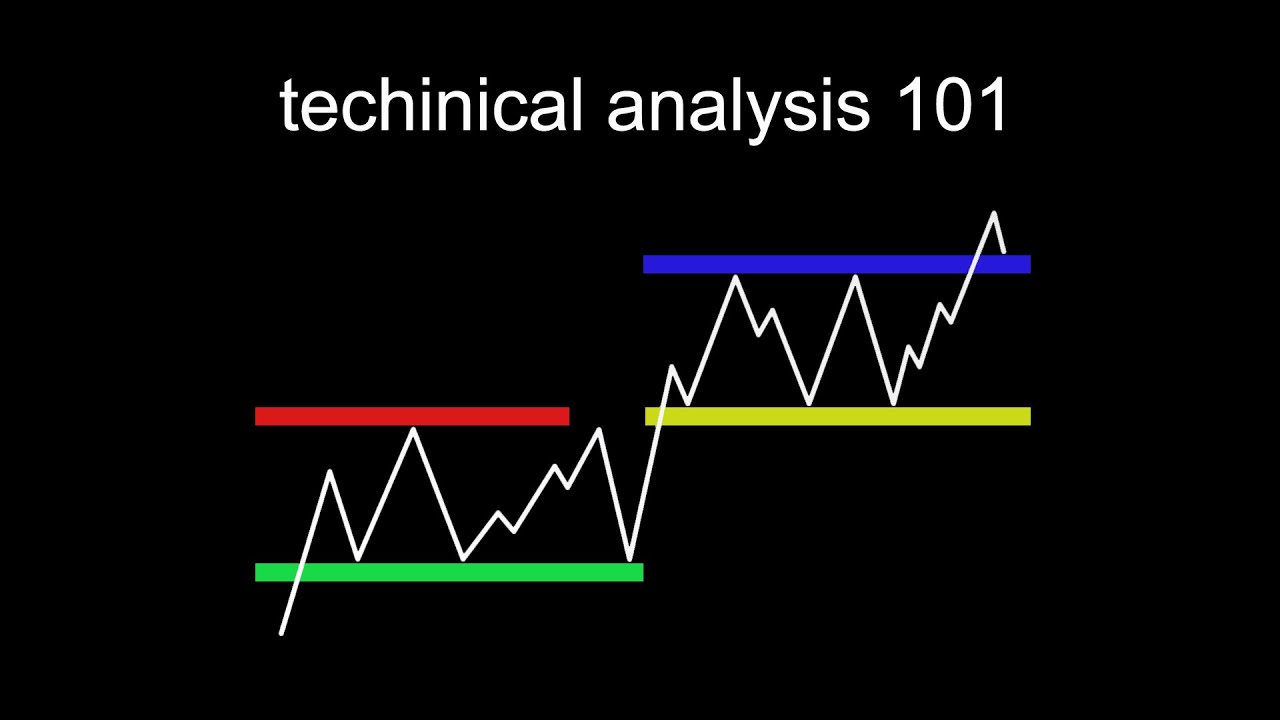
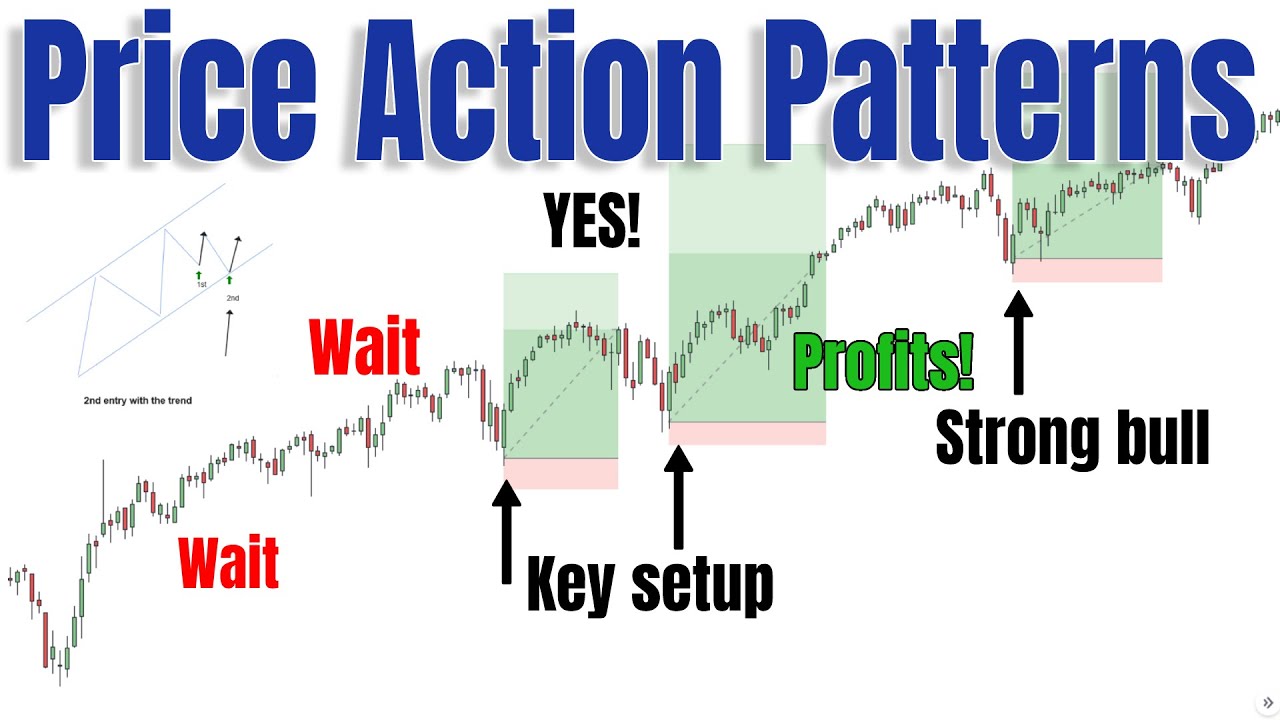
twos and there are two legged moves on lower uh time frames as well on smaller picture first century long second entry long this is a two legged move first century long second inch long two legged moves so overall we are looking for the two like a pullbacks for the second entries at the high probability setup and as the market today started the price action started with this downtrend we have a break and a new law so you have to draw the short term trend lines to help you analyze the chart because you know the rules
of the trend line after break there's going to be roots of a new extreme and with the new low you are expecting a possible correction or straight up reversal you guys can see the prices were working up higher prices are inside of this channel that fits prices nicely we have an overshoot with most likely going to leak to a break of the little break of the channel this happened two-legged move and a new high so this bullish correction is over but at the same time this very downtrend was over so price action right here was
really the consolidation and it was fairly hard to read what is going to happen most you guys can see there's a double top form and triple top right here there are multiple bottoms right here but i did the mistake of not drawing the clear key levels this is what you should have drawn right here with this double top right here you felt break higher and you have multiple bottoms right here but i didn't draw it at the time i just was relying solely on these trend lines and it was my mistake i got too comfortable
nevertheless you have this new high first century long pull back second entry long so you know but we are now we are shooting through the ema so you know this uptrend is over and there are no polls left in the market because we are shooting through ema we pull back the ema this is just the first entry and market moves into so first entry is not really reliable and you make a second entry long trap but look how far away you're from ema so even though this is a second entry long and we are in
a downtrend currently we are so far away from key entry point that market is most likely going to snap soon and it made that one little push down lower before it railed up higher but this is not high probably set up so i cannot market because it's not according to our rules and prices reverse and they push through the ema and unfortunately here we have a first century short and market i was hoping for market to give me a failed second entry short at the ema this would be brilliant but it didn't happen market went
out without me and second entry short happened this far away from ema at the very height of the move and you know how how i feel the reversal pattern you already missed the reversa pattern it basically didn't happen it needs to be at the ema and it needs to be much closer this is already way too late but i entered this was my first trade and i only took two trades today i took this one and i took this one and this is the new high first century long pull back second entry long and once
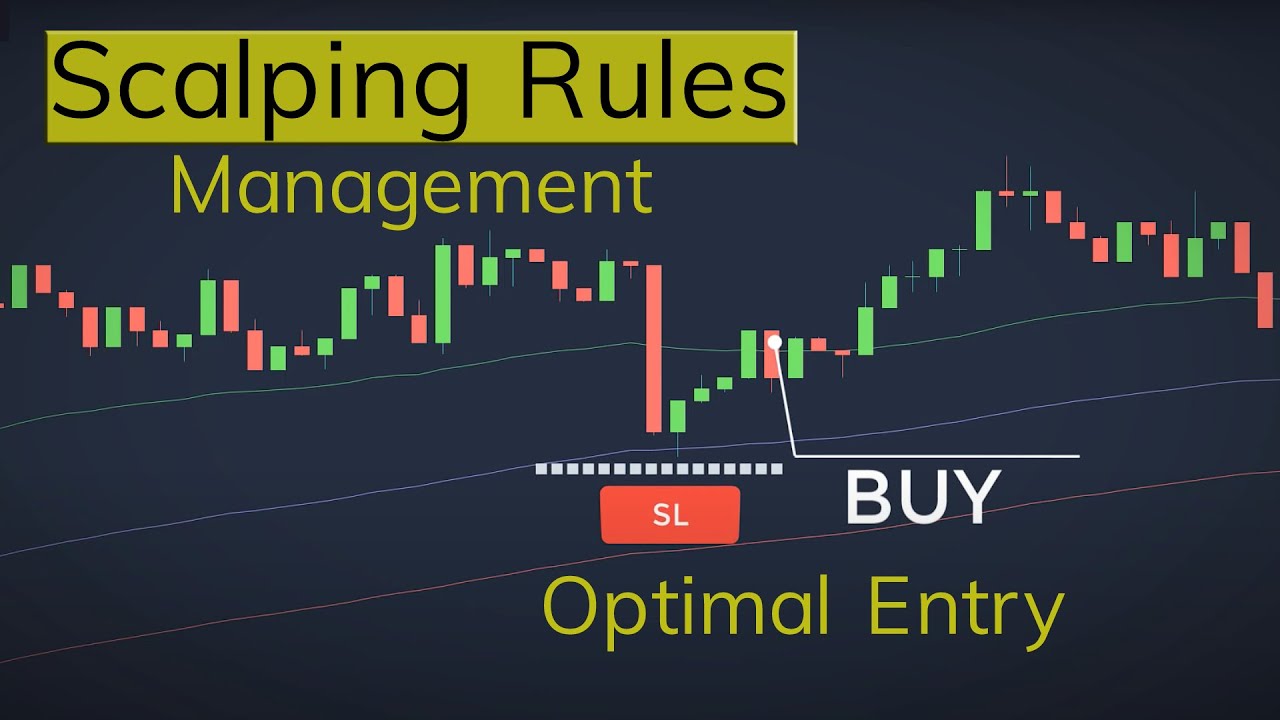
again if we measure the legs this is the first leg working lower you have a bullish bar so the this is a correction and this and the second and the second measured leg down so two legged move two at the ema and what i did because this is a burst bar and you cannot enter above this bearish bar and this blush bar is way too big so i drop my limit order exactly to the end of this bar to this level so i got filled on this bar made the scalp of course they came back
and got the runner unfortunately but now you have a break and a new high and even though you have a new law right here first century short second entry short nice bullish bar of the ema you already have a new high and you don't know if it's going to keep working up higher at this point or this is what you would see and it's not really clear whether you're gonna go higher or not so this is the safer entry second entry long high probability setup we're waiting we have a break and we wait for a
new high and we have a break in a new low of this short term downtrend and price is made in new high you guys can see double top right here so with prices making a new high you're expecting a correction or possible reversal that the bulls are be weakened at least for a short period of time your first century long you push through ema beautiful big bearish bars second entry along closing below ema look how ema is rejecting the prices is not letting prices close above the ema only below ema beautiful bearish reversal bar i
dropped my limit order there is a gap i didn't get filled prices didn't even take one tick back they just quickly filled the scalp portion of those people who use stops so i missed this trade and i drew the shortened trend line once again you have a break and you low so you're just using these trend lines and you're just following the price action hoping that the rules are going to pay because nine out of 10 times they are going to work you have a break new low you have a first entry short you push
through ema second entry shot and you close above the ema the reason why i didn't take this trade live because i didn't have my key levels drawn on the chart and this was my cardinal sin today big mistake by me i was trying to play play too cool but you always have to draw these because trading will become so much simpler how easy it is to find this quadruple bottom and triple top right here and it also gives validity to this trade i didn't even notice this real time now you get two key entry points
you have a felt brake lower support is holding second attempt support is holding big bullish bar and we are pushing through the ema what i like better is drawing this trend line and have a first century long pullback second and too long off the key entry point to like a pullback according to our rules and prices worked higher you have a breakout higher it failed there is a pullback and this is going to be known as a breakout pullback i normally don't mark breakout pullbacks because they are not reliable only reason you want to mark
breakout pullback is when they are at the good key entry point and is the second entry just like here first century long second entry long you have a trend line you have ema and you have this resistance that now acts as a support this is a valid breakout pullback trade if there was on this trend line or the ema there was just this resistance that now acts as a support this would be very iffy trade it will be like 50 50 but with the key entry point together here this can be very 80 or 90
probability trade and is the second entry long and but the signal bar is not ideal so i would definitely use the limit order here but you know to close up the measured moves can be very helpful and don't rely on simple on just measured moves they're just a tool to you know help you a little bit to predict where the market is most likely going to go and just like we have a two legged move here together it created this one leg pull back second leg down so there are two legged moves inside of two
legged moves and marker geometry is very real you guys can see that the second entry longs are very violet and felt second entry longs if you're looking for the trend reversal trend change entries because we have a break at a new high so these were the trades for the day don't forget to use those measured moves and market geometry with price action are definitely real and very reliable tools for your trading so i'm gonna wrap it up and i'm going to see you guys in the next one bye guys