good afternoon my name is david velasquez and in this data mining presentation i am going to be using wicca to do an analysis on the quality of red wine to to start off with um we'll go to the raw data and this is how i got the data from the uci repository and in this format wake up won't be able to work with it to do an analysis so we have to convert it to a format that it can work with so the first thing is to convert this from a comma separated to a column
separated attributes type uh data set right like this now the next problem is that all this data doesn't have any uh normative or categorical attributes so i need to create if i don't create any categorical data wicca won't be able to do an analysis so what i use here is an if statement which is going to provide me categories for certain assigned quality values all right so now i have low quality wine average quality wine and excellent quality wine which is derived from the quality uh numerical values here right so from there now we have
that data set we save it the next thing to do is that we need to convert uh that csv file into an arff file which is basically a file that wicka can read and work with so we go here we look for the file that we just pre-processed right and this here it is and then to convert it we just save as and from a csv we just convert it to an rf file save it and it is ready to go and to work with so here we go to our gui interface for weka and
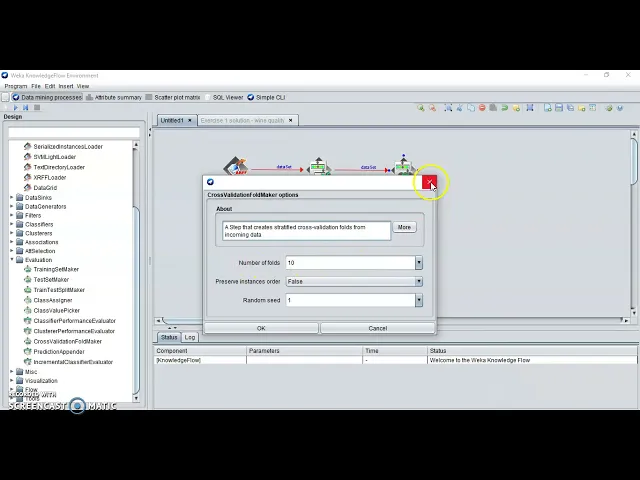
we start um creating our model to see what kind of uh conclusions we can derive from the data set so here we go and we find the uh the file that we just convert it to an arff file so we can work with it okay then from there the next thing to do would be to get a class assigner and then from here we drag the data over to the class assigner next thing to do is to configure this we need to make sure that we're assigning the correct uh response variable in this case we
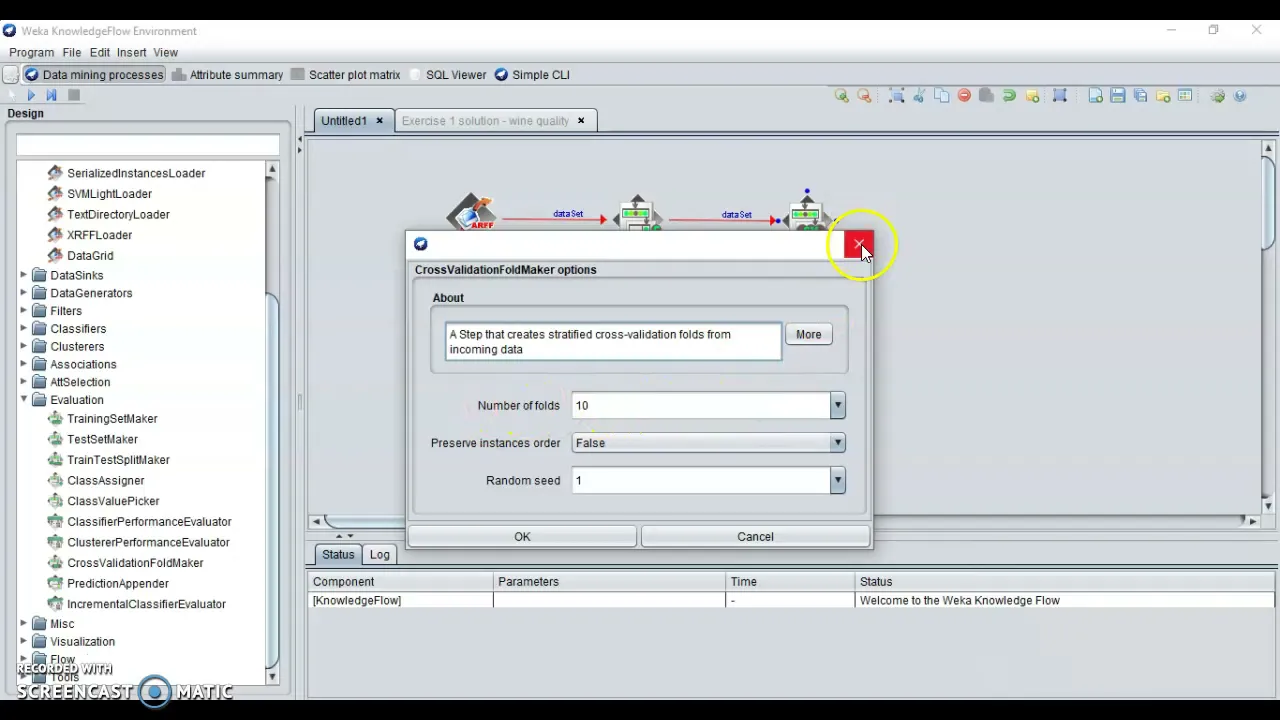
did it automatically see nom nominal value quality class that's the last column that i created in the data set so right we have that ready uh the next thing is the cross validation [Music] [Music] folder this is what's going to cross validate the the training set right this happens automatically but it's a 10-fold just to make sure it's a good model uh cool and then from here we're actually gonna use the um the method that we're gonna use to analyze the data and in this case we're to use a decision tree here's the j48 and
here we do we set our training set and our test set right yep classifier performance evaluator so we're going to use this to evaluate the decision tree and make sure we're getting reliable uh conclusions from it [Music] okay and then the uh the last step of the process is the actual visualization and this is where we can start deriving our conclusions so text viewer and a model performance charts you get some visuals okay now to confirm that it's all working correctly we run it no error so it's working beautifully okay now some of okay here
we can see some of the results so this is um a way of how wicca breaks down the data so it tells you how many instances we have in the records for example based on the classes we have 13 a little over 1300 of average class wines we have about 217 that are excellent quality wines and 63 that are low quality then the interesting thing comes with this where we can actually do some visuals and uh play around with the data right so here we set this to the color quality to the class which is
um the quality class that i had created uh for this guy you can do a numerical value the predicted quality class that's right here and then here we can just start playing around with all the different variables and see kind of like what sticks out and what the data's telling us so from my analysis one of the variables that i saw had a significant contribution to the quality of red wine so this was one of them the volatility acidity so from here we can see that so red is excellent wine uh blue is average and
the green is low quality so we can see that uh the best of the best wines tend to have a lower index in terms of volatility acidity right tends to end here around at about 0.85 0.75 whereas all the other wines have to have higher numerical values for for this so that's one indicator low volatility acidity means typically it's a good indicator that you have a good quality wine on your hands uh the next one was the uh sulfates so here's another one that i noticed that the data was speaking to me so same kind
of thing as the last one i noticed that when it comes to the excellent quality wines they tend to have less sulfates than than the other ones so average i can see that like even the low quality wines they have sulfates some points that are are really on the higher end of the spectrum um and if not very low and then the last one and i think uh the biggest contributor uh that kind of talks to us is the alcohol content so i noticed that um 12 seems to be the magic number so wines that
are of low quality do not typically get higher than 12 you can see that all the data points lie right around here below 12. so basically it's a good bet that if you find a wine that is 12 alcohol content or above that it's to the very least going to be an average type line or uh excellent quality wine right based on how the data is talking to us here so um here's one way that uh wake up was able to help me explore this big data set and draw some interesting conclusions thank you very
much