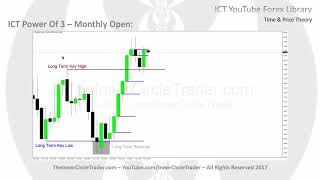
okay folks welcome back this teaching is going to specifically deal with how to find explosive price moves before they happen all right the points of focus in this module commitment of Traders weekly range contraction and daily range contraction okay so we're taking a look at a commitment of Traders report in the form of a line graph or net Traders position chart and that is going to be this little graph down here okay this is not something that I've created or made up this is a longstanding staple in technical analysis Larry Williams popularized this from his
uh work with the commitment Traders or cftc reportable report and the commercials this red line you see commercial speculators I'm only interested in tracking this red line okay and by following this on a longer term time frame it'll help give warning signs when there's a potential impending reversal which when it's a reversal they sometimes can be explosive in nature but the cftc weekly nit Traders position is the data that creates this graph and what we do is we monitor 12-month commercial extremes that means the highest they've been in the last 12 months or the lowest
they've been in the last 12 months and we look for the levels where they reflect net Extremes in other words they will qualify support and resistance on a higher time frame chart okay so let's take a closer look on how we can use this information first we have to draw in our zero line here so the zero line delineates anything above the zero line the Traders that would be depicted with their respective colors like the blue speculators they're usually you know Street money they have no idea what's going on and the large speculators are the
green okay they're going to be diametrically opposed to the commercials Now does not mean that they're wrong it just means that they are the ones that are Trend following in nature you can see as the market dropped lower on the Euro the green line depicts that the large speculators were selling short so below this zero line they are sellers above it denotes buying so we can see the commercials were buying all through this decline now right away you're probably saying well you know how how's this useful we want to look at Trend and we also
want look at key levels that the commercial support this low here they had the largest position of Longs one at the time and the market created a low and we went sideways and then dropped down one more time we had an increase of buying by the commercials and I'll show you what these reference points are here with this horizontal line and I'll add our first area of buying interest by the commercials and the second one here see they're ramping up this big jump up in the red line and another one over here where they're above
the zero line and we're at that same level so they are above the zer line and we're at that old level where it's bounced before so this could be a key support level now notice that they are giving you Insight that you otherwise wouldn't glean if you look at just simple classic support and resistance theories again it takes you back to the question which support which resistance so from a higher time frame standpoint this is one of the things I like to teach because it gives you a context behind support and resistance levels that in
my opinion are key now with this understanding in okay we know that they have been bullish all this time long period of time for like two years they were buying buying buying buying building up large positions and then we had a rally up notice that this reaction off here was below these two equal lows not surprisingly this move up has taken us above these two relatively equal highs and we are potentially in an area where we could come back down a little bit lower and that takes me to the area of business on the commercials
now because look where they're at we're below the zero line so they may be indicating a longer term shift in the direction on the Euro we could see it come down a little bit lower so this is a warning flag if you will to monitor what the euro is most likely going to do at least from the long-term standpoint the commercial Traders folks that are long-term hedgers they're already hedging in some bearishness on the euro dollar so I use this information to kind of like build the idea around potential future explosive price moves okay next
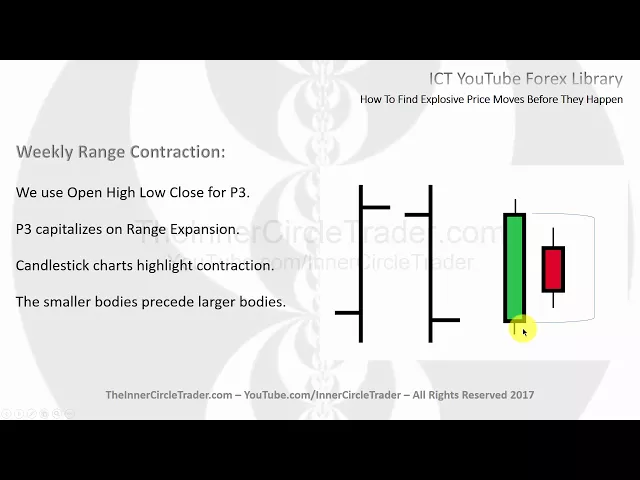
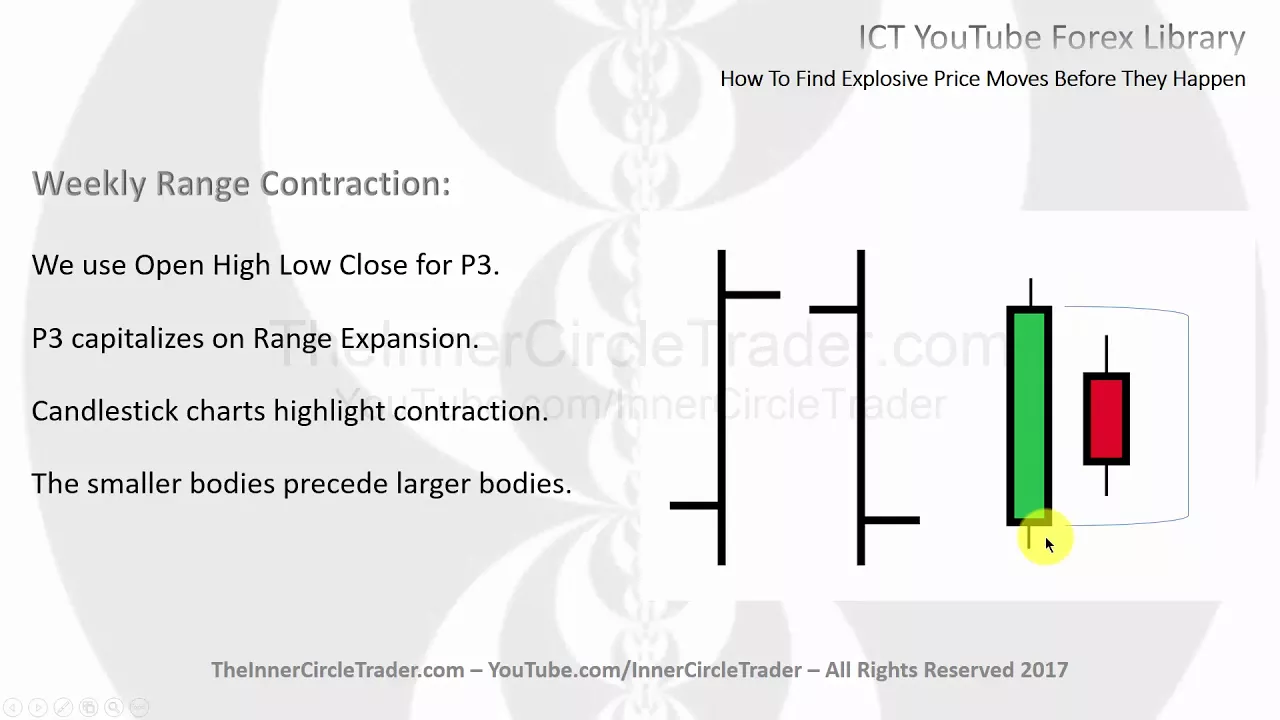
we're going to talk about the weekly range contraction all right as you can see here when we use the Open high low and Clos bar okay this is a graphic depiction it's very easy to see at least for me it is when we're using power three if we're bullish we're going to be looking at the open price and then drop down buying anywhere between the opening price or just a little bit above it's still okay but mainly looking for a move below the opening price that's what we're looking for power three bullish and when we're
bearish we're looking for the opening price and then a move up to sell or fade that rally and then ride it lower for a down close now that's assuming that we know there's going to be a large range day or a directional bias that lends well to this technique power three capitalizes on range expansion so we had to know the likelihood of this phenomenon happening otherwise we're going to do it wrong so now if the opposite of range expansion is contraction how can we find that well the Candlestick chart helps highlight this so if we
look at a Candlestick like this say this is a typical large range day okay which would look like something like uh this open high low close here it could be very close to that in terms of the body portion between the open and the close so we have the open down here and the close up here if this is a bullish candle if this was the uh body of say for instance a Tuesday and then say Wednesday we had this type of body we have a smaller bodied candle which means that we could see a
large rains day on Thursday or Friday it's a it's more or less a uh a precursor if you will because smaller bodies precede larger bodies so if we're always looking for action in The Marketplace and it's already moving you're chasing price so you want to anticipate when price is going to have an explosive or large range or big move or series of big moves and it's going to happen by studying the bodies if the bodies are getting smaller okay if we see that it's going to be a directional move in magnitude that's larger than it
has been in recent days or Rec weeks again depicting the top of the body on here and contrasting it with this one here so that's the difference between of what I'm looking for okay so the weekly range contraction we're going to be looking for candles that begin to compress ranges that have smaller bodies or key that's the ones that we're looking for and we're wanting to trade when they form big ranges come after small ranges form and we ignore the Wicks we're focusing only on the bodies of the candles okay so let's take a couple
examples here as you can see here at this swing low we've had large body candle large body candle and then look how small the body gets here then we have a turning point in here price has been moving up up we went sideways and now look what happens the bodies between open and the close they get very very small disregard the Wicks okay try to block that out focus only on the open and close relationship when that gets small what's about to happen is you're going to see an expansion and this is when anticipating power
three like the open here small down move buying holding for the close near the end of the day at the top of range similar scenario here which we can see again small bodies form after that large one okay we know there's going to be a large range coming so we want to be focusing on what what's the trend it's been bullish so we can be looking for open decline buy it look for expansion on the upside next same scenario open down movement buy it hold for the close Okay similarly we can see at this swing
High we have a small little body in here again disregard the Wix again small bodied candle in here disregarding the wix and large moves after each one of these we're seeing large this is the weekly chart okay so there's a lot of Pips in there another opportunity here you can barely even see a body in this very very indicative of a large range move and we see a series of three weeks that come by way of bullishness over 300 and some Pips available from that one then we have a small range again so what's going
to happen we're looking for range expansion the candle forms and now at the time of this recording we have a very small body candle again so weekly range has been compressing so we're looking for a large weekly range next okay now obviously as I said with the weekly range everything is the same for a daily range contraction so without repeating myself I have it here for your notes but let's take a look at a couple examples from the daily perspective okay we can see up in here after the swing High we have a very small
body candle disregard the wick we don't care about that we're looking at the body of the candle very small little compression if we are seeing the range compression and contract smaller and Tighter we know there's going to be a large expansion so the next move if it's directionally determined higher or lower we can use power three Concept in that light here we see it's bearish open rally sell the high hold for the close so we have several days of down movement look at the large ranges that just follows right after that small range body next
opportunity comes in here price trades down at an old low price ises a big range down and then we have a small range day here okay so it's an inside day relative to the body okay this is my insight on inside days I don't care about the Wicks okay uh most trading team teaching circles authors gurus whatever they would never classify this as an inside day because we have this long Wicked portion of the candle that went below the previous day so that would negate this being called a inside day but from the standpoint that
I'm teaching range expansion and contraction this is in fact an inside day okay so that means there's going to be a large range expansion or a series of movement that's directional after this day forms we see that here several up Clos days okay and creates a swing high range gets small here so we know that there's going to be another series of movement we have down closed candles right in here we have small ranges relative to what's happened recently okay so there's a rule of thumb I use I want to see what's happened if it's
a daily chart I want to see what's happened in the last 5 to seven days okay I look back about 5 to seven days for range contraction and expansion so that filter for volatility on the daily chart you want to look at about 5 days which is typical trading week but then I also use seven days because it may have to look back into the previous week as well and that gives me this whole Criterion here and we can see that there's a large range day in the last seven days here so that means these
are relatively small in comparison so we know there's going to be an expansion due large range day large range day and then we go smaller okay looking back we have a large range day here so these are relatively small so we know what's coming large range days Big Range day okay down here at an old low we trade below that low and now look what happens we have small ranges barely any range here at all big expansion on the upside and then we go into a small range here big ranges come and then right in
here after a swing High small little body okay again disregard the Wicks they'll trip you up that's all stop running on both sides of the marketplace they're taking all the Traders out and going right back into the middle and then the big move takes place down explosive price action on the cell side reaching for an old low rejection and now at the time of this recording last Friday we have a small range body again so we know there's going to be expansion due coming in the next couple days so we would look for large range
days form so as a Trader we want to see movement and by having a study of when that movement is expected not just where to buy where to sell you have to have an expectation for magnitude and velocity how much can the move be seen before it happens is there going to be excitement and an is it going to be animated if you will and what I do is I look for when things are getting quiet that means the the Traders are going to get bored with it and when they're not paying attention to it
it takes off and then everybody else in the retail world will chase it once it's expanding I want to be in before the Big Move happens because I'm most likely going to be in while it's expanding up long or expanding lower and being bearish I hope you enjoyed this presentation if you'd like to find more you can visit my website at thein circet trader.com