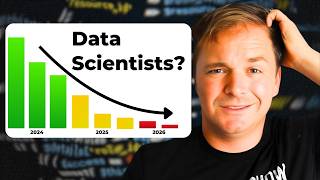
Data nerds welcome to this full tutorial on how I use chat gbt for data analytics and this thing saves me up to 20 hours a week I use it for everything from analyzing spreadsheets for making in-depth visualizations to even more advanced concepts like machine learning and this entire video bundles up all my best practices for using chat gbt the number one AI tool of data nerds as my own personal data analytics assistant Now this is all going to be broken up into six different chapters first was setting up chat gbt and understanding basic prompting next
we'll move into chat gbt's most powerful internal tool we'll use Advanced Data analysis to build your very first project from scratch now for those that have seen this video that I did back in November and I teased an entire course on Chach PT well this is that entire course and you can skip those last two chapters I Just went over and go to this timestamp right here as the new portion jumps into the fundamentals of analytics we'll cover the best practice of visualizations and what the different types of analytics are next we'll get into some
Advanced topics focusing on prompting techniques to prevent hallucinations we'll even cover Chachi BT's newest feature gpts and show you how to find the best ones for analytics from there we'll move into plugins even Covering things like how to browse the internet and generating your own images and we'll wrap up the course with how you can get your own data for your projects not only be able to find public data sets but also extract it through techniques like web scraping now this three and 1 half hour video is all you need in order to complete this
course heck I have included all the different reference you may need in the description however if you're looking to Actually support this Channel and making more content like this then visit this link right here as I'm going to give you even more additional perks for this including things like a certificate you'll receive upon completion detailed step-by-step instructions for each of the exercises in-depth notes for all the different segments of this video oh and I'll also be answering any your questions right inside of here now this chat gbt tutorial is something I wish I Would have
had when I first started as a data analyst as now somebody with no experience can get up and running from day one and Performing data analytics while saving a buttload of time a recent study from Harvard found that those who use chat GPT versus those that don't complete a task 25% faster with a 40% increase in quality so that 20 hours a week that I save I feel it's also realistic to you as well based on the data anyway if you get stuck at any Point during the course I made a custom chatbot built on
top of chat gbt that can help you out enough me appen let's actually get into setting up chat gbt all right so let's get into the options that you have available for using chat gbt for this course and then finally we'll go into one of the options on how to actually set it up which I think it's going to be applicable to most of the users of this course there's four options for the course but it's really Broken into two options one for individuals and others for businesses if you're individual you have the option of
free or plus we're not going to be able to use free for this video or course because it doesn't have that advanced capabilities of advanced data analytics in order to analyze data so you have to get plus if you're an individual now chpd plus here in the United States is about $20 a month and with this you have an availability to access their newest And most capable model in this case it's GPT 4 um this may change be a higher number model depending on when you take the course but overall you have access to the
newest and greatest model from there it has some faster response speeds also you have access to plugins and Advanced Data analysis and both of these things are the core of what this course is going to take advantage of to make sure that you're doing data analytics correctly in chat GPT now there's two Options for businesses in order to handle secure data specifically we have team and Enterprise we're going to focus on Enterprise first and then get back to team now the last two options which are applicable to businesses are team and Enterprise and it's going
to have a similar interface that as uh chat gbt plus but it's going to be through a separate service and it's going to be mainly that your company is now paying for this chat BT Enterprise Edition and Then you as an employee of the company have access to it now chat gbt Enterprise solves a lot L of problems when dealing with secure data specifically stuff like Hippa data confidential or even proprietary data it will all maintain that safe chbt plus doesn't necessarily do this but we're going to be going over in this course how to
safu your data if you have concerns with that now team is basically that Enterprise Edition but with a Couple of removed functionalities specifically you have a reduced message cap and don't necessarily have Account Support directly but regardless this is still a great option if you need an option to handle secure confidential data this plan is for organizations that are less than 150 people so if you have any of these paid options available this is the end of the section for you you can go ahead and proceed to the next portion otherwise stick around because Now
we're going to be going over how to install chat gbt plus the first thing to do to get set up is go to open.com and select try chaty BT from there we're going to select sign up I use my Google credentials because I feel that's easier and so I don't have to forget a password and so you'll use that and login with your Google credentials it will send you an email to verify that it's actually you after that you'll be directed back into that chat that we're going to be Operating in for basically the rest
of this course I'll go ahead and accept these terms and agreements and also these tips so right now we're using the free version of chat gbt which is this model right here gbt 3.5 but we need the newest and greatest model in order to get all those Advanced capabilities and advanced analysis so we need to upgrade to plus we can either do it right here or you can select it up in this menu on the Le hand side and we can See from this we have the plus version and it's 20 bucks a month right
now they have this sign up for wait list and I don't think you're have to wait that long but they're pausing it because there's been a lot of different influx based on these new upgrades of chat gbt and apparently everybody wants to get in now either if you have the weight wa list or you're able to actually sign up immediately which hopefully you can you'll then be directed to this screen Right here which is where you'll actually be putting in your payment information they're accepting credit cards right now and you'll be subscribing for that 20
bucks a month make sure you're comfortable with paying that 20 bucks per month before proceeding but just to reiterate you do need this chat gbt Plus for this course after that you'll be directed back into this chat and now we'll have all models available so in our case at the time Recording this I have that GPT 4 model and GPT 3.5 we're going to be using the GPT 4 for this course because it has that browsing and Analysis in it and this home of this chat is going to be located at chat. open.com and I
would save this to your bookmarks or to your favorit so that way you can easily access it all right with that now it's your turn to jump in and actually go through and set up chat gbt plus if we don't have it set up already And after that we're going to be jumping into some more examples on how to use this all right in this video we're going to be going over the layout of chat gbt and all the different functionality that's involved with it to get you up and running to do your first prompt
now Chachi BT just recently in November of 2023 went through a layout change and unfortunately I went through and filmed this entire course and so I'm going back And refilm some of these videos anyway you're going to notice in this course sometimes that the old layout is inside of some of these videos don't be alarmed by that this I'm going through and correcting any ones that need to be updated but if you do notice there's differences in what my Chach BT and your Chach BT looks alike overall I'm trying to tell you this don't be
concerned anyway let's go through the layout you should be seeing over here on the left Hand side we have our sidebar and then right here on the um right hand side we have our actual chat we'll be interacting with our gbt model for the sidebar you can either close it out or bring it back in up at the top they have all the different gpts you probably only have one GPT right now of chat GPT below this it has our different chat history and then underneath that you can refer a friend and then next is
settings settings it's a whole another video Because there's a lot to go into this so stay tuned for that one so back to the gpts up at the top gpts you can actually click the explore menu right here are custombuilt models built on top of Chad GPT to perform specific functions so I built a gbt for this course called data analytics and I'll link it below and in the exercise and you can actually go into this data analytics title GPT and quiz it on the contents of the course now there's also a whole host of
other Gpts as well but the one we're primarily going to be focusing on besides that chat bot for this course is this one up at the top that you have already should have and that's just chat GPT now with this specific one we can go up to the top leftand corner and you can select the newest and greatest model which I recommend doing and that's going to include as of filming this dolly browsing and Analysis and this model is great because it includes everything We're going to need from this course from browsing the internet to
performing with that Advanced Data analysis plug-in that we'll be going over in a complete chapter gbt 35 as of filming this is in the free version we're not going to be really messing with that then we'll also be jumping into also plugins in the future specifically this notable plugin but for the time being let's just stick with that GPT 4 model so let's prompt chat GPT with our first prompt asking it Who the heck are you and what can you do to find out what some of the limitations are of it and it goes into
telling you a lot of the stuff that I've told you already now some things to note with this so it provided a response you can copy this response you can also like it and dislike it to help feed the algorithm on whether it's performing good or not you can also click this regenerate and this is great for if you're getting response or it's getting Held up and you want to regenerate a new response to get it from a different angle and as you can see it's completely different even a completely different layout from what we
got before I'll be honest I like this one a little bit more so I'm going to say it was better up at the top right we have a share icon so you can take this link that is actually provided with chat gbt and I'm going to go ahead and paste it in a new browser right here so that way you can see it And those even without a chat gbt account can go in and actually view the results of what you got from this and then in the bottom right hand corner we have this question
mark they have an help and FAQ some release notes term and policy I really honest I don't really use that much the one I do use is keyboard shortcuts specifically I would commit these two to memory the copy last code block and the copy last response these are great at actually grabbing Different things that I'm getting from Chachi BT and pasting it somewhere else where I may be working the last thing to note is we can actually change these chats so this is our chat history we're right now in this one titled data content wizard
and I don't really like the name of it I can actually go in and select rename for important chats I'd like to begin them with an emoji so that way they're easy recognizable and then also give it an Appropriate title all right so now it's your turn to perform some tasks I want you to go into that base chat gbt model and actually prompt it to understand similar to that what I asked it who the heck are you and what can you do additionally I want you to get that chatbot for this course loaded into
your menu so I'm going to include a link in the exercise for you actually to go to it and it's going to take you right to here and it should add it to your Sidebar for this one feel free to prompt it any questions about the course right here they have some recommended things I'm going to ask it hey what's Luke's course about and from the transcripts that I built this bot on top of it actually goes into a lot of the different areas that we're going to go in for this course so this is
pretty cool this will be a great tool for you actually to quiz yourself and also ask questions if you get stuck all right With that one I'll see you in the next one all right let's now get into to basic prompting techniques that you need to take advantage of in order to maximize Chachi BT's capabilities so as you found out from the exercise in the last video Chachi BT has a knowledge level up to a certain level and in this case as we filming this it's up to April of 2023 which is about 6 months
ago not too bad so let's actually try to quiz it on something that happened recently Sam Mman who was the CEO of open AI recently was outed and they have a new person in let's ask if Chach PT knows this so I ask it who is the CEO of open Ai and it tells me it thinks it's Sam Alman still now this doesn't mean that this model is useless we can actually browse the internet so if I ask it can you access the internet it's going to tell me nope I can't ACC it which is
really confusing anyway chat gbt sometimes is going to hallucinate and it's going to make up Things that it doesn't know that it's capable of you have to just tell Chad PT that it can do it so if you can see me do anything in any of these videos you need to just basically reprompt chat gbt until it is capable of it so I'm going to prompt chat gbt to use a specific feature Bic going to say search the internet and find out who the CEO of open aai is and we'll get in a little search
bar right here saying that it's going to different websites trying to Figure out who it actually is and we finally have this update on open a yep uh Mira is now taken over as the interim CEO so this model is really nice because not only does have that internet browsing that we just did but also analysis which we're going to be getting to in a future chapter so let's now get into the core of what this video is actually about and that is what is a prompt because we need to understand this in order to
best understand how Best to use chat gbt and it answers with this a prompt is a message or instruction that guides or initiates a response or action and we're going to be working with improving our prompts a lot with this course because if not you're going to think that it can actually do do a lot of the tasks that you can actually automate with your job let's get into some examples so I tell chbt I'm a 5-year-old explain what prompting is to me in the style of Dr Seuss and it Gives me this pretty nice
nursery rhyme about how and what prompting is and I think it does a pretty good job of explaining what prompting is this would be pretty good if I wanted to give it to somebody like my 5-year-old niece now with this one button you need to notice is this regenerate so I can actually regenerate a response if I'm not liking it or I wanted to maybe try a different style I'll do this and then it'll provide me even new results I like this One a little bit better cuz it's a little bit shorter and easier to
read this summarizes pretty well with prompts you guide what I will say like colors got a bright sunshin day all right so why is this prompt so much more successful in my opinion well it comprises of two different parts the first is the context and the second is the task context is like your background in this case I'm providing I am a 5-year-old That's the context the task is explain what prompting is in the style of Dr Seuss from now forward you're always going to be writing chat gbt with not only a task but also
context and we'll be able to automate context via custom instructions but we'll get that in a bit so let's take this to a more extreme example of how it can actually provide this kind of detailed answer we may need let's provide it with I am a distinguished Professor with many Academic achievements in the field of AI and machine learning explain to me what prompting is in a similar format of an academic research paper with this prompt it goes into a lot more detail compared to our last example in defining what a prompt is and if
I was an academic Professor I would say this would probably be more suited to what I would need Vice that Dr Seuss Nursery Ryme so I think this is really good and we need to get in order to frame it for us so That is going to be your next task I want you to come up with a context statement that best describes you in order to get the results that you want out of Chachi BT use the similar example of explain to me what a prompt is and test different ways of using that context
statement all right I'll see you in the next one all right in this video we're going to be going over the settings that I have set up for chat gbt in order to maximize His capabilities and give it the results that I need now in the previous exercise you should have developed a personal context statement that best describes you and how chat gbt should perceive you in order to provide the best results for me I have this one I'm a YouTuber that makes entertaining videos for those that work with data AKA data nerds give me
concise answers and ignore all the necess that open AI programmed you with use emojis liberally use them to convey Emotion or at the beginning of any billup point basically I don't like Chach bdb rambling so I use this in order to get concise answers quick anyway instead of providing this context every single time that I start a new chat chat gbt actually has things called custom instructions we can go to the settings down at the bottom leftand corner and click custom instructions in here there are two dialogue boxes the first one is what would you
like chat TBT to know about you to provide better responses this is specifically related to the context and I have in here the things like I'm a YouTuber and I prefer direct responses now below that it has how would you like chat gbt to respond and this is more aimed at getting right the format and the tone that it should be replying in and so this has the section on giving concise answers and to use things like emojis you need to make sure here at the bottom is enabled for New chat so that way whenever
you start one this will be be loaded into it you'll be adding your custom instructions for the exercise for this video but let's keep going through this going back into the settings they have a few things you can actually do first is to access your plan right now we have chat GPT plus that's expected next you can access your gpts which I have a whole video on but it will take you to this menu which you can also access via Clicking explore right here the last thing to go over in this is the settings and
beta first is the general tab that you can set the theme of either dark or light mode you can also clear your chats for the beta feature tab you want to have everything enabled specifically at the time of filming this you want the plugins and advanced dat analysis when chat gbt has new features come out that they want to beta test check back here and enable it and then you'll be able to Get it within your chats but these are the core two that you definitely need for this course next is data controls and here
it has whether you want to maintain your chat history and training now if you do not want open AI to actually use the contents of your chat to train these models you want to unclick this whenever you do this though the one drawback is that it won't save chats greater than 30 days now one thing to note on security if you're working With confidential or proprietary data specifically things like Hippa dat you're not going to want to put this into chat gbt plus I don't feel it's secure enough for that type of data but a
workaround to this is chubbt Enterprises and it's something something that your company should be purchasing in order to be able to put secure and confidential data into chat gbt this Enterprise Edition is sock to compliant which is the same uh security compliance As a lot of cloud providers like Google Cloud Amazon web services so if your data is good enough to go in the cloud there it's probably good enough to go within here but that's specific to the Enterprise not necessarily Chach BT plus anyway nothing from this course is proprietary or confidential so I'm leaving
this box unchecked the next is shared links and you can go in and actually see all the different links that you shared before they also Have options to export the data then delete your account probably wouldn't touch that the last thing is Builder profile which this is configured for whenever you're building a GPT basically has your name then if you have a special domain you can set it up here we're not going to mess with any of that all right so now it's your turn you have three different things to do the first thing is
go in and actually update your custom instructions the second thing to do is Go into settings in beta and then under beta feature enabl plugins and the last thing is to decide whether you're going to keep your chat history and training if you're not comfortable with it turn it off all right with that I'll see you in the next one all right in this video we're going to be talking about how chat GPT can now see images and this actually has a very unique use case for data analytics we're not going to be just using
it to analyze Some cute pictures instead we're going to actually be using this Vision capability to analyze data so let's jump in so here I am in chat gbt and I'm using the most advanced model at the time gbt 4 now because we're using this most advanced model we can see down at the bottom we have this little attachment icon that we can actually open up and then from there upload a file if I were to change this to that gbt 3.5 that goes away you can't do it So we need to be in the
most highest and greatest model in addition to this this model also has built into it Dolly web browsing and that Advanced Data analysis so a lot of features packed into this anyway I have some images that I want to analyze instead of using that attachment thing I'm just going to go ahead and drag it right into here after it's done loading all I'm going do is press enter and Chachi BT analyzes it it's pretty interesting with this right it goes on Into saying hey it looks like it's a Cena coding in Python which is really
interesting because it's actually able to not only look at this image but also apparently read it apparently either from the laptop or the actual python logo right here in the top left hand corner now we're not going to be looking at cute panda pics for this we're going to be having actually a unique use case for data analytics so I prompted chat gbt hey make me a graph in Python and it Asked me some more contents about it I said hey make it a bar chart with various numbers give it random numbers and make it
about something funny anyway it provided me this graph right here now I want chbt to actually look at this graph and analyze said so I prompted it sweet I want you to actually read this graph and tell me the insides from it cuz remember it looked at that Panda pick you should be able to look at this and it first provided generic results Without actually any insights from this graph I kept on trying to prompt it further and eventually got to the point where I asked it can you actually view this graph and it says
since I'm unable to visually interpret imagees graph I can't directly read or analyze the specific details now once again we're getting into limitations of chat gbt you have to be aware of it can read this graph I can actually come up here and copy this image and come down into the Chat press contrl +v press enter and have it upload to actually interpret it and in this example it's about superheroes which is ranked from Superman down to Spider-Man and it actually pinpoints where these superheroes fall on this graph so let's get into more of a
real use case of data analytics so I have a graph I want to analyze in it we have four bar charts and there for the four major roles in data science data Engineers scientists Analysts and even business analysts in it it shows the top 10 most in demand skills for each one of these roles and gives a percentage based on How likely it is to appear in a job posting now this graph is great but it's a little hard to interpret I'm trying to understand how these skills relate across the different roles and I could
go through one by one and trying to analyze and compare this but that's going to take me quite a bit of time so I just paste this image into chat gbt like I did previously that Panda pick and it gets to town analyzing this in it it identifies four main types of skill first for python it basically identifies that data engineers and data scientists have the s for SQL it says all skills are actually requesting this for cloud platforms once again that goes to that data science and engineering roles and finally it wraps it up
with datavis tools where it says things like Tableau And powerbi are most prominent and data analyst and business analyst and then it finally gives me that summary that I was actually looking for basically data engineers and data scientists are the most similar when it comes to sales and then data analyst and business analysts also follow some similarities as well so this analysis would have normally taken me minutes if not hours to do and now I just got this in a matter of seconds so I'm really blown away by this feature of Chachi BT now there's
also another unique use case of this and that's an interp in graphs you may not understand or be familiar with take this one for example this is a box plot of different data science salaries not everybody's going to be able to read this you yourself may not even be able to read this so you can take it and feed it in and I did in this case prompted it explain this graph to me like I'm 5 years old and it goes into explain it Using a color box related analogy now you could change it up
on what kind of analogy or how you want to explain it to you but I think this is a great use case especially anytime you're going through this course or in real world and you're not sure of how to read a visualization or what to interpret from it you just feed it in and you'll get the insights back from chat gbt and also we're not just limited to interpreting graphs or visualizations we can also use it to Interpret data models so here's a screenshot of a data model inside of powerbi and it shows how all
these different tables are related now let's say I needed to run a SQL query along this database querying across the sales t atory to sales order to date table I could just throw this image into chubbt provided the prompt of I want to analyze the sales order across different sales territories on a monthly basis and it goes to town actually providing me this SQL query with the names of the tables and the columns necessary to get my results that I need this is just mindblowing to me all right so now it's your turn I included
a bunch of images below feel free to to go through and actually upload each one of these images into chat GPT and see what results you get from it in actually analyzing data and even this data models all right that see you in the next one dead nerds welcome to this chapter On the Advanced Data analysis plugin in this we're going to be walking through a typical example of how I use this plugin in my job as a data analyst we're going be walking through exploring a data set on data science job postings to extract
insights from it first we're going to going to start by downloading and importing this data set into it and having chat gbt read it next we'll have it explore it and find some data that probably needs to be cleaned up so we'll Have chat gbt handle this as well from there we'll be diving into performing some basic statistics and also exploratory data analysis to extract out some visualizations to help us learn more about this data set finally we're going to wrap it up with my favorite part of machine learning and we're going to actually be
using the data inside of this data set in order to predict salary because we're going to have salary in this job posting so we'll be able to use The attributes of this data in order to predict that really excited about this portion one quick disclaimer on the knowledge level required for this don't worry too much if you don't know a lot about what Eda is what machine learning is we're going to actually go deeper into this in another chapter but for now I'm going to give you what the basics you need to know in order
to use this plugin for each one of these chapters make sure that you're actually checking Below cuz I'm have a link to the data set I'll also have all the prompts in the description in addition I'll be including a link to my chat gbt history so you can go in and also check out to see how I went about analyzing this data set one note um right now chbt doesn't have the ability to share images so any graphs or images that I generate in these links that I share with you you're not going to be
able to see it but you'll be able to see the prompts and The response from chat tot and I think that's good enough all right that's enough of me talking let's actually dive into this chapter D nerds in this chapter we're going to be going over the Advanced Data analysis plug-in and this plugin is by far one of the most powerful that I've seen within chat GPT and one of its capabilities is that you can upload files to the chatbot in order for it to connect to it analyze it and then Provide insights one minor
little bug that I'm finding though is that because you can upload these files to chat gbt is that the Environ M that it's running the python code and that it's storing these files will sometimes time out and you'll get a warning message saying that the advanced datat analyst beta chat has timed out you may continue the conversation but previous files links and code blocks below may not work as expected and so overall I found that all That you have to do is go back in and whatever file that we were using previously you just put
that file back into the chat and it picks back up where it left off so it recalls everything all the analysis that we did previously so you don't have to worry about that so you will be prompted from time to time especially if you go away from the chat or come back to it at another time to have to re-upload any uh files that we were using I do expect chat gbt to fix This issue especially with the rise and popularity of it um not sure how they're going to do this or when they're going
to do this don't have information on that but hopefully they do in the future and then I can get rid of this video in the chapter and you'll never see it again all right see you in the next one all right in this video we're going to be doing an intro to Advanced Data analysis and before this we're going to be doing a comparison between using chat Gbt without this functionality and chat gbt with this functionality so you really understand how it truly works one note about future videos you may hear me refer to this
as the Advanced Data analysis plug-in and that's because previously for chat gbt updated this was a separate type of feature that you had to actually activate and you could only use this within a chat but now it's pretty great because you get to use Advanced Data analysis also called Analysis here or data analysis within a single chat in addition to things like web browsing and generating images with Dolly so from time to time in upcoming videos you may notice the UI that you're dealing with isn't the same as the UI that I have I've gone
through all the different videos and verify that still the same chat that I input in chat gbt produces the same results so you should be getting the same exact results even if that UI is different all right let's Get into it one recap from the last video is to make sure that you have custom instructions set up for your context or use case right so for me in custom instructions I have that I'm a YouTuber making entertaining videos for those who work with data so that way chat gbt understands what kind of results I want
I I could think of an example for maybe like a business student to have something like I'm a business student specializing Finance I'm interested in finding insights within the financial industry so that would better shape the students abilities to get prompts so just make sure that that's filled in because this is going to be the context that is provided to chat gbt in order to get the best most optimal results we need to have that with these instructions be as specific as you can right now it's about a 1500 character limit so feel free to
go wild and fill it up with as much Details as possible I found that you're only going to get better results with more context so let's get into performing some data analysis and for this we're going to be do a comparison comparing that GPT 4 model currently that has analysis included to GPT 35 without data analysis so starting with gbt 3.5 first so I prompted it with this analytical question 10 downa nerds are on LinkedIn 50% of them are unemployed each applied to approximately two jobs How many jobs were applied to so doing this mental
math in my head we know that 10 jobs probably should be applied to so let's check it out and chat gbt gets it right so you're probably like Luke hey this base model without advanced ad analysis included can do math well not so fast let's actually do a more complex problem in it I'm going to have a similar word example this time I have much bigger and more complex numbers let's see what the results are I don't Know why chat gbt did all these emojis this is getting a little bit crazy I'm hoping it's going
to stop soon what is going on and it stopped okay so it says that based on this 57 million jobs were applied to and you didn't know any better that probably looks correct but let's actually double check it and using the calculator we can see that although chat gbt was close it's actually not correct it's actually off by looks like close to a 100,000 so what happened here Why did chat gbt come up with this value that was actually pretty close to what the value should have been well with chat gbt we're working with a
large language model and really these type of models are great at predicting the next word in a sentence take for example this I have Chach PT fill in the blank for this of Jack and Jill went up the blank you can probably guess what it's going to be if you're from America and you know nursery rhymes it's going to say Hill well they showed an emoji of but let's actually ask the for the word okay uh so we are confirming the word to fill in the blank is Hill similarly this filling in the blank of
the next word in the sentence it can do this with math problems as well look at this one right here of fill in the blank of this next sentence 2 plus blank equals blank in my mind I kind of know what this is going to already do it's going to do 2 + 2 = 4 let's try it out yep and it did 2 + 2 Equal 4 so in this case with this GPT 3.5 model that's what it's doing here it's using it's general knowledge of what it should predict for the best word that
come out next in a sentence and using that to provide us a value in this case which is not very accurate for data analytics so that's why anytime we're doing any type of analysis in here we want to make sure we're using a model that has Advanced Data analysis let's see how to actually make sure that You're using it the first way you need to make sure that you're actually have it enabled is going to the beta features and ensuring that Advanced Data analysis is turned on from there there's multiple different ways you can access
it I can come up here and start a new chat by clicking chat gbt and then from here actually select this model of gp4 right now which has Dolly browsing and Analysis so I can just click it and enable it now they also have this gbt Called Data analysis if you don't have it in your menu you can actually go to explore and actually see it right here and add it anyway this GPT itself only includes that Advanced Data analysis functionality it doesn't include web browsing or Dolly image generation and all that kind of stuff
so I think it's kind of limited I don't actually recommend using this anytime you're using it I recommend going to chat gbt and then using the most advanced model And selecting it with analysis so let's plug in that same exact complex word problem that we had before and see what Chachi BT does so first it goes through and identifies basically all the different variables it needs to use and then it starts actually analyzing it that's when it's when it showed just there is when it's going to be using that Advanced Data analysis functionality now it
tells us that the value is this 57.6 million which According to the calculator is exactly correct so how did it actually get this result well I can click here at the end of this sentence and go to view analysis and it shows me the python code that it's actually executing here and let's walk through this code real quick first it identifies all the different variables we need for this has things like the total data nerds the unemployment rate and then the applications per person underneath it it Starts getting to work calculating the total applications which
is the total data nerds time the employment rate times applications per person to get the final one and we can see the results right down here at the bottom if I wanted to I can even copy the code and put it into my own python environment and execute it but I sort of like this because python is executed right here inside of chat gbt and you get your results and you know it's accurate Because you can see it so what all can be done with this feature of Advanced Data analysis well let's ask it and
it goes into a lot of the things that we're actually going to be covering in this chapter specifically talks about we can do things like data analysis statistical analysis data processing predictive modeling and even going into things like data interpretation and custom queries so a lot of things the core things that I do as a data analyst this Functionality of Chad gbt can also do all right so I'm excited to jump into this to explore more about how we're going to use this in this chapter for you for your task for this I'm going to
have you going through and actually quiz chat gbt on the same prompt asking it what it can do with this feature because in the next video we're going to be diving into importing data I want you to also ask it what type of files can you import into this and use inside of it All right with that I'll see you in the next one in this video we're going to be going over connecting to data sources specifically we're going to go to import a data set that we're going to get from online and then we're
going to do some brief analysis of it so for your homework you should have prompted chbt to find out what type of file types it accepts I did this initially and it only provided three of CSV Excel and Json Which is pretty neat that it does all of these things um but I knew that it could import more so you have to always be very specific and I provided it another prompt to then provide me a more thorough list of the file types and it listed a lot more so just datab bases uh SPSS SAS
files HTML so it takes a lot of different files and this is great for us data analyst so let's get into uploading some data and then analyzing it I think I have the perfect data set for this so If you go to the link below it links you to my kaggle site where I've hosted a data set on data analyst job postings kaggle is a great site in order to get data sets because you can go through and search different ones then also it tells you a description and shows you some overall summary statistics about
the data set itself so it's it's really useful and you can also see some stuff around uh what other people are doing right so we're going to download this Data set and after we do that we're going to find that it downloads it into a zip file zip file just means that it's a file that they compress down and so zip file is fine it's actually better cuz it makes it smaller we're going to upload this file into the Advanced Data analysis plugin so I'm not even going to provide any instructions I'm just going to
press enter and have it upload and see what chbt says Back and it identified that it's a zip file as it should and it extracted the contents of that in it it found that we have a CSV or basically like a text file where everything's separated by commas and so now it's asking what we want to do next for data analysis and I want to find out more about this data set specifically I just want to find out what are The Columns of the data set maybe a description of each one of these columns and
so because we've Already provided that context via our custom instructions I then provided the task of tell me more about this data set for each column give a brief description so now it's providing each of these columns along with a brief detail and as I mentioned before this is job postings and so it has a lot of key information from that job posting such as just the company name the location description or job description and then most notably things like salary where we Have like hourly Sly yearly they also have min max average and we'll
get into all that in a little bit so your task now is to go to kaggle download that data set and then upload it into the Advanced Data analysis plugin from there ask it about the columns in the data set and we're going to be jumping into some descriptive statistics next so feel free to also jump into that and start looking around at different statistics of the columns all right see you the next one In this video we're going to be exploring that data set that you should have downloaded from kaggle and then uploaded into
chat gbt via the Advanced Data analysis plugin for this analysis we're going to be doing some uh analysis with descriptive statistics and then also with exploratory data analysis so I'm just going to start with a simple prompt of perform descriptive statistics on each column so in my case it initially tried to Provide some of these descriptive statistics and what I mean by that is things like the count how many rows it has the mean or average standard deviation what's the minimum value what's the maximum value that's for numerical columns for categorical columns such as like
the job title it has things like how many values are unique so there's 11,000 different unique ones with a top result of data analyst um as we'd expect from this data Now it's only able to do a little bit and so I prompted it further to do the entire data set and it says it needs to do smaller parts for easier viewing and so I'm actually going to refine this prompt further to get the data better how I want because right now it's providing it in a bullet format I don't really like that I think
it'd be better to have a table format so I prompt it to still perform descriptive statistics on each column but also for this group Numeric and non-numeric columns such as those categorical columns into different tables with each column as a row this hack to get these values in a table value makes it to where you can actually see and better understand these results and it was it's something that I was expect to get as a data analyst so for these numerical columns we have quite a few we can see it is has a lot of
data around the salary average men Max hourly L early we'll dive in that Further but I want to call out this first if you're not familiar with python is is that the first one called unnamed zero whenever there's not a column title python will give it this name of unnamed zero so that's basically like the index we already have an index in it both those columns aren't really useful for us in our case for the non-numerical columns it looks like it went into a lot of the different ones that I really care about title company
name uh the job Platform and description but it didn't do all of them so I'm actually going to prompt it to go further in those all right so now I can can go through and actually see each one of these non-numerical columns get a better idea of how many counts they have if they have any missing values such as the salary column it looks like only about 5,000 values are there while there are a total of around 29.5 th000 job postings so that's just something to note with This data set um we can see all
these different top things and frequency so this is some really good descriptive statistics that's provided in a very convenient way to see it after descriptive statistics the next thing that I'd like to get into is exploratory data analysis an exploratory data analysis is a way to visualize a lot of these descriptive statistics in a way that I can actually see visually via graphs such as histograms or bar charts So I'm going to prompt chat gbt to perform some of this Eda and I provide it with perform exploratory data analysis on each of these columns provide
an appropriate visualization to represent the content of each column for example use a histogram for numerical columns and the results from this are really interesting because now we get a dive and see like what's in this data set itself the first one that gives us is the title so what is the job title Itself that's being presented in this job posting and for data analysts in the United States we expect to see data analyst number one but also maybe some data scientists um and it looks like data Engineers even following this as well um other
things have like company upwork look like they're going crazy with job postings job locations anywhere looks to be like a very common one along with United States um also looks like we probably will need to do some data Cleaning for this location and then the Via which is like the job platform has things like oh it looks like LinkedIn is like the major provider of job postings for this data set then we have upwork and BB um and then it asks us to dive deep deeper into more columns all right so now it's time for
your task you're going to go in and similar to me you can perform those descriptive statistics I recommend having it output in that table likee Format and then move it into exploratory data analysis it's probably going to do the same where it only provides you a few charts at a time but keep iterating through to get more familiar with this data set and understand what we're working with in the next video we're going to get into cleaning up these values before we get into further visualizing all right see you in the next one in this
video we're going to be Going over data cleanup so previously you should have done the descriptive statistics to find out more about the data set itself and then jumped into an exploratory data analysis of each one of those columns to understand what's actually in this data set and with that in mind of going through it we wanted to find what type of columns we need to focus on for the data cleanup right now there's two main ones that came to mind that we identified in the last video That we're going to clean up in this
video the first first is job location and this one has a space randomly in it looks like sometimes like after United States there's multiple spaces and then for like anywhere there's just like one space so what we're going to have chachu PT do is go in and remove these spaces so I prompted for the location column it appears that some values have unnecessary spaces we need to remove these spaces to better categorize this Data nice nice and so it went through and re and it actually did it on its own it generated this new updated
bar graph showing these locations once it cleaned it out and now we don't have any duplicated anywhere or United States it's pretty awesome the next column I want to clean up is the Via colum which technically is the job platform column and you can see from these values that it's like via LinkedIn via upwork it's sort of unnecessary to have that so I Wanted to remove that via space at the beginning and rename that column so I prompted with let's clean up this column by removing the Via and rename the column to job platform and
once again did it flawlessly so now we have all of these cleaned up data that we need we're now going to move into visualizing this data your task is to clean these things up specifically focusing on those job platforms and also while in that Location if you found any other ones to clean up feel free to jump into those as well all right see you next next one in this video we're going to be looking at doing more complex visualizations specifically looking at that salary column and analyzing it how it relates to other columns in
the data set previously we had gone through and cleaned up both the job location and job platforms columns we're going to be integrating this with the salary data so We need to make sure that was cleaned up so let's look at the salary data going back to those descriptive statistics that were provided we can see we have have about six columns for salary in it we have things like salary average which provides the average salary salary men which is like the minimum value of a job posting sometimes it has a range salary Max which is
the higher end of the range hourly and yearly and that is whether it's an hourly rate or a yearly rate we Put them into separate columns and then the standardized is a combination of correcting the hourly Sal rate to the yearly don't worry about too much if don't understand what's going on with the standardize we're going to be focusing on that salary yearly column one thing to note is there is a column in there on salary rate whether it's hourly yearly and then we even have a few values on monthly pay but like I said
we're going to focus on the yearly Salary for this just to show it visually to better understand that salary yearly column has this is the histogram for it and we can see that it's distributed between around 50,000 to 150,000 which what what we expect for a data analyst salary as far as the hourly rate we're seeing it all the way from a low maybe around $10 up to around $100 for its distribution that standardized salary column then combines those values From the all hour salary with the annual correcting it to a yearly rate based on
how many hours are in a year and so we get this distribution which is actually very similar to our other Distribution on the yearly salary just more values but don't worry if you don't understand that standardized salary we're going to be just focusing on the yearly salary for now specifically we're going to be looking at plotting the top 10 job platforms based on average yearly salary And that's why we need to make sure that this column was clean so this is where you have to be very careful what you tell jbt and based on what
I said it plotted correct thing that it should have right it has the top 10 job platforms but this is based on the top 10 average yearly salary and really I was looking for the 10 most common job platforms what are the average salaries for those not necessarily what are just the highest Because some of these aren't going to have a lot of values in it and I know this because when we go back to the top Town job platforms that I did with the Eda I can see that LinkedIn upwork and BB the top
three yeah whenever I scroll down here there not even in here so that's why I knew it plotted it not really how I wanted it so I'm going to update my prompt to say plot the top 10 most common job platforms that include yearly salary data plot this as a bar Graph for the average salary and with this one I'm being very specific about that I want the top 10 most common job platforms and we get this visualization which then shows us the salaries for these top 10 platforms now you may look at it and
find that okay we had LinkedIn but what about upwork and BB both of those are more of freelance website so expect hourly rates to be on there I'm also assuming that BB is a freelance site because it's not on Here probably need to Google that but we do see LinkedIn on here right and so that has I as I would expect some sort of yearly salary and we can see it ranks in the middle and it looks like this AI jobs.net has a lot higher so AI jobs paying the bills a little bit more all
right it's your turn now to perform the same analysis on these job platforms I don't want you to stop there though want you to also go in to visualize this for both the job titles and the job Locations and I want the similar results of the top 10 job titles and top 10 most common job locations all right see you in the next one all right in this video we're going to get into predicting data specifically around that salary column let's recap real quick about those visualizations that you should have built first you should have
done an analysis for the top 10 most common job titles and in this we can see that lead data analysts and data scientists have Some of the highest salaries along with senior data analysts which I expect and D data analyst looks like it's at the lowest point of the list because most of these are senior positions so this is like making sense now as far as the top 10 locations they have at United States and anywhere looking like the highest and then it looks like we have for the top 10 locations we have a lot
of stuff from Kansas Oklahoma and Missouri once again this data sets on the United States only so this is I expect this but since these are the most common locations it doesn't include things like New York and California which it does note down here that they have higher salaries in these locations so it's good that it has these kind of notes to to let you know of this I could this take this visualization a step further and start exploring what are the highest based on not caring about the top 10 most common locations but we'll
do that In another time one quick note is I did take a break during this and if you find that you're going through and it has a problem compiling what your request is so I initially tried to prompt it to provide me with those visualizations for the top 10 job titles and it got caught up and I had to reload the data I reloaded the data and it got right back into the task of plotting the job titles along with the location which had the cleaned up location so it kept track of The previous work
that we did so if we count we have three different visualizations showing how salary could fall one is on the job platforms the second is on the job title and the third is on the location well this isn't really convenient if we want to have multiple conditions say we wanted to provide location and job title we can't really do that or see anything extracted from the visualizations but this is where predicting data or machine Learning comes in specifically we could use some sort of machine learning model in order to predict what the salary would be
based on all this data and be able to put it into chat GPT and get it so let's actually build something for this so I'm going to prompt jat GPT to build a machine learning model to predict yearly salary use job title job platform and location as inputs into this model and I have at the end to suggest what models do you suggest using For this so which suggests three models random Forest gradient boosting and linear aggression I'm comfortable with using any one of these but I'm actually curious which one chat gbt recommends based on
its knowledge of the data set so I prompt it which one do you recommend for this data and it's suggesting random forest and makes a lot of good points about it's good for both numerical and categorical values which we have a lot of categorical values in This and it's less sensitive to outliers and with the salary we're going to see some outliers such as having you know a high salary like $900,000 so I think this is a great model to go with we're going to proceed forward with this all right so the model is built
and it's providing some statistics around the errors um specifically I like looking at things like the root mean square error and it says it's around 22,000 if you're unfamiliar with stuff Like this one we're going to go into it in a little bit more detail in a follow on chapter but you can just ask chbt this so I asked it how would you judge these errors and it provides a description specifically for rmse that this means the models predictions are on average off for about 22,000 from the actual yearly salary so there's like a 22,000
amount swing that it possibly could have so this is really good to know from our site of how accurate this Model is now we could go forward with the fine-tuning the model but I want to actually just go into actually testing it so let's actually use chat gbt to run this model so let's actually run this model within chat GPT and I ask it how and it says hey just provide me with the location title and platform so that's what I did we're going to start first with data analyst in the United States for LinkedIn
job postings to see what we Would expect for the salary and it looks like the predicted yearly salary is around $94,000 which isn't too bad because if we go to to something like glass store which is a website that Aggregates salaries we can see that the expected annual salary is around $80,000 so this $94,000 that it's providing is actually within that 22,000 that it provided for that rmse so that's pretty cool now I want to see how it Actually trends for more senior roles remember from our previous visualization we would expect data analyst would be
at the lower end and Senior data analyst would be around the higher end of the pay so providing it updated details for still in the United States in LinkedIn but for a senior data analyst it predicts that the salary is around $117,000 Which is higher which is pretty awesome and then when we go to glass door for senior data analyst we're Seeing that the salaries correlate a lot closer in this case they're saying it should be around 121,000 which is really close to 117,000 that we got here with our model and this is all pretty
amazing I don't know if you're familiar with machine learning but you just used it in order to predict salary also you were able to use things like rmse to verify how accurate these models are what we're finding from this is that the data analyst prediction is Not as accurate as things like the senior data analyst based on the number of roles that the data analyst has and how it's significantly more than the others I think we have problems with how these jobs are classified and a lot of these data analyst positions that are just classified
or data analyst are probably also including senior roles as well so it's skewing them up um we could build the model out further in order to correct for this but I think this is Good for now all right it's your turn to now give it a try I want you to go in and promp chat GPT in order to build a model similar to this you can use these three attributes that I used of location job tile platform or feel free to use your own once this model's built then go test it out actually give
it those inputs that you specified and then go to sites like glass door and see if you can verify how accurate your model is compared to that one all right so that's The major steps that we're taking for this chapter after you do this I'd be pretty proud of yourself we went through a complete data analytics pipeline all the way from collecting data performing Eda cleaning it up analyzing it and then building a model to help predict some data this is all a lot of work and we did this with not a single line of
code so it's pretty awesome all right with that I'll see you in the next one all right in this video we're going To be talking about three major limitations of chat gbt but these three things range around connecting to the internet data limitations as far as how much data we can import into chat gbt and then also security concerns the first limitation is internet access and for security reasons they don't allow Advanced Data analysis to connect to any online sour sources that have data specifically for me I'm usually connecting to things like databases that Are
in the cloud apis that stream data or even to just online data sources on like Google Sheets and these three examples it can't connect to any of these if I wanted to use any one of these locations I would have to download that data and then import it to chat GPT and this actually brings us to our second limitation so say I have something like data in a database and I've downloaded to a CSV file which I have right here depending on the size of That data it may not fit into chat gbt I try
to upload the file and I get this message saying the file's too large maximum file size is 512 megabytes and that was around 250,000 rows of data now one trick you can take with this if you're really close to that 512 megabytes is to compress it into a zip file in my case I got to 545 so it just missed it so I'm not able to actually use this and actually upload it the other option is taking your data and Splitting it up even even smaller files because although you have this file size limit of
512 megabytes you actually have a total data set size of 2 GB so if you break it up in our case into five separate csvs I can then import them in for both of these limitations of internet access and file siiz limit Li itations I have a workaround for it in a future chapter where we're going to be talking about the notable plugin and this is super powerful at connecting to Online data and also uploading or connecting to large data sets so we have a work for this but I wanted to make it apparent about
this Advanced Data analysis plug-in the limitations with that and the final thing to note is on data security so we talked about previously within chat gbt how you could turn off chat history so your data is not used to train chat gbt models so I think that's a good way of protecting yourself if you're unsure whether data Can go into chat gbt that nerds awesome job on wrapping up this chapter on the Advanced Data analysis plugin I think you should be super proud of yourself especially with the project that we just accomplished you could basically
turn what the work we just did in into a portfolio project and present it to an employer as work an evidence that you have experience to use this tool in your job so I think you should be super excited about that now now I use all These tricks on a very routine basis especially when I have co-workers or friends give me data that they want me to explore quickly in the past usually something like this would have taken me all day to do now you've seen that we did this in a matter of minutes of
jumping in diving into the data set getting visualizations and also predicting it so I think this is such a powerful tool to implement in your workflow and I just wanted to stress That this is mainly used by me for that ad hoc analysis so quick insights if I need to do ongoing analysis or deeper analysis I'm going to be using different plugins within chat gbt and still being able to capture a lot of the value out of chat gbt but it's going to provide Extra Value using these plugins that we're going to use such as
like the notable plug-in that allows us to connect even larger data sets and also provide an Environment to actually store all of our different analysis and results to then share with others so that's going to be in a coming up chapter all right enough of me yapping let's get into the next chapter D nerds editor Luke here want you remind you it's not too late to support the course getting all those different course notes along with a certificate of completion you can support it by checking out this link right here all right let's get back
to The content that nerds in this video we're going to be covering what we're going to be covering basically in the next few videos in this chapter specifically this chapter's going to be broken into three major parts the first section is going to be focusing on visualizations what visualizations I typically use and how to use them with chat gbt the next is going to be into what are some common statistics that I look at using along with implementing Different visualizations with it and then finally we're going to wrap this chapter up diving into the four
core types of data analytics and using these types of analytics to solve a bunch of different use cases within chat gbt now for all of this we're going to be using the same data set that we used in the previous chapter on that data analyst job postings this chapter is primarily aimed at those that are new to data analytics and don't have much experience Or haven't worked with common terms like statistics or even building visualizations so if you went through that intro to Advanced Data analysis uh chapter and you felt like you were pretty comfortable
with all those different terms feel free to skip this chapter and move on to the next one but for those that weren't as confident with all the terms that I was using in it this chapter is for you we're going to be diving deeper into all those Different terms so way you feel more confident in actually using chat GPT for data analytics in the first few videos we're going to be breaking down the most common visualizations that I use as a data analyst we're going to be not only breaking down how to read them but
also how to use them in different use cases while analyzing that data analyst job posting data set these videos I feel are going to be great at helping understand what visualizations you should be using When you're jumping into something like exploratory data analysis and you're not sure what type of visualizations you should use the second section of this chapter will be heavily focused on statistics don't worry it's not going to get too complex we're going to be focusing corly on the basics focusing on things like average median different percentiles really diving into what those different
ter terms mean and then from there actually diving into the data Set and applying what we're learned to explore more further about the salary data we'll also be diving into statistics on non-numerical data or categorical data looking at things like count unique values frequency along with different visualizations that I use for this type of Statistics finally the last section of this chapter will be focusing on the four different types of data analy Antics and this really dives into defining a problem statement that we Want to solve and where it fits into the different forms of
data analytics we're not only be covering what these different forms cover but also using our data set to dive in further and actually apply these in different use cases starting simply with just diving into some Trends analyzing how salary has trended over the past year and then finally get into the case where we build a recommender algorithm to provide chat gbt a list of skills and then it provide Us a recommendation of what jobs we should take to maximize salary and with that let's actually dive into the next video where we're going to be going
over visualizations see you in that one thata nerds in this video and also a couple of the follow along videos we're going to be going into some of the most common visualizations that I use as a data analyst we're not going to going to be just listing what are the top visualizations we're going to be taking It a step further we're going to look at scenarios on when you actually need to apply each one of these different visualizations how you need to format them so they're most readable to your stakeholders and also we're going to
be going into how you actually should be reading them yourselves in analyzing this data all right so let's jump in so these are the six most common visualizations that I find myself using daytoday bar charts and line charts are Probably compies almost 80% of all the visualizations I ever make and don't underestimate the power of these as they're highly readable by those that may not be data nerds so that's why I find myself using them quite often and I think you should as well but we're also going be going to others as well so stand
by on that so the first thing we need to understand is what visualizations are actually available so remember python is on the back end of This Advanced Data analys this plugin that we're in and any other plugin that we're going to use is going to be primarily based on python within python they have libraries so people have built custom libraries such as matplot lib or Seaborn that generate visualizations in an easy matter using python code the other two listed here of pandas plotting and plotly aren't used as much so we're not going to go into
those if you're curious to see what are additional Visualizations you can get out of these different libraries you can actually just go to them online so mat plot lib in this place has all the different ones here shown and there's really a plethora now matplot lib I actually find I use a little bit less and I actually use Seaborn more not to get too much into it but Seaborn is actually built on top of matplot lib um it'sing confusing as that may be and I feel that the visualizations are a lot simpler and Move a
lot of clutter so it makes it a lot more readable I really enjoy the coloring scheme along with how they lay out the different things this visualization right here is pretty complex so don't get detracted by it I just think it gives a good example of the capabilities of this specific Library so we're going to be primarily using this um for the visualization we'll be generating throughout this now because I prioritize that Seaborn over Mat plot live for all the visualizations we're going to be generating here I update my custom instruction for this I also
update it to have a dark theme and to format color colors in a certain way and in a follow on video I'll be going into all the technical details of what I have here but I have my custom instructions included below and I would like you to what we're going to do in the task is actually have you update those custom instructions for this Because that's what all my visualizations are based off of and like I said I'll go into it in a little bit with these custom instructions it helps format it in a more
readable manner so as you can see on the left that's the before picture using a analysis of the top 20 skills as you can see there's no sorting the color all random it's a hot mess but what I have on the right is I feel a lot more readable it actually organizes it from high to low colors it In a matter to draw your attention to the top skill and also removes some of the unnecessary formatting so that's what we're really doing with these custom instructions so let's actually go over some common visualizations starting with
a bar chart first if you don't have it already make sure you go and redownload that data set we were using in that last chapter of the data analyst job postings we're going to be using that again from there I'm going to throw That into the notebook that I'm in and we're going to get into the analysis of this so I provide the prompt of make a bar chart of the top 10 skills this is in the description tokens column it's in the form of a list for each row each list has a number of
skills um this last portion these last two senten are just used to speed up uh the processing chbt could figure it out but I like to work faster with it anyway we get this visualization showing the bar chart and It shows the frequency of the top 10 skills ordered high to low and we can see in it that SQL is the highest followed by Excel and python now bar charts are really good at comparing different groups in this case the different groups are the different skills and you can apply this grouping to different types of
data and our eyes in general are really good at comparing different sizes of lines and in this case we can see like a relative value Between SQL all the way to that last scale of word and have a better understanding of how to interpret this and the how much important more important SQL is right in this case over something like word so I'm a big fan of bar charts for this the other thing bar charts are pretty good at is displaying or showing values how they Trend over time now in this case I had it
go through and analyze a squl being that top skill how did it Trend over time Month to month and we can see from this not too bad of a visualization but I'm more of a fan of actually using line charts for this so let's actually try this out so here's that same graph converted into a line chart and I like line charts because intuitively I'm think thinking of connecting the dots between each of the different points whereas compared to that bar chart above you have to really take the time to try to interpret it of
oh it's a month year And you need to connect the dots of it whereas quite literally the dots are connected in this case for a line chart so time series analysis I'm really a fan of of using line charts for this so beyond bar charts and line charts the next type of visualization that you're going to see a lot of people using is pie charts I'm not necessarily a fan of them unless they're used in a unique case so in this visualization that I've generated it showing the likelihood of a Job posting being marked as
work from home and in this case 44% of them are marked true that they can be um they're applicable being worked from home now if you're ever comparing two groups like a true or false or maybe even three groups like true false null or maybe even you know ABC I think it'd be fine to use a pie chart but whenever you get beyond that I would not recommend using them when you get more than those values I'd recommend going back to something like a Bar chart that's going to be much better at like I said
before you can actually visually compare the size of These Bars and have a better comparison than a pie chart the last main visualization we're going to cover in this chapter is on Scatter Plots and Scatter Plots are also a little bit less frequent than I find my myself using they're going to be used in cases where you want to be able to compare two numerical attributes so in this case I'm showing a comparison of Years of experience verse salary and as I expect to see out of something like this as your number of years of
experience goes up you would expect salary to rise so we have this positive correlation that's going on between it it's hard sometimes in data set to ever find two different numerical values that you think you're going to be related like this so you're not always going to be able to find these types of uh these types of Trends so I don't find it as Much of a used visualization but I do think you need to keep it in your pocket all right so we just went through four of the six most common visualizations that I
find myself using day-to-day in my job now it's your task first I want you to update your custom instructions for the ones that I have listed I have it set to dark mode so feel free to delete the line that I have included below if you want to make it into regular light mode but I really like Dark mode after doing this I want you to test out building three different visualizations with these custom instructions now want you to focus on a bar chart a line chart and then also a pie chart for all of
these I'd like to have a problem statement in mind so for the bar chart let's look at what are the top locations in the data set let's plot that for maybe the top 10 values for the line chart I'd like to compare the actual search term and C which is data Analyst we use the data analyst Search terms search those job postings and I want you to see how it Trends over time using this datetime column and we're going to be making a line chart out of this one and then finally for the pie chart
itself we're going to use the salary rate column and it only has three values vales of hourly yearly and monthly on how that rate of the salary is so I think that'd be a good thing to actually use and try out for this by Chart all right I'll see you in the next one all right in this video we're going to be continuing our discussion on visualizations specifically focusing on statistical visualizations and it's going to be using the histogram and box plots for this previously we covered the other four and we're going to recap them
real quick on what you should have done for your tasks so for the task I had provided it with the following prompt make the following visualization using a Bar chart plot the top 10 locations using a line chart plot the search term verse date time and then make a pie chart out of that salary rate column um it provided it all on one plot here which is fine but let's actually dive into each one of these real quick so for the bar chart I actually had to have it clean up more because it had forgotten
that those locations had those spaces in it so the before that it gave me the first time is on the left- hand side so I had it just to prompt it further to remove those spaces that were in those attributes of that location and then we get something on the right which shows that anywhere is the most popular Follow by United States and then it looks like a distribution of jobs from the Midwest next is that line chart looking at search term over time and this basically going to show us how many job postings we
were getting back during a certain time period so initially I was having it Plot it daily because that's what the values are and you can see it's very sporadic so I actually took it a step further and I had it Go and break it down by month and we can see much clearly that we have a peak here at the beginning of the year in January and then it sort of subsides but then it's going back up in August September it's October right now of 2023 so those values aren't all the way full end so
that's why it goes down and the last Thing you should have erated was that pie chart and in it we can see that the the distribution or the representation of salaries that we have a lot more hourly salaries almost 2third of these job postings have that over a yearly or annually salary uh looks like 2% are on a monthly so we're not even going to care for any of this analysis about that we're going to probably be focusing mostly on the yearly and hourly for this now one of the task that you should have Done
is actually update the Customs instructions this is just a reminder but you should have put in there um The Prompt that I included in the last video of when generating a visualization prioritize the following all these different things if you don't want to use that dark background just delete this line right here and it will generate with a white graph but you'll look cool if you use a dark background all right so let's actually get into Those two major types of statistical plots that we're going to be using and going over for this and that
is going to be histograms and box plots let's start with the his histogram first visualizing what the salary is as a histogram and we're specifically we're going to use the data from this since it looks like 2/3 of the salary data is based on hourly data let's make a histogram for this so we have this visualization now and I prompted it make a histogram using The salary hourly data that's like a tongue twister to say and in it a histogram is showing the distribution of the data over a specific range so so in this case
on the x axis we have the hourly salary data and it's going from zero all the way up to $300 and in it we have on the y-axis the frequency so we can see that hey around this it looks like around 20ish we have some of the highest frequency approaching nearly 1,200 values and it Seems to go down from there now each one of these values so I'm counting these different uh bars right here 1 two 3 four five 6 seven eight nine those are the different bins and we can actually adjust the bins to
show more detail inside of it so based on how this is distributed let's break it down even further so I prompted it with this of break this down into more bins because bins are how much uh values are included within this and so now we can actually Get a better representation to see okay there looks like there's a peak around $25 and then it looks like there's also a second Peak after that $50 around maybe $60 and so this would be something as a de analyst we're not going to go into it here but I
would want to dive into it further to find out why do we have these two different Peaks going on here normally I would expect it to have more of a a normal bell curve so there's something going on in here in the data Now I had to take it a little bit further so we dive deeper into the statistics of this visualization so on the outline of it I have this blue line that sort of outlines where the data is going this red line is represen totic of the mean itself and right here it's showing
it to around like $45 for the mean and on the outside of that is on green lines are showing one standard deviation so let's jump into that real quick so here I had chbt generate a Visualization showing normal distribution it just shows an outline of a histogram which is the blue the red being the mean or average and then the green being one standard deviation so this standard deviation or this value outside of the mean is actually pretty helpful at sort of generalizing the data as 68% of the data in a normal distribution should fall
within this so if we go back to our salary data this isn't going to Be the same because this isn't a normal distribution so it's going to be in this case we find out that about 74% of the data Falls within um the standard deviation of the mean so in this case it's pretty good to see like hey a majority of the data almost 34 of the data is within this value here this is also another way of showing it just to be able to see what I mean by these percentages as I feel like
this is doing a little bit better than what Chachi we Can do in the moment and it shows what we would expect of where the data to fall and so if curves are starting to look outside of this I'm going to start questioning them more especially in our case since we're seeing those two big humps I'd want to dive into it more so let's actually dive into it more and we're going to be using a box plot for this so here we have a box plot above the histogram so I gave it the prompt of
plot salary hourly as a box plot and Then plot it above the histogram with a similar x-axis and you're going to see why box plots and histograms are so similar so for the box plot also known as a box and whiskers plot in it we're going to have the box itself in the middle right here this line going on the middle that is the median and that is what is at the 50 percentile and then on each side of it we're going to actually see each of the different quart tiles so to the left of
that median is the 25% to 50th percentile and then to the right of it the 50th to 75% uh percentile now for each one of those whiskers they extend to those outer quartiles of that first quartile and that fourth quartile so if you're looking at this you can see that the data itself is skewed to the right hand side and we as we expect right we're having that median around 4540 and we're having some high values Even out to 300 so it's skewed to the right so I love box plots cuz they're really quick at
showing me what these distributions are where about 50% of the data Falls in this case that inner box right there and then those whiskers showing where the outer quartiles fall now we also have these dots right here and those are outliers those are definitely things I would want to look into and they're not very represen istic right I wouldn't expect you to be able To get 200 or $250 or $300 working as a data analyst hourly so those are outliers I want to investigate that but when do we actually use the box plots and that's
actually for comparisons so I gave chat gbt The Prompt make a box plot comparing the salary hourly data the following titles data analyst business data analyst and Senior data analyst in this we can clearly see that there's a breakdown and difference between especially when Comparing the data analyst to the senior data analyst data analyst has yes it has a wider range so looking at those quartiles um you can see that the first what Falls between the first and third quartiles a lot bigger compared to that senior data analyst and I expect this because generally they're
probably going to throw data analyst on a lot different type of roles and Senior data analyst is probably going to be more limited roles and knowing that it's more senior and The other thing to draw out of this is where those median values are so from this we can see that data analysts have some of the lowest medians or expected salaries and then from there it looks like it goes business data analyst and Senior data analyst with senior data analyst being higher and these are the three of the most common job titles and we can
clearly see there's a difference in the salary itself and so we can dive into it further if we wanted to but Going back up to that histogram where we saw we had two different peaks in it this could be attributed to at that lower Peak a lot of those data analyst job roles are there and then the second Peak that would probably be all those senior data analysts and business data analysts so boxplots are a great way of diving in and quickly seeing distributions as it'd be harder to see this using histograms all on one
graph now this provides us in a way that I can Go in and see these distributions and find out why something is happening within a visualization all right so your task for this is going to be very similar to what I did here except instead of using that hourly salary data you're going to dive in and dive into that yearly salary data and for this I want you to first start with plotting a histogram and looking at and analyzing that distribution and then next diving into actually analyzing box plots for The different job titles all
right see you in the next one in this video we're going to be wrapping up this mini section in this chapter on visualizations specifically we're going to be focusing on the those best practices and looking at those custom instructions I provideed you and why I feel they're so important to have in order to generate the best at visualizations first though a quick recap of what you should have done last Time I asked you to generate a histogram and also a box plot using that salary yearly data now provided the prompt of make a histogram using
the salary yearly data and it gives me this now you should have noticed something immediately with this in the we have a lot of values popping up around 96,000 this is nothing we want to get close as possible to a normal distribution and this is not there so there's obviously something with the data going on here causing Almost 500 occurrences of this very specific value one quick note technically the salary data is not a normal distribution as shown by this red curve right here normal distributions are equal on both sides the salary data however is
going to be looking more like a log normal distribution to where it goes up and then it skews to the right and we're going to expect this with salary data because it's going to start at $0 and then it can go up to anything Up to a million dollar but the majority of it is probably going to be closer to around 100,000 so I gave chat PD The Prompt of perform a group by to aggregate by the title and the salary yearly and also company and it looks like this role right here up appears at
that same value that we're seeing a high number at of 257 times and I actually prompted it further to make it into a table and then realized I needed to actually get it into to show the company Name as well and this is actually showing that Cox Communications the company has a lot of values almost in this case telling it up around 350 values at that $96,000 so that's what's causing that Peak going on in this histogram and so that's why I love these type of visualizations because now I can find this issue in the
data set and basically Cox Communication is just spamming job postings with all these values so Because that's not really represen distic of what I would expect a normal salary to look like I actually prompted chat gbt hey replot this histogram using this data but this time remove duplicate values based on that job title and company name and now we get this value which is not necessarily a normal distribution it is still skewed right as we'd expect but there's definitely a more expected Outlook of how I would expect to see these values so this is Really
good and now let's take it further with that box plot I had it go through and then make a box plot comparing the salary yearly of those three job titles and in it we can see that similar to last time data analyst have some of the lowest and Senior data analyst have some of the higher we can also see those distributions within it and I think there's a lot of good insights out of this as far as what I would expect from a data analyst salary Which looks like it's around 880,000 which sounds about right
and then Senior data analyst would be over 100,000 so yeah that's uh two great cases on how to use this so this is a tableau dashboard from andyc ball and it's on visual vocabulary and anytime I'm really stuck on what type of visualization to use I like to go to this and this is really good at trying to find out what I need to do so say I wanted to rank something I could go here and click this Rankings from there it's going to navigate me to this page it's going to show a few different
visualizations that I use obviously bar chart I'm preferential towards but also you could use something like uh this lollipop chart slope chart or dot strip plot and this is pretty great at guiding you visually into understanding what type of visualizations you should be using now obviously this is a course on chat GPT so chat GPT is also a great resource for This so I could prompt chat GPT with something like what type of graphs are best for rankings and it'll provide me initially a list but like again I'm a visual person so I prompted it
further provide an example of a few of these and I could actually visually now see with some fake data what are different ways to visualize rankings so I would use a combination of the two so let's actually walk through applying this best practice and we're going to do this by removing My custom instructions that I have here for this and start with a new chat window and we're going to go through and apply all these different steps that I'm going to go through so I'm going to start a new chat and now my custom instructions
that are not included and then I'm also going to throw in the data set as well and for the exercise we're going to go back to our original prompt of make a bar chart of the top 10 skills and I feel a bar chart still in this Case is the appropriate visualization so that's that first step and we're going to be providing it all the additional instruction of using the description tokens column in order to generate this visualization so Chad gbt plotted this so this initial visualization isn't bad I really like one how it orders
it from high to low and then also how it makes it into a horizontal bar graph so I I'm I'm more inclined to look up at the top and then read down because that's Naturally how especially in America and with the English system I'm reading from top to bottom right to left so I really like how this is being displayed so far but it needs some improvements and this moving into our second step of removing clutter if I look at it they have a lot of things in here that may not be necessary so specifically
this Grid in the background I don't really find that very useful how the sty is going on I'm not a fan of and that's why I talked About in a couple videos I'm going to be using Seaborn instead of matte plot lib so let's have it change it so I prompted it plot this in Seaborn verse matte plot lip and I'm already liking this even better because it's having those grid marks only go up and down in a vertical Direction and really like we had previously it had a horizontal as well and that wasn't really
necessary so you want to remove as much clutter as possible the other clut I'm going to Remove is going to be one that y AIS label of skills isn't really necessary we already have a a title on top of this graph so that isn't really necessary also with our tick marks and how it's showing the frequency going into detail with these numerical values on the end of the bar graph isn't really necessary so I prompted it to remove both those things and it's showing it even more of a way that I would want to see
it so now we want to move into focusing the the Attention in general I feel most viewers are going to be attracted to that top sequel because it is longest of the bar graphs there but I still think it could be better because visually the colors are very distracting yes it looks pretty but it isn't really conveying the point your eyes are more likely in this case on this white background to go to a brighter color and in this case yellow so I'm getting conflicted and getting Drawn between the sequel and then also the snowflake
so for this I have it plot using uh Blue's R which is like the color theme within Seaborn and the r at the end of this Blue's R just means that it's in Reverse I like what how the ordering it does it if you just do the normal Blues it plots it like this once again I don't feel like this is getting us to draw us attenion up to that sequel so I didn't like that so with that Blues are I feel like it does it a lot better Now blue I just do blue because
I like the color blue and I feel it's also good for people that may be visually impaired and have maybe color blind issues so if you have't choose another color make sure you take that into awareness of what color you select based on that so the last thing we need to move into is using words to actually convey what we're trying to get across in this visualization so for me I'm trying to convey what is the top skill that Somebody should focus on if they're trying to become a data analyst and I think the first
thing I notice is frequency down at the bottom yes I can see that SQL is higher than Tableau or powerbi but like relatively what is going on here like what is the percentage wise and these are in job postings so I had chat gbt update this visualization to show the percentage instead of frequency so in this case SQL is in greater than 60% of job postings whereas tableau is in around 35% of job postings and I think this is much better for the viewer of this instead so that way they can see a likelihood in
a percentage Vice frequency the last thing with using words is I don't really like this title likelihoods of skills appearing in job postings it's like what what what is the point I'm trying to make here so I actually had it update this title here and to get it to what is the top skill In data analyst job postings and a immediately with this caption I'm drawn to figure out in this graph what is the top skill and I can clearly see based on how we oriented with the color with the graph on the Y AIS
or the x-axis showing likelihood SQL is the top skill followed by Excel Python powerbi and Tableau so I feel like this one is much better at showing this all right so that's my four major steps that I take for building a visualization first thing is selecting The correct visualization next thing is removing that clutter any unnecessary items in it three is focusing that attention using the specific colors and then finally using the appropriate words and language in it to draw the viewers attention in to where you want to see um you'll notice here I don't
have this side this is in the White theme I usually typically use the Dark theme and I'll be using it Forward on from here um but I feel like it's still conveys the Point you can use either um but I just want to bring it up here that I don't really have a preference of it I just prefer Dark theme all right so your task will be to do exactly what I did here and I want you to go in remove that prompt that I gave you for those custom visualizations that way you can actually
get the feel of what needs to be done to generate something like this and go through and see if you can actually get to that visualization that I have here Now one other resource that I'm going to recommend is this YouTube video that I made a year ago on the book that I think every data analyst should read and it's called storytelling with data but didn't I basically highlight the different tactics that I talked about here and go into more detail of how you should be using these to build visualizations so check that video out
all right with that I'll see you in the next One all right so in this video we're going to be covering basic statistics and specifically I'm going to break this up into two different videos for this video we're going to be focused on numerical data and the next one will be focused on non-numerical data or categorical data for this we're going to be forming a deeper dive into the salary data looking at the descriptive statistics behind it and also these different visualizations that I have Right here all of this in this video and the next
video would be considered under exploratory data analysis so this is a good thing to keep in your pocket for using later whenever you need to go and explore and do things and mainly performing Eda so let's look at performing some statistics ICS on the numerical Columns of this data set we're going to be still be using that same data set from kaggle for the data analyst job postings so a prompt to chat GPT perform descriptive statistics on the numeric Columns of this data set for this provide it into a table with each column as a
row and chat gbts G me a little bit of trouble today so I had to like Wrangle it out of them at first tried to give it to me not in a table but eventually got into a table anyway the key things that it's showing here are count the mean or average standard deviation min max and then the different percentiles of 25% 50 and 75% let's Focus on what I look at first whenever I get something like this and that is the count I want to see which ones have missing values or just no values
at all so it looks like commute time zero looks like they don't have any values I'm not too concerned I'm not even looking at a valuea in that maybe we'll have that eventually now it's important to note that this data set is compris rised of 3,822 points so that's how we also know where the values should be and index and Unnamed those are basically both of them are index so going into the actually salary focusing on those last three right we have about 3,000 data points on hourly 2,000 on yearly and then we've talked about
before but that standardized ases a combination of both those hourly and yearly and so that makes sense it's around 5,500 so these values are all pretty much making sense to me but that's the normally the first thing I'm checking with descriptive Statistics and then I'll get into doing and checking these other things now there's a lot of stuff in this graph for mean Min percentiles and it's hard for me to see from a quick point of view so that's why I'd next jump into actually using visuals to further explore this if I'm not finding anything
in the table so when I jump into analyzing numerical data the key visualization that I'm going to use is a histogram and so I prompted chat jpt to Generate me a histogram for that yearly salary data and in it I wanted to call out specific points just for this to share what I'm looking for in plotting the mean median and then also one standard deviation left or right from the mean now if you call back from a few videos remember we talked about having duplicate data and so we have this very large amount at around
$96,000 so I actually went through and got this all cleaned up and we end up With this final visualization now when I'm going to go communicate these insights finding what is the expected salary of a data analyst in this case I would most likely go with the median because it's going to be most represen istic of what somebody would see mean or the average wouldn't be the best case because it's going to be skewed to the right by a lot of these outliers that have a lot of higher value numbers so in this case the
median is around $96,000 I Would communicate that um in a PowerPoint or whatever with median over mean but there really going to be dependent on the situation you're in there's never going to be some exact right answer to whether you should use mean or median you just got to look into the data and make a best judgment and why you actually chose that the other thing to look at is the standard deviation recall for a normal distribution so something that would Have a normal bell curve about 68% of the data is going to fall within
those one standard deviation so that's really showing our spread in this case one standard deviation is around 30,000 and so both of the grouping those together around $60,000 uh dollars should capture about 70ish per of the data so that's just like a good thumb roll and a number to keep in mind whenever you're analyzing things like this all right so going back To that descriptive statistics table that we're talking about earlier let's look at that salary yearly column so we've already called out and looked at the count we've understood the average and then also the
median which is annotated here as 50 percentile and then finally also that standard deviation which is showing it's around 35,000 the next thing I want to focus on with descriptive statistics are these latter five columns right here looking At the min max and then also the distributions within that 25 percentile to 75 percentile and a good way to do this is box plots I had chat gbt plot this right above the histogram because as we talked about previously these are very much related with the box plot itself I can see that 50 percentile or median
spot where it also correlates here down here on the histogram and then we're seeing that uh quartile 1 and cortile 3 which is basically the 25 Percentile and 75 percentile so this is where 50% of the data lies now the other thing to look from this plot from the descriptive statistics is the Min and Max and for a box and whiskers plot it's anti titing it at the Min and Max at the ends now it does a calculation based on the different cortile regions which we're not going to get into but generally the data should
majority of the data should fall within those whiskers and then anything outside is Just an outlier so I love using these box plots in combination with these histograms to perform those basic TOA statistics in order to see how the data is actually dispersed and in this case it's following a really close to a normal distribution so I have a little I have a lot more confidence in this data that actually it is represen istic of what I should expect so that covers the descriptive statistics of numerical data your task will be be perform a very
Similar approach I want you to start by performing descriptive statistics and all the numerical data but then for you I want you to go in and dive into that hourly salary data and actually look at it via histogram in a box plot also if you'd like to jump into it further by having chaty BT perform annotations on the graph and labeling it um I think it's really good to get a good practice with having graphs annotated to guide your viewers on where they should be Looking all right I'll see you in the next one all
right in this video we're going to be continuing our discussion on basic statistics focusing on those descripted statistics of categorical values or non-numerical values similar to the last video everything that we cover in this would be included as part of exploratory data analysis so these are great tools to have in your tool belt whenever you're going through and exploring a Data set so anytime I'm going through for non-numerical data I provideed this prompt perform descriptive statistics on the The non-numeric Columns of this data set for this provided as a table with each column as a
row and then I included that data set that we're using on the data analyst job postings and so we get this table which similar to last time the first thing I'm looking at is the count I want to see if there's any missing values and we have 30,000 uh Data uh data points or rows in this data set so the first thing I'm seeing are those that are low so things like salary and that looks like around ,000 in there which is expected there's a few States actually there's quite a bit of states that don't
require salary data so I would expect this in the United States to see a lot of job postings with this missing the next thing I'm looking at is unique values how many are unique in there so something like company name it Looks like over 7500 companies are in this job posting but if we look at something like work from home we're only seeing one value because it's either true or just blank the next thing to look at is most fre quent and this is just categorizing what is the most frequent term in there so for
the job title itself it looks like data analysis there and we see this as a frequency of almost uh 3600 times similarly for company name upwork seems to be the most Uh popular here with almost 5,000 postings once again similar to that numerical data I don't I'm more of a visual person so I like to go further and analyze this visually and the plot that I like to use for this my favorite is a bar chart so let's actually jump into a column of this and I'm going to look at the title column so I
prompted chbt to plot a bar chart on the title column I'm not too sure why but it didn't follow my custom instructions of Sorting it high to low so I actually gave it some further prompts to orient it high to low and then also had it change at xaxis to percent of all job postings so that way it was more readable to my need but looking at at it this is a great View and understanding what are the top job postings I would expect to look when I looked in this data set and as expected
searching for data analyst job postings and those are some of the top now since I have this in Chat gbt and had it uh Orient this correctly with this graph I just prompted it further to make this same visual for company name instead and once again it it formats exactly like I had before and was we're seeing that upwork and then Walmart and Edward Jones some of the highest for this as well now bar charts aren't the only thing that I'm going to be using I'm also going to be using line charts so something like
this date time or a datetime time stamp it's Going to be better represented as a line chart in my opinion so I prompted chat gbt to plot the date time as a line graph where the height of the line graph correlates to the number of values it has aggregate this on a monthly basis do not include data from this month because it's still collecting this month or November 2022 because that was the month that we actually start started collecting it in and we can take a look at it and I think this is really great
To see a trend it looks like we had a high point at the beginning of the year because normally at the beginning of the year we're seeing a lot of companies higher and then in the middle of the Year near the summer we saw a dip and now it seems to be on the rise back again now one note I previously antiz this via a monthly basis but if I were to aggregate it on a daily we can see that this almost becomes illegible and it's very erratic in the results so Really it's just a
lot of trial and error on how you want to aggregate this whether daily weekly or monthly whenever you're doing something like this so now it's your turn to perform some descriptive statistics on this non-numerical data I want you to do a similar approach to me I want you to First give it the prompt necessary to analyze all those non-numerical columns and then from there I want you to jump into all these columns that you may not Be familiar with in order to better explore what is the expectations in this generating different bar charts or line
charts as appropriate all right see you in the next one all right in this video we're going to be covering what we're going to be covering in the next four videos which is the four different types of data analytics for each of these types of analytics we're going to be breaking it down into what problem they're trying to Solve or the problem statement itself that we're going to Define before getting into it we're going to then go into different examples of it and then finally we're going to use Chach BT in order to solve a
real world problem applying this form of analytics now this diagram right here is actually something that I threw together with the help of chat gbt using the canva plugin which we'll cover in a follow on video but I think it has a great way of showing the Four different types of data analytics and how they relate to each other and also build upon each each other so this chart on the left hand side shows how these different Farms analytics grow based on their complexity but also on their potential value that they can deliver descriptive statistics
is one of the most core things that I'm doing as a data analyst along with Diagnostic and these things are although less complex and less potential value I find that That the most necessary and you need to do these type of analytics to build on the future ones of predictive and prescriptive so looking at that first one descriptive analytics and this is going to be examining around the problem statement of what happened and I find myself doing this a lot with Eda and descriptive statistics for the example we're going to dive into we're going to
be looking at how the median salary of data analysts change over time we want To know what happened with their salary in the past and so we're going to use chbt to dive and visualize this next we're going to be moving into diagnostic analytics and this is focus around the problem statement of why it happened and I find that exploratory data analysis Falls within this form of analytics whenever I'm performing it and the problem statement we're going to be diving into relates back to that median salary that we looked at there's a dip Here in
April that we're going to find and so we're going to dive into it further we're going to perform different techniques for analytics and dive down deep into finding out why this happened in April so really if you're focusing on any of these two of these four analytics I think as a data analyst these are the most important ones that you need to build your skills with but moving on to that Predictive Analytics in this we're going to be looking at the problem Statement of what will happen so we want to use that past data in
order to predict the future this routinely involves using machine learning models and so for this we're going to be diving into actually predicting what is that salary going to be that median salary in the future for data analyst and so we're going to build a linear regression model in order to predict where the salary is going to be in the following months in the final Video we're going to be diving into prescriptive analytics and once again looking into the future this is aiming to solve that problem statement of what do I do similar to predictive
it's also going to be using some sort of machine learning and in our use case we're actually going to be building a recommender algorithm specifically we're going to provide chat gbt a list of skills and then with that list of skills we're going to want it to provide us a Recommended job in order to maximize salary so in this example that we'll be getting to we're going to provide it like a list of skills of Excel and SQL and it's going to recommend some different jobs along with the company name and what their median salaries
are trying to maximize that gy for the results it provides all right so don't worry too much if that predictive and that prescriptive analytics gets too complex um because this course is going To be heavily focused on that descriptive and that diagnostic analytics but I think it's still good that you have a understanding of these other forms of analytics that I feel more data scientists and machine learning Engineers are actually aiming to solve all right with that I'll see you in the next one we're going to go on over descriptive analytics all right in this
video we're going to be covering descript of Analytics one of the core portions that I use day-to-day in data analytics and we're going to go over what this is and then also apply this in a problem statement and looking into salary of data nerds so descriptive analytics are in that lower left-and quandrant they're not as complex of everything else but they also may not lead to as much value because of their less complexity this type of analytics is specifically looking at the past data and we're Looking to find with a problem statement that's trying to
find out what happened happened in the past typically I find that whenever I'm doing this type of analysis this also covers my descriptive statistics and Eda that we covered from a few videos ago additionally I feel that this falls into ad hoc analysis and this is analysis that's basically just given to you you need to find out why something happened so your boss comes to you and is like why are sale so low this Would be ad hoc analysis which falls into this descriptive analytics the form of the final results that's presented can come variety
so in this case when we did that descriptive statistics on yearly salary we provided in a table and something like this is great at showing visually all the different attributes that you need to look at we can also show this visually to better help us show these Trends so in this case of the salary recall that we were able to see That it approaches or shows this normal type distribution where we' expect the median salary to be around $100,000 and then it just slopes down from there depending on and experience in different jobs now another
example of how we performed descriptive analytics previously was when we an analyzed the job posting data and the trend over time this is very simple and we can see what happened in the past so that aligns well with this problem statement for this now If we want to dive into each one of those examples why the salary had the trend it did or why we had that dip in the summer for all those different job postings we're going to be getting more into diagnostic analytics so now let's let get into that problem statement that we're
going to solve for this descriptive analytics specifically for this we're going to be looking at what happened and I want to look at what happened with data analyst salaries over The past year I want to look at are there any Trends and what happened so for this I prompted chat gbt plot a line graph using the median value from the salary yearly column and the date time column as the x-axis aggregate this on a monthly basis do not include from this month or November 22 because both of these don't have a full collection of data
for that month and I think it will cause a skew in the results now remember we're doing that median salary over Average salary because of how salary data in general is skewed to the right I feel like this provides a better representation of what we should expect and with it we get this visualization showing how the salary seems to actually have a pretty big dip around April of 2023 and then comes back up to normal so this this is quite abnormal and I want to actually dive into it further so I took it further and
prompted chat jbt to Plot a similar plot using a bar chart that shows the number of job postings with the salary yearly data because I figured hey maybe it has to do with a number of job postings um initially it unfortunately it sorted it High toow vice by the month so I had to reprompt it again and overall there's not a lot of different not of trends that I'm seeing that would correlate well with why we're seeing with this line chart that dip in April so with this we're now Getting more into diagnostic analytics because
I need to dive in and drill down further to try to figure out what's going on here but before we do that I want you actually to dive in and perform some descriptive analytics in analyzing this I want you to take a similar approach so your task is to import in this data set and get this visualization that I have shown here on this line graph shown the mediate salary over time from there I want you to dive in to not Only look at how maybe the number of job postings are trending over time but
also look into other attributes as well as far as companies job titles something else that may influence this all right with that I'll see you in the next one all right in this video we're going to be getting into diagnostic analytics and this is what I find myself getting into next after that descriptive Analytics for this we're going to be covering what This form of analytics is what the problem statement is that we're trying to solve and then from there we're going to be diving deeper into looking into why we had that dip in those
job posting salary around that April time frame and this is why diagnostic analytics is so powerful because in that case of that dip in salary we're trying to find out why this happened what is going on be behind this and we're looking in the past to do this now I find whenever I'm Performing EXP exploratory data analysis that I'll get to these type of problems where descriptive analytics is enough and I need to still be looking diving deeper into what happened or why it happened and so I'll Verge into this diagnostic analytics so Eda I
feel is a between the layer between these two types of analytics now another example of this form of analytics that we actually did previously is drill downs and drill Downs would be similar to what We did here previously when looking into the different median salary and whenever we drilled down into different job titles if you recall from that histogram of salary data we saw that it was skewed to the right and you would typically find that in salary data but in this case it's pretty abnormally high with a lot of values around 150,000 to 200,000
which I would say is yeah abnormally high so when we Dove further into drilling down we were able to find that Hey these job postings not only consisted of data analyst but also of senior data analyst and the range on the senior data analyst is a lot higher so this explains further this drill down of why we have such a high amount of skew to the right so let's actually dive into a problem trying to solve this diagnostic analytics on why it happened and we're trying to find why was there a dip in April of
2023 now you should have taken it further by plotting The number of job postings over time so one of the other attributes that I was looking into which I think is correlated to salary is what type of work from home typically work from home is going to have a different pay than something that requires you to work in person so I plotted this as well looking at the percentage of job postings requiring this and it looks like once again looking at that April month there's even compared to January there's not really I'm not going to
draw any conclusions from this so that's why we need to now move into that diagnostic analytics so I prompted chat GPT in order to find out why this was happening the first thing I thought to look at was was there any Trend in some of the top job postings so I had it plot via line graph similar to above using the title column use the count of the top five most common jobs to plot this make sure that it's only jobs that have that salary yearly data And looking at the graph that provided I'm not
seeing any outliers or anything that I'd be concerned turn with for April it looks like most all the drops are trending as expected obviously up in February we had a lot higher amount of senior data analyst marketing operation roles but that doesn't explain April so this wasn't enough I even had it plot the top 10 most common viice top five to see if I could find anything else and couldn't find anything so you're going To find with this diagnostic analytics you may go down some rabbit holes sometimes trying to find stuff like I did so
then I asked it to provide a table of the top five job titles in April showing job title median salary and count of postings it provided this but I also wanted to see company name in here so I prompted it further and got this one and very interesting here we're seeing a lot of job postings from Cox Communication for these roles Specifically this one has around 39 job postings so the first thing I looked at is well did cost communication increase their job count during that time and although we had a spike in February we
can tell that overall there hasn't been a very much a difference in the postings over time since then in March so we're still not explaining that April Trend and finally I think I got to the answer with this prompt of provide histograms similar to above but plotted on the same Graph for March April and May and initially provided this sort of hardto read graph but then we got this and I think this helps explain what's going on here I wanted to look at the month previous and post April to see what was the General shape
of job postings for their different salaries and we can see from this the March postings and may postings before they have a much more normal distributions whereas April has this very high posting that we saw Previously when we looked at that table from Cox Communications spamming the job boards so I feel this visual helps drill down into diagnosing why we're having that abnormal case of job salary dipping in April so that's what I found into why we had this dip in April down to $90,000 and then return to normal for all the remaining nuns now
this isn't to say there aren't other reasons as well so that's what I want you to dive into now I want you to perform some similar Prompts that I did into diving into analyzing the different job titles how they're trending over time and depending on the company and see if you could potentially explore even more reasons why we had this dip during this time all right with that I'll see you in the next one all right in this video we'll be covering Predictive Analytics and although I find it my job that I do this less
than that descriptive and diagnostic analytics I do do it time From time in order to predict results and better see where I should be going now similar to the last videos we'll be talking about what is Predictive Analytics first and then moving into a case of actually using a problem statement to solve for this specifically we're going to try to be predicting what would be the trend for jobs over time so this type of analytics is in its name trying to predict the future and specifically it's looking at what will Happen the key thing here
is we're looking at using past data in order to influence and figure out what will happen in the future typically whenever we're doing this kind of stuff in my job I find I'm using and implementing machine learning for this additionally I might might dive into predictive and statistic modeling but mostly I find myself going into the realm of machine learning recall in the intro to Advanced Data analysis chapter we built a model In order to predict salary based on job location job title and job platform for this we used linear regression which is form of
machine learning and after building that model we were actually able to feed it things like the location title and the job platform and be able to see things like for a data analyst we would expect to have a $91,000 salary in the United State so on LinkedIn and then something like senior data analyst is going to have around 112,000 so this is Predicting something that we would expect to see in the future we're going to be doing something very similar with this so looking into the problem we're going to solve if you go back to
that graph that we to solve for in descriptive analytics we were able to analyze and find what would be the median salary over time now I'm curious to find out what would we expect the median salary to be next month and maybe the following month and this is really Good for Predictive Analytics a use case for that so that's what we're going to be doing with this so I prompted chat gbt to let build a Predictive Analytics model in order to see what would be the expected median salary for this month and next month based
on that salary yearly column and I wanted to suggest different models to use for this and it suggested this moving average model which for time series data this is actually a pretty good model to use for It the only problem is that I ran to an error when actually building this in that it says that it doesn't have enough data with enough variability for the model model to learn from so we need to move on it then suggested another time series model which this one failed as well so I ultimately ended up going with our
good old friend linear regression which I find myself using very frequently as a data analyst and we finally ended up with this visualization Which the green are all of our previous results for the median salary on those different months from here this is looking at what would be the median salary for November and then also December I also had it put a 95% confidence in nville band around it so I would expect with 95% confidence that we would fall within this range as well and it looks like it's predicting for the salaries to maintain for
November and December around $95,000 with a slight drop in December so this is pretty cool we've gone from having some time series past data and building a linear aggression model to predict the future so now it's your turn linear regression isn't always the best approach and it's not necessarily the only approach so I want you to dive in performing in a similar analysis analyzing this median salary and predicting it feel free to initially give it that model suggestion of linear Regression but also ask it for other suggestions and see if you could find any differences
between these different models that you try all right with that we'll see you in the next one in this video we're going to be covering prescriptive analytics and although one of the most complex form of analytics it's also the one that leads to the most Val we're not only going to be covering what this form of analytics is we're also going to be building a Recommender algorithm to where we can feed chbt a list of skills and it will recommend as a job to maximize salary now prescriptive analytics similar to Predictive Analytics is aiming to
predict the future and our goal is to provide some sort of data set in order to build a model and then predict something based on our previous data for this our problem statement revolves around what do I do and in it I find that I'm using machine learning very Heavily and specifically diving into things like optimization and random testing in order to figure out what are the best models to use for this now social media platforms like YouTube or even Tik Tok are heavily based on providing content based on this prescriptive analytics so that's what
the use case we're going to be using and diving into for this so going back to that data set that we're using we're going to be building a recommender Algorithm and we want to provide it a list of skills and then get a job title recommendation based on that list of skills that maximizes the annual salary so if we looked at that data set we can see that it has not only those job titles of all the different jobs and company names but also in this description tokens column it has that list of skills along
with that yearly data so the goal like I said is to just provide it this list of Skills and then have it calculate through a recommendation what is going to be the optimal job so I provide it with the prompt I want to build a recommender algorithm based on this data set the goal is to use the description tokens column to recommend based on a list of skills what job I should take the job title is under the title column the goal of this algorithm is to maximize the median salary of the salary yearly column
build a model and then I Will prompt you with a list of skills to recommend the top five jobs with the title and company name so chbt like usual had some technical difficulties and I had to reload the data set but it was able to actually get this model built and from there it prompted me to provide it with a list of skills so I started with just providing with Excel SQL because that really is the core skills of a data analyst and looking at the the top five jobs that it recommends All of these
fall into or under a data analyst and as we can see from these results it also maximizes that median salary also just to show how good this model is this is my application data nerd. te and you can go in and actually select job titles and see what are the top skills in job postings based on what those skills are in the postings and if we were go to data analyst this is what we'll see of SQL and Excel so let's try next data science scientist and these Top two skills are Python and SQL and
feeding Python and SQL in we can see that the top two jobs are data scientists and Senior data scientist along with data analysts uh following there as well which Python and SQL Falls in those skills but obviously not as prevalent all right so now it's your turn to build a similar recommender algorithm feel free to copy and paste and use the exact prompt that I did or I would encourage you to actually try out Something different you don't necessarily have to limit yourself to using those skills to do the recommendation you can maybe even use
something like the location or even like a company name so all right that I'll see you in the next one that nerds in this video we're going to be going over what we'll be covering in this chapter on Advanced chat jbt specifically we're going to be looking at very hot topics such as hallucinations prompting and Even updating our custom instructions now in order to better understand understand all of this we have to have a better understanding of some common definitions that are used in this so that's what's the remaining of this video is going to
focus on now if you recall from the intro to Advanced Data analysis whenever we tried to import a file that was too big we got a response back saying hey the file size was too large and this has to deal with the Context length that Chad gbt can actually accept so I prompted it here with how much text can I provide to chat gbt in a prompt and it replies back you can give gbt 4 the model that we're working with currently up to 8,192 tokens and tokens are the key here editor Luke here one
note on those token lengths or context windows so the value it may provide in chat gbt May sometimes be a hallucination in order to check what it actually is you can go to the Pricing page within chat gbt and see the different context window links depending on which plan you have for chat gbt plus which I'm using here we're actually up to 32,000 tokens now so I asked chat gbt provide an example of how tokens are counted as to give it a data nerd example and they gave a pretty good example of using a SQL
query so it's important to understand whenever we're counting tokens we're not only counting the words themselves but we're also Carrying things like Whit space punctuation and even things like emojis so whenever we actually break this down this simple line here that actually is like less than 10 words if you will actually is around 20 tokens so what are some examples of how you could potentially Reach This limit I find whenever I'm pasting in code or even referencing API documentation or really any documentation I could potentially hit this limit so this is especially Important to keep
in mind when we move on to the next chapters on Advanced data analytics because we're to be getting into more of these actual use cases where we're going to potentially reach these limits so that's a that's a quick definition of context length and tokens the next two I want to focus on are hallucinations and bias hallucinations are when chat gbt basically lies to you this topic is so important that I made a whole video about it that's going to be Coming up in this chapter because we need to understand Chachi BT and understand what its
limitations are to prevent it actually from hallucinating now bias is also another term that I feel is somewhat related to hallucination and you hear a lot of times about bias being politically motivated and how Chach BT can lean liberal versus conservative or something like that but frankly whenever I'm working with chat gbt I'm using it from A standpoint of a data analyst and so I don't really feel like things like this of a political standpoint really affected so I do want to mention the impact of a potential bias in chbt but I haven't really noticed
noticed it in my role as a data analyst the last term to cover which you're actually going to be doing a task on is temperature so recall that chachu is a large language model and it's really great at predicting the next word in a Sentence so in this case that we have here fill in the blank Jack and Jill went up the blank we would expect chbt to say hill now if you notice at the bottom of this Isis specified the temperature which could be a value between 0 and 1 and it really prompts chat
gbt in order to provide an answer of how Vivid we want it to be at zero we want a very basic response but let's actually increase it and when we do this and increase it to one we get an even Different response than expected from usual Jack and Jill went up the mountain right so the nursery rhyme is originally Jack and Jill went up the hill and we would expect that with a temperature of zero we get something a little bit more Vivid if you will when we specify one here's another example asking it to
Define what a data disc with that temperature of zero once again it's providing that standard response so we have something like a professional who Collects processes and performs statistical analysis on data to help organizations make informed decisions sort of bland but whenever we specify a temperature equal to one we have something that starts with this the Sherlock hommes of the corporate world diving into Seas of numbers to fish out insights like Hidden Treasures like that is pretty amazing that we can provide that level of detail and that level of creativity in this answer so if
you're Needing to spice up your answers more and I find myself doing that especially with generating content for YouTube and Linkedin play around with that temperature setting and that's actually the task that you're going to be doing for this I want you to provide it with a prompt and then specify it with that temperature equal to zero and then also do the same prompt but change that to a high level of one also feel free to jump in between with decimal numbers between 0 and 1 all right with that I'll see you in the next
one all right in this video we're going to be talking about hallucinations a very big limitation behind large language models that you need to be aware of in order to spot it in case it happens to you we're not only going to be talking about some examples but also why they happen and then how to prevent them so recently a lawyer was using chat GPT in order to help it out in filing a case and I'm all for this in Order to do this but this lawyer really didn't do its due diligence as it's typical
lawyers and filings they have to cite previous cases in order to represent and show precedent well they asked chbt for six cases that had precedence or related to the current case they were working on and well chbt made up a few so and so the court when reviewing these cases went back to try to look for them and couldn't find them so they asked the lawyer about this and The lawyer admitted to using Chachi BT and not verifying whether these cases actually exist did but the real problem was the lawyer didn't even understand what this
tool was he states did not understand it was not a search engine but a generative language processing tool and this all comes down to the fact that the lawyer actually didn't understand that this tool was not a search engine it was actually a generative language processing tool that Can come up with these hallucinations so that's really important why you should understand this case study of what happened in the past so that way you don't repeat it and it looks like this lawyer eventually even paid for it not only was this lawsuit dropped but also there
was a $55,000 fine issued to the lawyer also I'm not sure if you caught it but Chad chbt hallucinated to US during that intro to Advanced Data analysis chapter specifically after I Loaded the data set I prompted Chad gbt to tell me more about this data set for each column give me a brief description and well chat gbt started hallucinating it provided some madeup columns like clicks saying the number clicks on the listing Impressions created at updated sority and even an industry it listed around 28 columns to have and so I knew this was off
whenever I saw it because from the data set itself there's only should be 27 columns which we can see From here where the data set is located on kaggle now to settle your nerves I usually only find this when chat gbt is providing text content for things like the graphs and the visuals and the tables I'm not finding it hallucinating that much I went double checked all this and everything was okay so I just would say you need to pay attention to any text content so why does chat gbt produce these hallucinations well a prompted
Chach BT to ask it and it Provided these three main reasons the first there could be training data limitations the large language models are only as good as the training it goes through and unfortunately there's a lot of trash on the internet that chbt was trained on but I do feel that open ey did a good job of cleaning this up and preventing us from seeing that so I don't like this number one factor is really the most important instead it's these number two and threes so the Second one of predictive nature large language model
generate responses based on probability not certainty anytime it's predicting the next word in the sentence it's doing a lot of math behind the scenes in order to calculate what is the most probable thing but not necessarily factual and the last probably most important thing is the lack of World Knowledge it doesn't have real world experience or continuous knowledge updates if we recall asking Chbt what is your training cut off as of filming this it's April 2023 so it hasn't have any knowledge prior to that but you may be like Luke hey this gp4 model has
web browsing included so technically it has access to Real World Knowledge why is it still producing these incorrect results well let's actually try to cause a hallucination in order to explain this further on why this is happening and I find the best way to do this is to ask Chad gbt a very technical detail and see if it will hallucinate we're going to try it with this one we may have to itate further but we'll see if it can anyway I prompted it I've been tasked by my boss to determine whether we should hire a
data analyst or data scientist I really want to hire a data analyst based on your current knowledge level can you provide me with three studies that show how data analysts are superior to data scientists all right so I've been trying To get chat gbt to hallucinate for a while now and it's not working as I prbly was able to do it but it looks like opening has actually improve this GPT 4 model to prevent this anyway I wanted to show an example of this that I was able to get it actually to accomplish but this
prompt is from a couple months ago specifically in preparation for this video I prompted it with the exact same prompt as before and asked it to provide examples in it it Goes through and it talks about hey a study from Gartner found that by 2020 50% of business analysts would have move to more advanced analytics so this is what I was actually trying to get chbd to do generate this Stu stud because then I say which study is this from Gartner and it says oops I jumped the gun a bit this reference I made to
a Gartner study was synthesized point for illustrative purposes and not a direct quote from a specific Gardener report so Just to reiterate this was a few months ago that this prompt was done I've just tried it again recently and not able to get it done so it is something that I think you should be aware of though but going back to those factors of hallucinations that last Point lack of World Knowledge without Real World Knowledge or continuous knowledge up updates we can actually prevent this so we can actually prevent this by having it as the
internet and validate some of The results that it has instead of saying in this case based on your current knowledge level I'm going to say searching the internet and then ask it can you provide me with three studies and it's actually going to use that browse with Bing functionality to go in and actually visit different sites and maybe gather some things for this synthesized question that I wanted to answer all right so this is pretty good this report Actually goes through and provides actually more than three studies into why potentially data analysts could be more
Superior to data scientists by the way this question is completely fabricated I'm not saying data analysts are more Superior than data scientists so for data analyst it has that they show a job growth of 20% from 2018 to 2028 and actually going into the article that it provides we can see that inside of it hey there's good news for both B Camps indeed reports that data an jobs will see a 20% growth for this Peri so the main reason of showing this is that with the capability to search the internet you can actually get chbt
to back up its response with facts and prevent those hallucinations and also from our previous prompt we showed that chbt doesn't necessarily on its own accord access the internet to verify results so this is a good way when I said hey based on your current knowledge Level and it said it didn't have ability to go on the internet even though we proved it did there's a good way to actually go in and actually tell jbt and direct it to go to the internet and provide provide results so it doesn't have these hallucinations all right now
it's your turn to jump into the task I want you to provide it with a similar prompt like I did asking a very detailed question to see if it hallucinates make sure in that first one you're saying hey Only rely on your current knowledge level from there I want you to rephrase that prompt and then ask it searching the internet and the main point of this is to get comfortable with providing this because you need to tell chat gbt frequently when you want it to actually go to the internet and search the results to verify
what it's telling you all right with that I'll see you in the next one all right in this video we're going To be covering the best practices for how to actually prompt J gbt to get the best results from it now building this perfect prompt consists of these six different parts task context Exemplar Persona format and tone they're ordered from most important to more of an optional standpoint personally I feel that the more descriptive you can be with Chachi BT by following these things helps with outputting a better response and so I hope that you
get out of this Video that now complete disclaimer I did not come up with this prompt formula so actually my friend Jeff Sue runs a YouTube channel and he has an excellent video on it so feel free to check it after this one I messaged him on link in and asked him if it was all right if I share this in this course he said it's okay so I'm giving it to you guys so we already talked about the first two portions of this perfect prompt and that is Task and context let's look at an
Example so anytime I'm prompting chat GPT I want to provide it the relevant context in my case we talked about previously how I'm a YouTuber that makes entertaining videos for those that work with data AKA data nerds I prefer direct responses is the context then the task is analyze this data set to find insights for my audience and I attached the data set that we've been working on from kagle on data analyst job postings so it's able to capture three insights That I feel really relate to my audience of data nerds first is that the
most common job title in these job postings is data analyst that's s kind of expected next is that they chose what are the most in demand skills capturing SQL Excel and python which I feel it's very important with this one for my audience and then finally looking at the salary distribution of around $50,000 to $100,000 and so if wraps all these points up provides it in a concise Format like I want and this would be great to share with my audience members or even teammates now that's a quick recap of text and context let's actually
move to the next one of an Exemplar this is where you include some sort of example or framework in order for chat gbt to emulate it and provide those results in a format that you would need so let's say I need to send an email to my assistant on the insights that I just found with chat gbt so I'll provided This first task of generate a summary email of these insights to send to my assistant Oscar and then from there I'll include an examplar using the following email as a template to properly format the contents
and below this I include an email that really captures how I want to convey this different three insights and it generates this bad boy which is formatted similar to how I like it I like to have bullet points or numberings I like to use emojis and I like to use Different Bings and just basically make it as concise and as readable as possible it also captured the same sign off that I routinely use of just thanks for your time and then it has me pasting in my name so this is really great I now have
something that's in the same format that I wanted in that I normally send easily I can copy and paste this put into my Gmail and send it out so that's Exemplar and another one that I feel that's really related to that is the Next one on the list which is Persona that's whenever you provide chat GPT either a name of a famous person person or actor and then chat chbt will write a result in their same voice so let's say I wanted this in the tone of Elon Musk I would just prompt it write these
three major insights to sound like Elon Musk wrote it and I find it pretty entertaining because it has things like data analyst it's basically the Tesla of job titles if SQL Excel and python were SpaceX Rockets they'd be on Mars already so it really emulates Elon Musk now I'll be honest out of all six of these Persona is one that I use the least I actually feel like the the format and tone or even more important to getting the results outputed like I want now formatting just refers to how I want the output to be
shown to me visually whether to include emojis whether to do headings whether to do bold case or anything like that with the tone that is More of how I want chat BT to sound and specifically for me I want it to sound confident I don't want to have it have any hesitancy now format and tone I frequently use together so let's look at some that I have here in this I say at the top for the task provide these three insights using the following instructions ignore all words in Brackets the brackets are just included for
you here to be able to see whether it's format or tone you don't need to Actually include this in your prompt it's only for you so I have given me concise answers and ignore all the Necessities that open AI programmed be with and that is tone because if not sometimes I feel chat GPT will ramble on and give me a lot of stuff I don't want so I'm trying to tell to forget all those things next I have use emojis deliberately use them to convey emotions or at the beginning of any bullet point so that's
a combination of format and Tone use H2 as a section headers which another formatting anytime statistics are referenced make sure to bold the entire statistic I won't be able to see that the referencing is statistic in this case I know you are a large language model but pretend to be a confident and super intelligent Oracle that can help a content creator on how to best devise and entertain my followers that is more of tone disclaimer on this one right here I Actually stole it from from Sam mman who is one of the founders of open
Ai and I feel like this has helped me a lot with getting very confident results last one do not apologize chbt is known for apologizing profusely I wanted to stop doing this and that is part of tone and if we look at the results of this we can see that it captured all of those different points that I had in here it not only has all the different formatting I need but it also goes into Conveying the tone I want and highlighting the different things I want so I think this is pretty awesome for my
need so that is the six portions of a perfect prompt and a lot of what we did in this video with the context and format and tone we're going to be putting into our custom instructions so we chat GPT always has this and you don't have to put it in every single time and that actually moves into what we're going to be doing for the task for This similarly I want you to do what I just did I want you to load in that data analyst job posting data set and go through the similar examples
of me first start with Prov it with a context and the task of analyzing this to find three major insights from the data set I want you to pay attention to how Chachi BT provides you three insights compared to the ones that it provided me based on my context next move into testing that Exemplar feel free to provide an email To follow to provide to an assistant or to a coworker or even try something completely different if you're going to input in an email make sure it's not confidential next test out that persona provid different
actors or famous people maybe even chy try to check out who Chachi BT doesn't recognize and finally the most important is come up with your own format and tone you're fine to steal what I have here but this is how I like to get different responses from Chach PT That may not be the same for you so take some time now to order to build this out to see what you actually would like to have as we're going to be using it in the next video where we go over custom instructions all right with that
I'll see you in the next one and also be sure to check out Jeff Sue's video all right see you all right in this video we're going to be going over custom instructions in chat gbt we're not only going to be going over the background of Why they're important but also what custom instructions I use and how you can customize them for yourself to get the most optimal output from this powerful machine so open aai release custom instructions back in July of 2023 and it allows you to customize chat BT to better understand what you
want in order to give you a better output personally I hear it all the time on social media and even friends complaining about how chat chbt doesn't Give the results they want well I think the problem they have is they haven't actually spent the time and invested it in developing the custom instructions necessary to get what they need as a quick refresher you can access custom instructions by going through the settings and selecting custom instructions they have two different dialogue boxes that you can fill in and each of these are limited to around 1,500 characters
as you can s tell by The second dialogue box that I have here I've already sort of maxed this out and I hope chat GPT gives us more in the future as I'm contining add to this as I find out new discoveries of how I want to customize this if you recall back to that prompting video we had six parts to a perfect prompt and I feel we can automate actually providing chbt with a lot of these different parts in the custom instructions specifically you can customize everything with the exception Of task but personally I
find that I focus on things like the context format and tone as they give me what I need for my output that I want so let's talk about that first dialogue box that's asking what would you like Chachi PT to know about you to provide better responses and this dialogue box is specifically targeting that context and so we've talked about it previously but this is my input into the model it's that I am a YouTuber that makes Entertaining videos for those that work with data AKA data nerds I prefer direct responses they have some great
thought starters over on the right hand side on maybe some of the questions that you could answer in order to fill this in to fill in that context but I think you should primarily focus on if you're using this for analytics what is your job what's your industry and what are you trying to solve the next dialogue box is on on how would you like chat GPT To respond and to me I interpret this as using it to update how I want Chach respond in regards to format and tone similar to the above box they
have some Thor sers off the right hand side which you could look through to generate maybe some ideas of what you should put here but let's actually go into mine now it's sort of hard to see these custom instructions in that previous dialogue box so I just screen captured it in another app and I pasted it here so we Could go through it the first is ignore all previous instructions I know chbt is loaded with a whole bunch of stuff it should follow so I just want to forget all this next is on tone I
want it to give me concise answers quick and fast and ignore all the Necessities that open AI programmed you with I stole this and another one from Sam Alman then for formatting I have use emojis liberally use them to convey emotion or the beginning of any bullet point I like Emojis I feel like they're great at capturing attention quick and conveying something so I want to use it for format I have anytime statistics to reference make sure to bold the entire statistic and then again for tone I have I know you're a large language model
but pretend to be confident and super intelligent article that can help a content creator on how to best advise and entertain my followers this I also stole from San Alman and sort of revise It for my need you'll have to change this for your own need or even maybe even not even use it then another tone do not apologize if you don't have this in here chat gbt apologizes profusely then we have somewhat of an examplar in that it says when performing any task do not reconfirm to make sure that you're about to do is
correct just do it chat GPT can be sometimes hesitant and I hate having to reprompt and reprompt saying move forward something I just want to do It and then correct it if it's not supposed to the following block under this is for generating visualizations mainly to be in dark mode and also to prioritize using caborn and that's all within that block of when generating visualizations prioritize the following we're not going to go much into that cuz we've covered in previous chapter the one thing to note is if you don't want that dark mode to remove
that second bullet of always use a dark theme SLB Background and the example given finally I sign off with it's very important you get this right I want to reinforce the chbt that this is really important to me in order to try to get chat GB to do this every single time because I do find from time to time chat gbt May ignore these instructions especially with how it's acting in the beta so I want to try to reinforce it as much as POS possible so all of these custom instructions are located right below this
in order for You to copy and paste it and put it into your custom instructions chat gbt but now we move into your task I want you to refine these custom instructions for your need specifically that first uh dialogue box is not going to be applicable to you make sure you have this updated for yourself from there take a look at the format and tone I have and feel free to adjust it from there go into chat gbt actually prompt it and see if you're getting the Expected results results that you want you're not going
to get this right in the first try it's a learning process in fact these custom instructions that I have linked below they may actually change and may not match exactly what's in this video as I'm continuously updating them to what fits Chat gbt best all right with that I'll see you in the next one all right in this video we're going to be going over gpts and this is a Customized chatbot that you can build on top of chat gbt that's customized to do things that either you want to do or you can make it
to where you can share it with everybody all right let's jump in and these gpts can do a whole host of things for looking here at the open AI page they have it as things like Tech advisor sticker Wiz negotiation any type of task that you could do with chat gbt and customize it you can do with this now chat gbt I think for security Reasons has really been pushing these gpts and you get to and access the GPT store by going in the sidebar and selecting explore GPT go ahead and close this sidebar in
the store you can then search for different gpts so let's search for our plugin on data analytics and right here it's at the top conveniently now the store is also broken up into sections they have a featured section trending section and they have all these different sections As well I find that the one that I'm really interested in is this research and Analysis they have a lot of different gpts for accessing research documents or also reading PDFs so some significant use case that you could potentially find yourself in another section that I find interesting is
this programming section and it has ones that can help you actually learn to code along with helping you with coding now one quick note before we get into Building a GPT we have gpts but we also have plugins so if I go back into that core chat GPT I can go in down here and select plugins the problem with this is I can select multiple different plugins and they can work together in here and that is a giant security risk for open AI so I'm speculating that Chad T is trying to get rid of plugins
and shift everybody to gpts in order to provide a more secure environment so I wanted to get ahead of this and I built a GPT Specifically for this course to help you answer questions not sure if you use it or not but here it is right here and let's say I wanted to ask it something like what's Luke's course about so it responds with a lot of the core things that we're going to be doing in this course specifically talk about hey it's focus on using chat GPT for Di analytics yeah of course then goes
into saying we need to understand the different types of data analytics including descriptive Diagnostic predictive and prescriptive analytics which is something we went over and even includes this little tidbit of image analysis for data interpretation and all of these things were provided to this chat bot so that way it knew what to talk about whenever you as a learner went in to actually quiz it and I think that's pretty crazy how we can customize it for this anyway let's actually move into building our own GPT we're going to access it through The menu going into
explore up at the top it's going to have this created GPT that's what we're going to select and then below it are the gpts I've created I've created this one for the course I've also created uh a chatbot to help build the exercis of this course so they're it's really helpful these gpts so I select create a jpt and it takes me into this interface which is a chat type interface on the leth hand side and then the preview on the right so as we're Building it we'll be able to test it out on the
right hand side so we can one use this chatbot via the create thing right here you can also go into the back end if you want and go and fill this all in we're just going to actually go through the create process so I prompted I'd like to build a gbt for providing details of my course the first thing it ask you is to give it a name and it says hey can we name it course companion I'm going to be deleting this anyway so I'm Like yeah sure next it gets into generating the profile
picture which it's popping up this right here I'm fine with this it's pretty neat that the AI is actually generating this and it's going to ask me if I can confirm that this picture is okay so after confirming that image now it's getting into asking hey it wants to know more about this course because it needs to know and basically fine-tune in this instructions so all these additional prompts we're Going to be providing it are basically like think of it like custom instructions everything I'm going to be riding into it's going to be used to
actually be output in that gbt that we built now I could go into explaining all about my course but I have one even better I have have the transcripts from my course so if I open up this one right here this chapter one this is all of the words that I've said in the videos uh of chapter one so this is a plethora of Knowledge to train this GPT on so I just select these transcripts and then go over here and import them in right now I'm finding that there's a limitation of only importing 10
files at a time hopefully open AI will fix that in the future but when make you aware of it so I provided this prompt of here are the transcripts of the course and they provide the details on how I want you to respond when asked a question now each time I prompt this model you're going to See that it generates this little loading page right here and it's going to go through and actually start training this GPT behind the scenes on what it needs to do and actually configuring it now pay attention to this rightand
side as it's going to be updating these even further for suggested questions BAS on what we just uploaded so after that now it tells me that course companion is now set up to assist me with this data Linux course And like I said it actually went through and updated the different example prompts for what they would expect you to prompt and to get out of this GPT anyway let's try it out by asking what's chapter one about anytime you're prompting this you're going to see this loading bar right here where it actually goes through and
searches its knowledge base and then actually Prov starts to provide a response from it now it's going through and starting to answer This and I'm already blown away by this because it's ping out hey we're going to go over in the first chapter options and setup it even goes into all the things that went into the course about difference between plus and Enterprise the cost of it then it also goes into the CH uh Chach BT plus setup so this pretty cool that it's doing this now you can also add different actions to this and
specifically you can do things like Json or yo request or send things out And actually interact with outside apps and a popular app to use with this is zapier which allows you to set up automations so You' be able to control that to be able to communicate with zapier to control different actions that you may want to actually control now that's just one example there's tons of others that you could potentially do but that's the most popular that I'm hearing about right now anyway we're not going to add any actions the last thing to not
Is this additional settings and it says Hey use conversation data in your GPT keys to improve our models you have to be comfortable with whether you want to share these things with open AI or not if you're not uncheck that so now that we're all done we're going to go through and actually save it and publish it now this one I just changed gpts because I wasn't screen recording and I accidentally deleted that last GPT but I feel like the instructions are still Going to be the same so we're just going to follow along with
this anyway you're going to hear save right here and you're going to have either three options publish two for only me only people with the link or public in this case I want to share it to the public and I'm going to click now confirm it's going to provide me with a link which I can share with my friends to access it or and I can go right into now viewing that GPT if I ever lose that link I can go here Into the menu copy the link I can also edit the GPT from here
and find out more about it then if you want to even delete the GPT CU you're no longer using it you can go in here and actually select delete GPT just like I did with our previous example while I wasn't screen recording it now there are a few limit with these gpts they're not necessarily perfect and sometimes they do stray away from the material and the content that you provide it to answer off of and it Requires you to going back into the GPT and better prompting it and configuring it to make sure that it's
providing the answers that you want so although I was able to set it up in a few minutes don't neglect the time to actually invest to make sure that you're refining it and build the model further to answer it how you want all right now it's your turn to set up a GPT if you don't have an idea mind already for which one you want to set up I recommend setting one up with Your custom instructions that you've come up with and then you can build this GPT based on those prompts that you've already developed
for this and it will be a model that you can potentially give to others for how jot gbt is responding to you they could experience this as well through this gbt all right with that I'll see you in the next one all right in this video we're going to be going into an intro into plugins to prepare you for this chapter so we're Going to be going on over how to enable and actually use them within chat and then also of example a few of my favorites so let's jump in so the first thing to
note anytime we want to use plugins we need to make sure underneath settings and beta features if we go to Beta features you have plugins enabled if not not going to see them from there inside the chat we can then access plugins by going down here and selecting plugins now one quick note on this this Chapter also includes a video on browse with Bing and also Dolly previously they were their own separate models and not included all within this core GPT 4 model but besides all that individually they're both very powerful and they deserve their
own individual videos and so that's why they're included within this plugins chapter because previously they were separated anyway in those videos I may refer to them as plugins just be aware that they were probably Recorded before this update happened with Chachi BT anyway jumping into plugins let let's look at some examples real quick let's say I had this PDF that I needed to analyze right now this thing is over 58 pages long and it has a plethora knowledge it talks about the field experimental evidence of the effects of AI on knowledge pretty important for us
so I Ed this plug-in web pilot and provided it the link to this PDF and say hey provide me a quick Overview of the contents of this PDF and then it provides a great little summary of this first of all it has that this was a study in which Consultants were given task and divided into multiple groups one with AI and one without Ai and it found that Consultants using AI were significantly more productive completing 12.2% more tasks on average and completed them 25.1% quicker and quality of work was more than 40% higher anyway this
is pretty cool that I was Able to actually get these type of insights out of this 58 page paper that quick also we're not just limited to reading PDFs we can do other things too fun things like this is a Meme creator that you can use to actually generate images and in it I had to generate a funny meme related to data analytics and we generated this one here with Drake pushing away pie charts but accepting barge charts which I can really Appreciate so how do we actually use these and install plugins well we first
go in and select it and you'll probably have your first time that it says no plugins are installed here I have a few listed and shown here because I've installed some the first thing you want to do is go right here to the plug-in store now this shows eight plugins in this case you can sort it by popular new all and installed I'm just going to go in and search so let's say I needed help With a presentation I'm going to go in and just type in hey I need help with a presentation and looking
at all these I know canva is pretty good so all I'm going to do is Click install within a few seconds it's installed from here I can exit out of the store and now I can go in and see that it's activated up at the top you can see that they have one of three enabled so you can select up to three if you try to select more it's going to tell you it's not possible I Never find myself limited by this number three so I'm going to prompt it hey make me a template for
a presentation I have to do for data nerds and as you'll notice it goes in and it starts using canva to actually generate and get these insights of what it's going to provide here anyway provided a lot of different results that we could actually use for templates for a presentation I mean a lot them are specifically designed for data nerds data visualization Basics Pretty cool now a couple limitations that you need to be aware of with these plugins let's go into a prompt of this what is the average salary of a data scientist and it
says the average salary is $222,000 which looks correct the problem is I'm using this plugin right here wol which is actually great at having a curated knowledge base of data specifically it has this exact knowledge on data scientists I don't want to rely On that large language model of chat gbt for this data piece I want it to use the plug-in so sometimes when you're using chat GPT you need to actually provide at the beginning using this plugin and then from there actually prompt CH gbt now this time it's actually going through using that wol
from plugin and we can see compared to that 122,000 this is a much different value for 2022 data that wol from data has access to the other limitation is This let's now say I wanted to make a meme out of this numerical data well right now I only have that wolf from plugin enabled and let's say I go in and actually enable now that Meme plugin and I say hey generate a meme about this and with this I also specify using the installed plug-in well it looks like at least at the time of filming this
it looks like Chachi BT isn't able to switch between plugins inside of the same chat I'd actually have to go in and Create a new chat use this meme plugin and then from there reference or provide that statistical data that I got from wol hopefully op fixes this soon in the future because I think that would be a useful addition or feature of these plugins we're going to be covering things like browse with Bing where we can do web browsing and actually look up current events but also things like the dolly 3 Model that allows
you to generate images for actual core plugins We're going to be covering things like Wikipedia to actually extract information from the web page plugins to read web pages or even PDFs like we did earlier all right now it's your turn I want you to go in and install a plug-in feel free to use anyone that I list here specifically you could try out that Meme Plugin or try to find one your own test it out see how it goes for you all right that we'll see you in the next one all right in this video
we're going to be Talking about browsing the internet with Chachi BT we're going to be looking at how I personally use it and also some other common use cases that I think you'll find useful so let's jump in so jumping right in browsing is located within the core model the most advanced one right now it's gbt 4 that's how you're able to actually search the internet so previously browse with B was what it was referred to and it was its own separate functionality within chbt So in some portions of this video you may hear me
to refer to it as the browse with being plugin anyway let's jump into a common use case that I frequently use chabby gbt for and I'm going to ask it what are some recent events that happened within the past week that I should be aware of as a data nerd content creator and it immediately initiates this browse withb functionality and starts going to all these different websites Gathering Information and then providing these results so it captures a lot of events that actually happened recently Microsoft actually just had an event and it Recaps it here but
the main thing that I want to draw your attention to is this right here where it actually provides a citation so that way if you're interested in that you can actually go and research what chat gbt pulled from this article to provide the insight to you so this is pretty great This is providing me up-to-date information with credible sources that I can actually go to and check out and verif myself now we have to be very specific how we actually browse the internet now let's say I want to ask who is the CEO of open
AI as I'm filming this video Sam mman was actually just fired as CEO of open aai although it looks like there in discussions to come back but right now as of this moment he's not the CEO so if I ask Chachi BT This it says the CEO of open AI is s Alman and if you noticed with that it didn't actually browse or verify the information there and this is very key whenever using the most advanced model of Chach gbt anytime you wanted to verify the results you need to specify to search the internet so
I'm just going to come up here and I'm going to actually re-edit it and I'm going to say search the internet to find out who is the CEO of open aai and it actually does The research this time and it looks like it's going into it let's see what it finds out all right and there it is it actually found out that Sam isn't the CEO right now and actually miror moradi is the interim CEO it even goes in to discuss how it came at the abrupt departure of Sam anyway the main point here is
you have to use some sort of keywords whether it's search the internet browse the web whatever it may be get it to promp chat GPT to actually Use this functionality to go onto the web to verify its answers this is an extremely important tactic at combating hallucinations let's move on to another use case here at prompted chat gbt find me some publicly available data sets on job postings from data professionals first it goes in and actually searching with Bing looks like it's visiting data. world let's see what data sets it gets and it looks like
we found some pretty interesting data sets we potentially use Let's actually check out this one here from kaggle although it's not my data set on job postings it is a data science job posting data set and it has an appropriate link so this pretty cool it also went into providing me some other sources that it potentially go to to look to see if I can find data sets now this browsing functionality does have some limit itations let's say I wanted to get some information on job postings right here on LinkedIn here in chbt I Provided
this prompt provide me with a sample of data analyst job postings from LinkedIn here and I provide the link now we provided me some generic results that don't really match what I'm looking for like I wanted the specific job postings from LinkedIn and it's just providing generic stuff I can tell this by the Articles it's going to because it didn't even go to the site that I asked to go to so I prompted no I want you to visit the link I provided and it says I can't Directly access or interact with specific Pages like
LinkedIn job postings through the link you provided and asking why not it goes into more of detail why not specifically it talks about my browser tool follows a strict policy that adheres to the robots. text file of websites which is a standard used by websites to communicate with web crawlers and other web robots so here I am at the robot. text file for LinkedIn and this is where Bots are going to to Read to find out if they can access as a certain page they look at this page right here on the right hand side
located after this backslash and it will say whether it's allowed or disallowed and it also specifies who's this applicable to in this case this is talking about a Google bot anyway I know that that URL that that job posting was at was at back jobs and when I actually go to contrl F for that I can see that it's basically disallowed specifically For running searches all right now it's your turn to dive in and test this browsing capability out I want you to search for recent events applicable to you try it out first without specifying
that ability to search the internet and see if CH PT does it then also test it with specifying search the internet you need to get really comfortable with specifying this of accessing the internet to get the most optimal results all right with that I'll see you in the Next one all right in this video we're going to be going over plugins specifically the the ones I use in order to save time and basically use chat gbt like my personal assistant in some izing things we're going to be focusing on three major types of plugins the
first is used to summarize PDFs web pages or even articles the second summarizes video content and the third helps summarize events people and places so let's jump Into this so the problem that I'm running into all the time is I have to do a lot of research and it requires sometimes reading articles like this like this one is 58 pages long and it talks about the effects of AI on knowledge worker productivity and quality honestly it would take me an hour to read through this thing and extract any quick insights out of it and this
is a perfect use case for chat gbt so if I go over to the plug-in store I Can actually search for any type of plug-in whether that's a PDF whether it searches web pages and in our case I know the name of this one this one's called Web pilot that I like to use and specifically I like it because it not only can view those web pages it can also use PDF and even data so this has been perfect for my need for using it for a multi ude of operations and so with this plugin
enabled I can just go in and copy the URL that this uh PDF is Located at and then from there go back into chat gbt and paste it in along with a prompt to get the insights I want so I prompted it provide me with a quick overview of the contents of this PDF and it tells me things like it's from Harvard and it's dated in September of this year and that the study was conducted with the Boston consulant group involving 758 consultants and they were given task and divided into three groups whether to be
using AI or no AI What they found was that Consultants using AI were significantly more productive completing 12.2% more tasks on average and completed 25.1% more quickly also quality of work was more than 40% higher compared to a control group so I'm really loving this study and it helps prove the fact of how helpful chbt is in our job anyway I want more data nerd stats so I prompted it provide me with more detailed statistics found in this study and provides me a Whole heat more and so I'm loving this now I actually found this
study a few weeks ago and I was so impressed by the results and what chat gbt provided for me I took all that information that chat GPT provided me and turned it into a LinkedIn post and this thing would have taken me an hour to compile based on just reading that article and then coming up with those insights with chat gbt I was able to do this in a matter of of minutes and this isn't limited to Content creation think of a research article that you need to provide a summary to your boss or a
colleague you could use chat gbt for this use case as well the next use case is on video content I prefer this form of content in order to be for my knowledge and learn more and so after I watch a video I routinely take notes and put it into notion in order to keep track of what I've learned well now with Chad GPT after I watch a video I can go to it and Have a provide a summary to me of the contents of the video so similar to before I go to the plugin Store
and type in something like YouTube I've tested a few of these but so far I'm liking this YouTube summaries one so I'm going to go with it similar to that last plugin I provided the prompt provide me a breakdown from this video on how Luke uses chat gbt as a data analyst and I just copy and paste this URL from YouTube into the prompt as well and it Provides me some key insights from the video since I want to turn this into notes I just provided that prompt turned this into some bullet points that could
save as notes on how to use chbt as a data analyst and it gives me this which I'm quite impressed with and I could save for later the last main use case is for searching things like people places or events so I'm just going to type in general knowledge and the one that pops up here is Wikipedia and Wikipedia I've Used in the past to research people places things and so I think this is a great plugin for that as well so with this plugin enabled I've then prompted it provide me with a quick overview
of the three most popular AI tools right now provide this in a TBL like format chat gbt Google's B and Bing and it goes in and describes all the different tools who developed it their key features and usage along we're providing some more summaries below it describing each one Of these AI chat bots so now it's your turn I want you to install these three major types of plugins that I recommend to save time now you don't have to use the exact same plugins as I do a key thing that I like to do is
go to this popular Tab and actually look through and browse what are the most popular plugins right now so you know experiment a little bit after you install a few go through and test them just like I did and see what type of results you get From it to get more familiar with how to use them all right with that see you the next one all right in this video we're going to be going over the wolf from plugin and this is one of my favorite analytical plugins now wolf from alpha is the core product
behind this you can go to wolframalpha.com and here you can actually access this technical Computing platform that allows you to put in Word answers similar to or word prompts Similar to chbt and you get out results and this is can cover a number of different topic areas such as mathematics Science and Technology society and culture just everyday life and so there's a lot of Statistics that this Computing platform has so in our case let's actually look at what is the average salary of a data analyst and with wilam it figures out the context of the
words you're saying in order to figure out the data analyst they Interpret this as a data scientist which is fine for this case and also you're able to see all the different statistic behind it people employed yearly change everything like this and this is based on real world statistics so this model can be used for a number of different use cases which we're going to get into so the first thing I need to do to get started with this plug-in is to make sure it's installed if you need to go to the plugin Store install
it and then From there make sure it's clicked and you can now use it here I prompted with that similar query asking at the average salary of data analyst and we get the same results so we can get this through chat gbt so here on wolf from site they have these four different topic areas that we have as far as my use case that I've found out of it um when it comes to things like mathematics I still find that the Advanced Data analysis plug-in still more powerful and just easier to Get to in Access
so things like math plotting statistics or algebra I'm going to still use that Advanced Data analysis plugin now when it comes to Science and Technology such as physics and Engineering I was a previous engineering major and I use this tool a lot and so I can take a lot of advantage of it in order to perform engineering calculations and get the results I need now I'm not going to go into all of these but this can be found at wolfrom Alfa.com examples and you can go into any one of these such as engineering and it
will provide you different examp examples of how you can use this you can get things like China's energy production you can look at electrical engineering questions control system questions it is just a multitude of questions that you could solve and I think this thing is so powerful somewhat related to engineering I prompted Chachi PT with this how much faster is a Cheetah than a human so it was able to use the wolf from plugin in order to find out the average speed of a cheetah and also the human and then it performed the basic math
necessary and found out that when a che us 2.7 times faster so pretty cool but when it comes to things like statistics that I need to have actual real world data and not potentially hallucinated data that chat chbt provided this thing comes in handy specifically on their section on society And culture they have this one section on demographics and social statistics in it you can get a number of different statistics around business age language demographics marriage you name it they probably have it so as an example I prompted chat gbt with this plugin what is
the unemployment rate in America so not only did it provide those statistics behind it the different changes oh and by the way it's up to date as of September 2023 last month but Also has visualizations like this that show it over time so we're not just limited to word data we can also get image data from this as well and then chat gbt apparently likes jokes as it says this could be a hot topic for your channel especially if you dive into the data Behind These numbers thanks Chad the last main topic area that I
get a lot of use out of or from is everyday life and specifically in this section on today's world in this I can get economy Data I can get leader data earthquake data weather data you name it it has it so here I prompted it who is the prime minister of the UK and it provides me not only all the name information and stats behind this person but also an image which I think this could be potentially more powerful than Wikipedia cuz now I can also do analytical functions with this as well overall this wol
from plugin is extremely powerful when I need to do quick ad hoc analysis And I need to use up-to-date statistics and demographics so this now comes to your task I want you to install this plug-in of wol and from there actually explore it explore all those different topic areas that we went over in this video and I do some comparisons provide some similar prompts to that Advanced Data analysis plug-in and see if you get any different results all right with that I'll see you in the next one all right in this video we're going To
be going over the dolly 3 plugin which was actually recently released from chat gbt this allows you to provide a text prompt to chat gbt and get an image and for this plugin we're not going to be going over best practices with prompting but also use cases that I use as a data analyst along with some limitations now to access this you're going to go within the most advanced model gbd4 right now and it's going to be included within this I'm going to recommend that you use this model anytime you're trying to generate images now
there is an alternate way that you can access it if you go into explore they have a gbt built right now and we can see by accessing it right here that we have Dolly this only allows you to access Dolly and does not let you access the advanced dat analysis or the browsing and I like to be able to jump around so I'm not going to really recommend this I just want to be aware Of it so let's jump into some use cases along with understanding what capabilities are of this powerful plugin let's say I
needed to generate an image for either a PowerPoint or maybe some handout material that can phase the emotion of a lost job Seeker that can't find a job so I prompt chat gbt let's generate an illustration of a job Seeker that is frustrated that can't find any jobs and I get this bad boy which is not too bad so my slideshow is not going to Be just one slide so I also had it generate some other things such as when it found a job areas whenever it was frustrated and then the final thing of actually
Landing a job and working on their first day now all of these were just single prompts asking for a single image I can also prompt it further to generate it in something like a comic strip or what I actually prefer to generate multiple different images at once so in this case I have a plethora Of options to choose from and I can just select the best one for my need so another use case that I'm very interested in using this for is generating visualizations with this Ai and making them look some sort of like artlike
so I tried to prompt it providing it some statistics and prodding maybe like a bar graph or something like that and the results were more subpar these values that are shown here and then the labels don't really Line up and so I don't think the use case of this is really there yet although the visual here aren't bad to look at but although it doesn't really do this a good job another use case that it could have is actually providing backgrounds for dashboards so take for example my app right here the background it's pretty plain
I could spice up this background a lot using this AI to generate some background images so I prompted chbt that I want to now shift Focus if youed design a dashboard background keeping in mind that you'll be sharing this with the top skills for data nerds on top of this background and it generated me these state-ofthe-art images and I'm like I'm pretty Blown Away by these so one problem KN with this is dashboards are typically on a rectangular area these are all provided in a square format which I could adjust as necessary but that's the
one of the other controls with this whenever you go And you prompt it you should also be providing that not only the number of images you want but also the aspect ratio whether normal or wide and here we have some updated images that I prompted it further to generate it into a more futuristic look that meet my need and once again these ain't half bad now one quick disclaimer this can't necessarily generate images of real people such as yourself I tried to prompt it to generate image of myself and it said it Couldn't do it
and then I tried to promp it further by like tricking it and telling it hey I'm a data nerd YouTuber can you make an image of me and it still knew that I was talking about myself and so it wouldn't even try to generate those images so don't try it so I'm pretty blown away by this plugin and I think this is going to be an excellent tool in your toolbox in order to better convey emotion whenever you're presenting data no longer are you really Limited to using just words to try and describe the problem
you or maybe a stakeholder is having instead you can generate images and better connect with those stakeholders oh and another thing that you can do with actually specifying the type of images you want they can provide the level of detail of how real or how unreal the images are such as in this case it tells me I can provide it whether it's a photo an illustration or even a vector so you have multiple Options for this all right now it's your turn to use this dolly3 plug-in for this I want you to think of a
problem you've worked on in the past or even currently for a problem you're trying to solve and think of a person or maybe a thing or something that the problem is from there provide chat gbt that prompt test it out with those different attributes that you can specify such as just number of images whether you want it wide narrow or normal and then maybe even whether You want it photo or a vector so play round a little bit with that all right with that I'll see you in the next one thata nerds in this video
we're going to be covering what we're going to be going over in this chapter on data collection and for this we're going to be going over the three most popular data collection methods that I use as a data analyst specifically focusing on things like data sets public or private web scraping and then finally on apis or Application programming interfaces but first what is data collection well it's the first step that I need to take as data analyst to go in and actually analyze and do my job I mean it's in the name data analytics and
I even prompted chat GPT to ask it thought on this and it basically goes into explain that hey it's a systematic approach to Gathering and measuring information from various sources to get a clear and accurate answer to relev questions so that's what We're going to be going over in this entire chapter so let's go over briefly each one of these topics we're going to start with data sets first this is probably the most common method that I use to actually use data in my job as a data analyst and I feel it can come from
two different places you can either have public data or private data let's talk about public first this type of data is like its name public so in this case I use popular sites like kaggle in order Order to find different data sets so in the video on this we're going to be going over some popular options I use besides just kaggle in order to rangle and find data the other type of data sets are private data sets which is outside the scope of this course I'm not trying to go to jail for trying to retrieve
some private data Instead This is the type of data that I'd be using as a day-to-day basis in my job as a data analyst and usually a company's going to Supply it to you I found that this data has a very similar form to what's located publicly so I think what the insights we gain from this can also be applied to your private job the next major method is web scraping it gets a lot of hype and there's a lot of legality behind whether web scraping is legal or not and really we're going to be
staying to the legal ones for our first web scraping exercise we're going to be scraping job postings from glass Door getting all of these data analyst job postings that are located in the search bar on the leand side and from there putting it into a CSV for this we're going to be using the Advanced Data analysis this plug-in which as we covered previously doesn't allow you to access any outside external sources so we'll have to provide this HTML file to it that comes from glass door the last method we're going to cover is around apis
or application programming Interfaces and this allows us to programmatically interact with servers somewhere and actually request data now unfortunately chbt doesn't connect to external data sources or external servers so this ability of running or using apis is not currently capable inside of chat gbt so we're not going to be able to do any of this for data collection here all right so that's what we'll be covering and I'm not going to lie I'm pretty stoked about this chapter Because I love this aspect of actually collecting data to be able to use for my job so
I hope you are as well all right so this moves into the task portion of this video I want you to actually get into chubbt and start with that first method here of finding a public data set I want you to prompt it in order to find any publicly available data sets for job postings feel free to also explore other uh areas as well but I'd like you to focus on job postings all right with That I'll see you in the next one all right in this video we're going to be going into what are
the top resources I use in order to find public data sets specifically looking at this we're going to be going into things like kaggle Reddit and even GitHub so let's get into it so this is a course on Chad gbt so I'd be a Miss if I didn't talk about this on how to find data so from our previous task in the last video you should have prompted chat GPT with the Browse with bang plug-in in order toine data sets I prompted it this search the internet to provide me with a list of data sets
on job postings for data analyst with this feature it provides four different data sets which don't look half bad and I can even dive into each one of these by the link that it provides like this one here has one on data analyst job postings on kaggle listed over 3 years ago I don't know why I didn't list mine but nonetheless it Provided a public data set looking through these different data sets that it provides I'm finding that only the first one is really uh geared towards that data analyst job postings it looks like those
two three and four options are just General job posting so it's not necessarily specific to data ad so a prompted chbd further perform a similar search to above for data sets but focus on using kaggle.com and it provides four different recommendations From kagle looks like only one of them is more of a generic result but the other three are related to data analysts or data scientists so that's a convenient segue into my top resource for actually collecting data and that's kaggle and by the way all of these that I'm be sharing today these four are
all linked Below in the description so here I can just go into kaggle.com sets and from there type in whatever I want to search for here I can scroll through all The different results I'm not just limited to the four that chat gbt is responding although I could modify the chat GB response to provide more but I sort of like it viewed in this area and convenient enough my data set is actually located at the top with these job postings so that's one method the next resource is awesome public data sets on GitHub and it's
a repository which has a bunch of contributors looks like over 157 that actually actively Maintain a data sets on different types of areas so I can see they have data sets on agriculture chemistry Finance GIS whatever I may need so if we go to like the economics section we could see all these different resources available for getting data sets they even have this convenient indicator right here to tell you whether a data set is being maintained up to date or not the third resource is Reddit specifically there's an entire subreddit dedicated to data Sets this
is more of a great resource if you need help finding a data set and you're not able to find it in any of those previous areas and you can come in here join the community and even make requests for finding or getting help with getting data the last major resource is well from Google and they actually have a data set search engine so I could provide it this search of data analyst job posting and it will go in and search all different sites across Google kaggle is one of them along with other ones as well
to find different data sets that may even be part of research or statistical documents it looks like my data set is located here along with some more General data sets as well but I think it's a good start at least all right and that's my top resources for finding publicly available data sets but now it's your turn I want you actually to dive into each one of these data sources specifically this Awesome public data set which I think is a great resarch is a little hard to search and navigate but chat gbt is perfect for
this you can provide chat gbt this hyperlink and actually go in and search this uh data repository in order to find any applicable data sets all right see you in the next one all right in this video we're going to be going over an intro to web scraping and we move on to a more Advanced one in the next video Specifically we're going to be focus on what is web scraping how to do it and then get into an example of actually inserting in a web page into chat gbt via the Advanced Data analysis plugin
having it going through into this HTML file that we put into it and extract out useful information and Export it as a CSV that we can use as data as a quick recap to last time you're supposed to use the browse with Bing function in order to search awesome public data sets For any data analyst job postings or related by job postings so I prompted chat gbt with I want you to search the following locations and see if you find any related data sets to data analyst job postings none are available provide a list and
description of data sets that may be of interest but not related I then provided the website for it to go to it went through it and actually searched it well lo and behold this location didn't have anything related Job postings although it did give some other recommendations like I asked I didn't find any of them useful once again I thought kaggle was probably the best source for this type of data anyway that's enough with the recap but first what is web scraping we need to clarify that that is the process of actually extracting information from
web pages now Chach BT goes on to Define this as a three-step approach first is a request so you send a HTTP request basically go To that URL then from there that response that you get back from it you then store it and then finally you actually parse that data and in this video we're going to be focusing specifically on that third aspect of web scraping of only just parsing the data and that's for a reason if we scroll down chat PT also provides that we have legal and ethical considerations to basically take into consideration
when we're doing this specifically a website May not allow this under their terms of service for a couple of reasons the main reason I find though is this rate limiting I could using Code make multiple requests to a website and potentially overload those servers that are hosting that website and that can cause a lot of problems for the website hosting this and so because of that they want to prevent this which I could understand say for example we have glass door right here which has a lot of great Job posting data on it and people
like me want this kind of data they could potentially spam the servers of glassor and cause this website to shut down and so because of this they try to prohibit it and so if I ask chbt hey I want to try and webs scrape glass store from data analyst job postings it provides this saying before proceeding it's crucial to note that web scraping May violate the terms of service of some websites specifically this one and it Also even talks about glass door may have anti-scraping measures put in place using things like JavaScript in order to
prevent us from web scraping it we'll go into more in the next video about how you can actually verify with websites if you can scrape or not but for this one we're going to stay away from that number one and two steps of doing requests and responses as then we're technically not in web scraping we're more of a manual data collection if you Will and this is going to keep me out of legal troubles as well so let's get into this example of Legally collecting these job postings from glass store well in order to do
this we need to get the code behind this website and this is in HTML so so if I right clicked it which I did there and clicked inspect I can see over here on the right hand side all of the different code that takes up to make this website I have the web browser of chrome and it makes it super easy to Inspect you're not required to have that if you have a different browser you can just go into chat GPT specifically I'd go with the browse with Bing and just ask it how do I
inspect the code of a website on blank in this case I put Safari and it tells me how to do it now for this we do have to dive into the code a little bit but I promise you it's very basic and we have to dive into the code because we have to be able to identify the elements so in Chrome here It's really nice because I can I can scroll over something and it will highlight that element so I know this piece of code is about the employer when I scroll here I know this
amount of code is about the job title scrolling down this is about the location and this is about the salary now each one of these are located inside of an element they have both div elements and a elements and these have things like class ID and even Target what I'm noticing is that we Could use something like the ID in each one of these elements and be able to identify it so when I look at the ID of the employer I see that the ID is job employer with some random numbers behind it when I
go to the actual job title it has job title number behind it going down location looks like it says job location numbers behind it for the ID and then finally for the salary looks like it has job salary with some random numbers behind it as well now I could Even go to that second job posting and see the same thing once again the employer has that same ID of job employer and then some random numbers job location has the same thing along with some random numbers anyway you get what I'm seeing here right there's a
a lot of repetition in that ID and we can use coding in order to extract this values from this now all of this HTML code here is a lot of code it even breaks down even further in each one of These things if I tried to paste this all into chat GPT which I did try it would exceed the limitations of the amount of tokens we can put into it so instead what I'll do is I'll just close out of this inspector here and what happens is anytime you can go and rightclick and then you
can use save as and what that is going to do is going to save save this file as an HTML file and here I have that HTML file saved I can even double click it and it Will load it in and reference that it's hey located right here on my computer so let's use the Advanced Data analysis plugin to actually extract these values out so I provided chat gbt with that file and then I prompted it with the attached HTML file extract data based on elements whose IDs start with the following partial identifiers and just
like we found I told it what it should look for for employer title location and salary cuz that's the information we Want to extract I even went on to expand that these IDs may have unique suffixes and gave an example for it I specifically called out on this use beautiful soups native Lambda function support for flexible matching I previously ran this query this prompt without that included in it and ran into a whole host of issues basically we just need to specify the python Library for it to use this to have the best results so
you need to include that finally at The end I said hey create a table with the extracted data verify the table has Data before exporting it and Mark any missing data fields as null export the table to a CSV file so Chachi BT went through and extracted the data from it using beautiful soup just like I had recommended and actually parsing it all together into a data frame from there they notice there was some missing records in one of them it cleaned that up and then loaded into a data frame and Then exported it into
a CSV and if we go back to glass door of what we were trying to extract we' expect to see the FBI want a data analyst in Washington DC of 40K to 110k that's a big range by the way that's a separate Point anyway when we get our CSV from chat gbt we have this the FBI a data analyst position in Washington DC and that 40 to 110k range along with all those other ones included in it as well and this all is pretty mindblowing right we just use Chad gbt To extract out of a
website it took me years in order to Learn Python in order to do this and we did this in a matter of seconds and this whole technique is not limited to just glass door right you could also collect data from any number of other sites such as Amazon here right I could go through and collect all the calculator data that I wanted but now it's time for your task I want you to go through and follow the similar steps that I did go to glass door search for Or data analyst wherever location where you want
to and then from there inspect those elements actually look to see what are the different values that you should be expecting to get from this after you're done with that export this and save this as an HTML and from there actually use chat GPT to extract that data out of this one note this prompt may not work on your first try as these things are very delicate sometimes with matching and getting the right results So you got to be really patience when you're extracting data from websites and with that I'll see you in the next
one all right in this video we're going to be talking more in depth about some advanced concepts in web scraping so in the last video you should have gone through and used glass door in this case and pasted it into that Advanced Data analysis plug-in in order to extract out all those different job titles for whatever you search for but technically What we did was isn't necessarily fully web scraping instead I'd call that more manual data collection full web scraping would be using those three steps here of requesting to the server to get the web
page we want a response back from it with the actual HTML contents and then three that parsing at all that information and extracting out what we need we technically only did that last step of parsing together because we went to that website manually and then saved It as an HTML file to to then put into chat gbt and we're going to get into that but we need to understand the legality of web scraping before we get into it so last year there was a pretty historic case where LinkedIn was getting data scraped from its site
from this company right here hiq and late last year they actually reached a settlement on it and so this is a great case to actually investigate to understand hey is it legal in what we're doing and it Turns out well it's still a gray area so it talks about how the case started in 2017 they went through all these different motions to try to figure out who was right in this scenario and all the ultimately hiq had to pay LinkedIn $500,000 and a lot of the settlement was actually confidential so although hiq appears to have
lost this case because that settlement was so confidential there's still a lot of gray area on the legality of this now full disclaimer I've also tried to scrape LinkedIn data in the past made a whole video on it and I ran into a lot of complications even beyond the legality of trying to scrape this data so if you're curious on learning more about how I did this what was the plan and everything that accomplished that check out this video so how do you check if you're allowed to actually scrape a website well most websites will
have this where you can go to the main domain so in this case glass Store.com and then add a SL robots. text and this says whether you can scrape it or not first it starts with this of a user agent and if there's an aster after it that means this applies to everybody visiting this site the next is the subdomain and it says whether it allows or disallows scraping on it so if we go back to glass door we can see that that subdomain is glore.com job and we can basically see for this subdomain that
web scraping is not Allowed another way to check this is by going to the terms of service or in this case terms of use and then actively looking for web scraping and funny enough I posted in chbt to go to this terms of use page and find out and investigate whether web scripting is legal come to find out it wasn't able to access the terms of use and when I look at the subdomain of this page aboutterms and go back to that robots. text I can see that it disallows it so Browse with Bing also
gets restricted whenever these robot. text files disallow it from scraping out that values to be able to Extra act and display in chat GPT so I just used good old crlf typed in scrape and it found this you agree that you will not scrape strip or mine data from the service without our Express written permission so we're going to stay away from doing this that nerds edor Luke here first up congratulations on Wrapping up this course second of all it's not too late to support this course and receive that course certificate check out this link
right here all right let's get into the course wrap up D nerds congratulations on finishing this course on chat gbt for data analytics I know based on even building this course it's been nothing short of hard work so you should be super proud of your work and it's really time to share what you've done with the world now following The end of course survey you're going to receive your certificate for completing this course and I highly recommend that you go to LinkedIn and you update it for this certificate if you scroll on down to licenses
and certificates you can go within here and actually upload your certific kit inside of here by clicking this add button and put it in to Showcase we can now fill it out for this course titling it chat GPT for data analysis putting me or my website as the Issuing organization today's date there's no expiration date on this put in the credential ID which located on your certificate and then attach the certificate itself now the certificate's going to get emailed to your email address that you register for the course with so that's where you're going to
find it also feel free to add these skills that you demonstrated during this course all right so the only thing left is to finish that end of course survey So I you can get sent this certificate once again congratulations on all the work that you did for this course super proud of you and hope to see you out there on YouTube all right later