[Music] how's it going everyone this video is going to be about time frame alignment we're going to talk about how to align the time frames together specifically how to go from a higher time frame point of interest to a lower time frame entry using the entry sequence now the first thing we have to understand is how I use top down analysis with top- down analysis I am focused on three time frames a higher time frame for bias a middle time frame for structure and a lower time frame for entry now with the structure of this
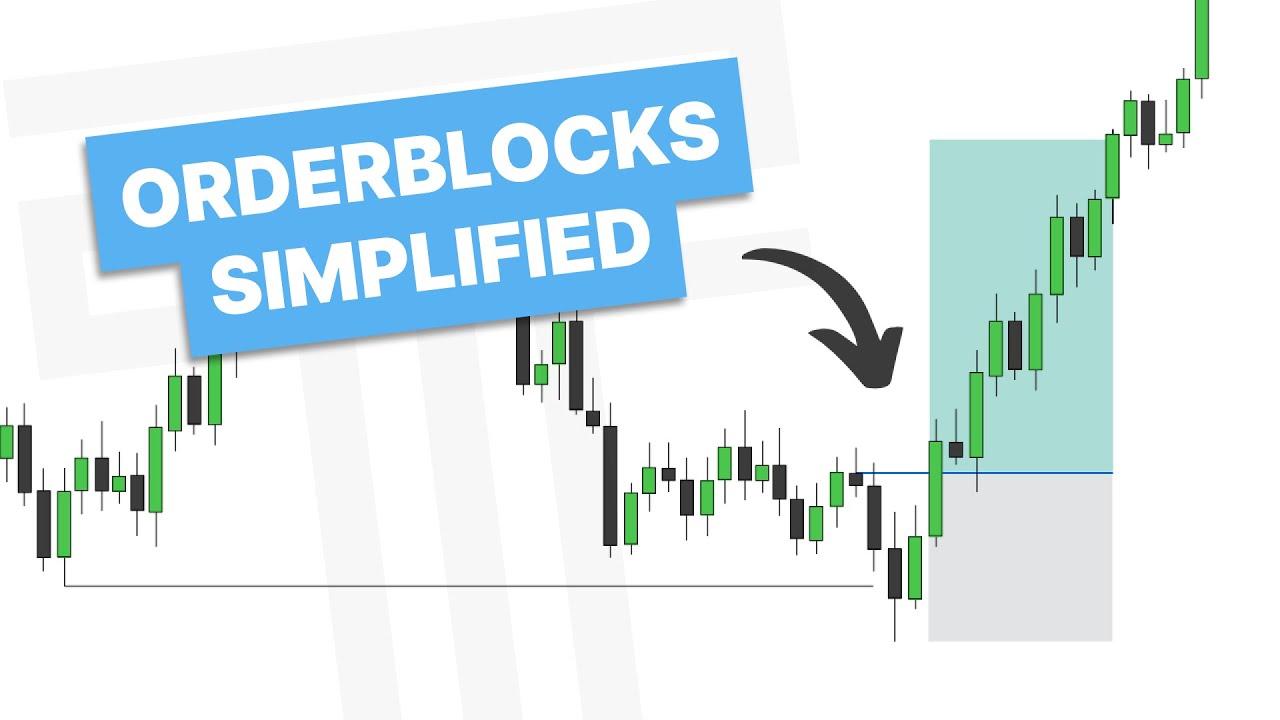
video I'm just going to be focused on the structure and entry and how to align those with a bias if you have questions regarding bias please leave them in the comment section below or check out the other videos regarding daily bias on my YouTube channel so in this scenario we have formed a swing point and I'm anticipating price to continue lower in the next day so with that bias I would then go down to my structure and my entry time frame now what do I look for on my structural time frame well I want to
be looking for one this to align with my higher time frame bias so if my bias is bearish I want to wait for either a change in the state of delivery or a market structure shift to allow for my structal time frame to be bearish which aligns with my bias now once this is bearish then I want to wait for a key level and what do I mean for a key level well that is either going to be a fair value Gap a high or a low or an order block so you can see here
price retraces into a fair value Gap retesting the change in the state of delivery so now that my structural time frame is aligned bearish and I have reached into a point of Interest all I need to do is wait for my lower time frame entry to align with my higher time frame bias and structure now after I have an order block formation on the lower time frame in which price moves from bullish and then now it is bearish now all three of my time frames from my lower time frame to my structural time frame to
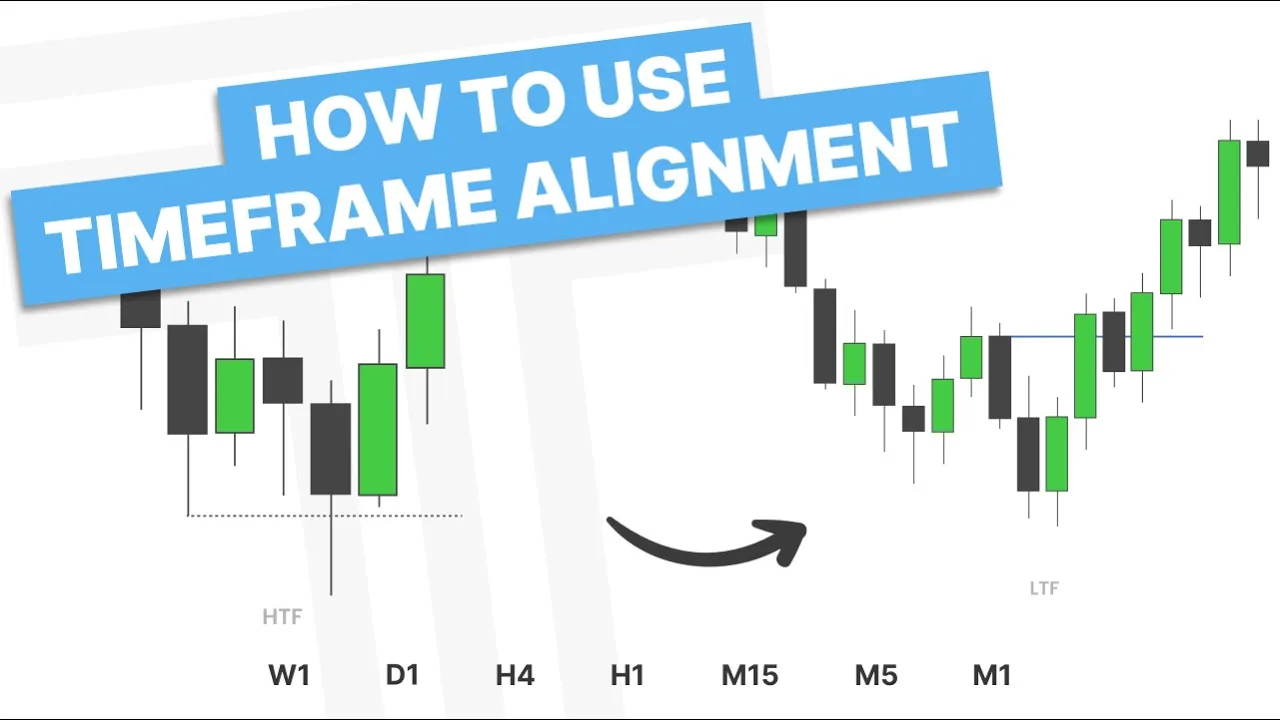
my bias are all aligned bearish and that is when expansion occurs so what time frames do I pair together I pair the weekly with the 4 Hour the daily with the 1 hour the 4 Hour with the 15 the 1 hour with the five the 30 minute with the 3 minute and the 15minute with the 1 minute now I align my bias the same way as I would align my structure so let's say I want to take an entry on the 5 minute that aligns with the 1 hour so now I have my entry time
frame and my structural time frame but where do I get bias well I want to see what aligns with the hourly so finding the hourly I align it with the daily to get bias so let's say I want to take an entry on the 1 minute that aligns with the 15 the 15 minute aligns with what the 4our time frame so I'd use the 4H hour for bias the 15-minute with structure and the 1 minute for entry so what does an example of this look like well you can see here we retrace into a swing
low which is a key level and a point of interest on our structure time frame so then using the time frame alignment I would look for an entry on the entry time frame using my entry sequence so for example if this is a daily chart what would this be an hourly chart because the daily aligns with the hour so let's hop into trading view for some examples so here we are with our first first example of time frame alignment if you are wondering what time frame I'm on or the asset I am on it will
be in the bottom right hand corner here so you can see similar to the example previous we have wretch into an old high so if I'm anticipating price to reverse off this old high or get a retracement entering a new phase of price delivery I would then want to go to its lower time frame pairing and wait for a reversal so using the weekly time frame I would then go down to the 4-Hour time frame down here on the 4 hour time frame I'd want to wait for a shift in Trend which I use a
change in the state of delivery which is the series of up close candles into that important level and you can see we have not closed below that yet so we haven't shifted the structure from bullish to bearish here you can see we are entering a consolidation and now we sweep out these highs to our left so with sweeping out our highs to our left here we have made a new high which then us using the series of up Clos candles into an important level this is now my shift in structure or my change in the
state of delivery now with this I could look to trade the reversal if I want now that the time frames are aligned or I could wait for another continuation entry so you can see here we get a retracement back into the range and once again now we have a new order block formation so with our time frames bearish I then could either look to take an entry here or go to a lower time frames to seek an entry there as well so what would that look like we can drop down to the 15-minute time frame
here because that aligns with the 4-Hour time frame so now down here on the 15minute time frame we have our 4-Hour order Block Level and so when price reaches into that we want to align our 15minute time frame with our 4-Hour time frame SO waiting for a change in the state of delivery here let's see if we can get it and then get on side with this move you can see we cannot close below it so letting this continue we now make a new high with making a new high we now have a new series
of up closed candles and now you can see we get this closure below so now I could anticipate since this price action here is now bearish I'm expecting this High to hold I could get on side with this move here now I can look to Target 2 R on my entry time frame and there you see we have hit 2 R so just to review what happened here if we go back out to our 4-Hour time frame we used a bias or a point of interest from the weekly time frame to wait for a 4-Hour
reversal once this 4H hour is in bearish structure I then can look for entries on the 4H hour chart to go lower or I can also use that to then drop down to a lower time frame pairing to look for entries that align so in this scenario we aligned the 15-minute bearish with the 4-Hour bearish and then the weekly bearish as well so dropping back out to the weekly time frame you can also see we put in a swing point there so we were trading an expansion candle short so going back to the 4our time
frame let's say I don't want to go to the lower time frame and get caught up what would that look like that would look like taking an entry on the 4-Hour time frame and using a 4 hour chart for my invalidation as well there you can see we would have hit 2 r or if we wait for a swing low to get taken out let's see what this looks like and you can see we hit our takeprofit there as well the main point I'm trying to get across here is if I'm entering on the 15minute
chart I also want my 4-Hour chart bearish and I also want my weekly chart bearish the whole goal of catching expansions is to have all of my time frames aligned in One Direction and that is when you get this aggressive expansion move so let's hop into a few more examples so here we are with our next example and you can see we are on the gold daily chart do we have a point of Interest or a reason to be looking for a setup and here we have 3 days of expansion into an old high so
looking for a new phase of price delivery if we're going to form a reversal that would occur off previous day high so let's drop down to the hourly chart since that is what aligns with the daily chart so here we are on the hourly time frame and if we are looking for a reversal off previous day high we want to wait for that to get swept out here you can see we sweep out our previous day high so looking at this series of up Clos candles into that point of Interest I am then looking for
that as my change in the state of delivery so now aligned with my daily point of interest of an old high and the context of price trading back towards the weekly open we now have aligned our hourly with our daily time frame now with this I could look to take an entry here or once again I could wait for the New York session or a lower time frame point of interest to be hit so you can see we reach back into this little fair value Gap and retest our change in the state of delivery so
now what would I want to see here well I'd want to see either a lower time frame setup or a new opposing candle or order block formation so you can see we don't close below there but now we close below here so what is this this is now a propulsion block because it is an order block formed off of another order block so I could either look to take an entry here or drop down to the 5 minute so down here on the 5 minute you can see where price retested our hourly order block here
and we have then Clos below the up Clos candles into that point of Interest so now the 5 minute is aligned bearish the hourly is aligned bearish and that also aligns with our bias so with all directions pointing down it is then set up for expansion so looking to get on side at the open of the new candle you can see here we start to get a little bit of consolidation but then we eventually expand lower hitting our to our take profit so just to review going back out to our hourly time frame we have
a reason to be looking for a short setup from the bias of expanding away from the weekly open into a point of Interest 3 days of expansion but most importantly I'm not going to look for entries until my lower time frame or my structure time frame shifts in that direction and then I'm looking to align my lower time frame with that higher time frame structure so in this case using a 5-minute entry I want to have a 5- minute bearish setup that aligns with the hourly bearish structure and you can see that is when you
get expansion condition so here we are with our next example and we are on the Dow 30 minute chart now we don't sweep out this low but we do have an smt so using the daily profile we have all these failure swings on the highs we're in the New York session we have an smt this is looking like a New York reversal setup Now with an smt I can use this as my lower time frame confirmation and once we get a closure over that that is then telling me that this low should hold and with
that being held I want to wait for a point of interest to be hit on the 30 minute chart before dropping down to my aligned 3 minute chart and you can see here we have formed a bullish fair value Gap so if price reaches into this on the 3-minute chart I then want to wait for the 3-minute chart to align with the 30-minute chart let's drop down to the 3-minute time frame so here we have that 30 minute fair value Gap and you can see as we let this play out here this is bearish price
action here and when we reach into the 30 minute fair value Gap I want to wait for this to align with my higher time frame which is the 30 minute chart bullish once we get the closure through the down close candles into the point of Interest also sweeping out the lower time frame lows here I can then anticipate this low to hold as we have aligned our time frames and set it up for expansion so getting on side here my stop on the low and then looking for 2 r let's see how this plays out
you can see we get tagged in and we continue to 2 R so the main thing I want to show here is we let the reversal form on the higher time frame right and then we have a 30 minute chart trending up so when we align the 3 minute chart with that 30 minute chart in a point of interest that is when expansion occurs so let's take a look at our last example here you can see that Euro USD is trending downwards here and what do we have we have price retracing into a fair value
Gap and sweeping out this high so viewing this as a consolidation if we sweep out the high of the consolidation what should we reach for the low of the consolidation and that is because we have accumulation manipulation and then I'd anticipate distribution so using this as my bias let's go all the way top down from a daily bias to aligning that with the hourly time frame and then aligning the 5 minute with that as well so here we are down on the hourly chart we have our bearish bias from the daily chart looking to trade
from consolidation highs to consolidation lows now to align our hourly time frame bearish to align with our bias do we have that confirmation we do because into that important level or sweeping out those highs we have this series of up closed candles and those were closed below so looking for the lower half or the mean threshold of that change in the state of delivery I want to see this area of respect to continue lower so as we continue in towards this London session you can see we start to retrace up into this point of Interest
so if we are going to have this area respect price and push it lower we'd want to wait on the 5 minute time frame to align with our hourly so we're tracing back into this hourly point of interest from the change in the state of delivery our fair value up here and sweeping out our high to our left here let's drop down to the 5minute time frame because we got this candle closure here which I could anticipate a reversal so down here on the 5 minute time frame we have aligned our daily with our hourly
now is our 5 minute time frame aligned not yet because we have not had that 5minute confirmation that price is beish yet so I have to wait for the closure through this series of up closed candles into an important level so now with this closure I could look to get on side here with a short setup with my stop on the high or wait for any retests so with this consolidation I'm not anticipating price to reverse from a consolidation are we respecting 0. five of this change in the state of delivery we are as we
have not closed over so looking for this to become a propulsion block do we get the closure below this and there we get the closure below this so now I would not anticipate price to trade to this high so I would look to get on side here with my stop over this swing High looking for 2 R now since I'm aligning my daily with the hourly and the 5 minute what I can do is I can look for this to have my target be hit or get stopped out but what else can I do since
I'm aligning these time frames together I can also draw targets from my hourly time frame so if I'm using my hourly time frame here I could then look for runners to go take out this low here this short-term low or to go reach for this low down here or the consolidation low on The Daily time frame and you can see when you align all the time frames together that is when you get expansion and there we go and take out that low so so I hope you found this video helpful if you did please consider
liking and subscribing and I hope you have a great rest of your day see you guys next time


![Intro To TTrades Fractal Model [Indicator & Settings]](https://img.youtube.com/vi/CqMIh-Vvhbg/maxresdefault.jpg)