now hooks welcome to volume one of three for mastering high probability scalping now this is a video that's going to be kept on my youtube channel and generally anything that's predominantly linked to just my youtube channel will have this intro and I'm going to ask you as the trading community to help me out a lot of times folks will take my content and re-upload it on their own YouTube channel and if you see that just let me know and I'd like to be able have that taken down I put the work into these presentations so
I'd like to be able to get to credit and the benefit of edie revenue off of it so if you see it just let me know and I appreciate it you don't have to be public about you can send me an email that inner circle trader at gmail.com I greatly appreciate it thanks all right so before we can I'm gonna ask you a question what is high probability scalps every one of us would have a different definition I'm certain of it but for me as I CT it's ten to thirty pip price wings now I
don't do a lot of this type of trading it's only recently because I've come back online and it gives me an opportunity to give a lot of set ups a lot of results a lot of things to study I guess it's you know probably one of the easiest things that get people excited and I know that going in and that's the reason why I adopted this style of showcasing my talents but I don't want you to think this is the only way you can trade the markets because it's not there's certainly ways you can do
it front end the day standpoint but I want you to know that what I teach has consistency and it also has the ability to prove right away that the markets are not in fact random at all they're very very organized they're very specific about where they're trying to get to intraday and even on a weekly basis and I would probably argue the point on even longer term basis but I just haven't made my precision that long term yet I don't think I ever will first thing it's not my cup of tea I like day trading
and short-term trading one shot one kills what I'm known for which is trading the weekly range so daily highs and lows are my specialty and weekly highs and lows are my specialty so I try to trade inside those ranges and I get the meet or hopefully the meet of the move not trying to get the very high or very low but I know where those parameters are and as long as I haven't met those extremes I know I have opportunity or life in the battery if you will all right so we're gonna be focus on
specific things in this presentation it's not going to be very long I want to keep them concise and short and again it's three volumes so if any questions come up by why you're watching this it's important every time you watch any of my videos have a notepad in hand turn the radio off go into a quiet room listen to what I'm saying because I'm packing 20 plus years of information and experience and very very small bandwidth so just write down your questions I'm quite certain there's going to be able to find the answers to them
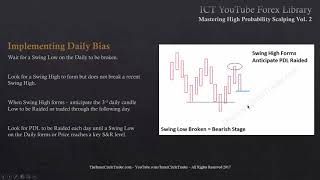
in future presentations for this one we're we highlighting the many opportunities in scalping the Forex I'm gonna be teaching you how to learn directional bias for higher timeframe institutional sponsorship and I'll explain what that is when we get to it and how to determine the highest probable times of the day trade and we're gonna be learning how to frame high probability setups for runs on liquidity sounds pretty fancy I know alright so high probability scalping now this is an example of a high probability scalp and this is in the dollar cad now right away some
of you are gonna be watching this video months and years from the time actually presented it trust me I tweeted live and people watched this actually be shown to them live ok this actually was a weekly high at the time of this presentation but I was calling them a weekly and daily high looking at this specific range everything that's in here is all that is necessary to know how to do short-term scalping intraday now because it's scalping there's gonna be times when these setups overlap with longer-term conditions now I'm not teaching one shot one kill
here I'm not teaching swing trading or position trading but I will drop that little nugget for you to study it's obviously found in my free tutorials you can find that on my website about inner circle trader.com is a free form you can join that it's absolutely free to get in there and you can watch all my pre tutorials that I'm releasing and you also be able to see some things I share in trading journal entry so you can give me an opportunity to speak to you by way of how I interpret and reflect on what
has been seen in the marketplace when I take action or if I take action and I lose you kind of get a vibe on what it is I've either felt or what I was thinking during the day when I was looking at the marketplace but a short term scalp here is a very simple approach to running out previous day's highs or previous day's loads that's all it is we're targeting by stops above the previous day's high or a day or two ago in other words we're always gonna be looking back the last three days okay
that's your there's your range okay you're gonna be looking back at the highest high and the lowest low in the last three days now you're counting today as they want so for instance at the time that's recording day of the week is Thursday so we would be looking at Wednesday's data and Tuesday's data very easy rules right so we know what the daily high and the low is on Tuesday and on Wednesday and we're monitoring what's going on intraday for today that would be Thursday of the time that's recording in November 2nd of 2017 now
what we're aiming for is exactly how banc traders trade now I know a lot of folks on YouTube claimed to know certain things and they use a lot of buzzwords but I'm going to show you something that no one else teaches because they don't know it ok but I'm going to show you in recent weeks since I've been back on social media everyone's noticing a tone or difference in my presentation it's a lot more concise a lot more accurate a lot more specific in nature and that's because I've spent the last 14 months with people
on a day-by-day basis and I've been able to share with them they're really openly about what I've learned over the last 24 plus years and it's not retail retail things get you into this business I'm gonna show you how to leave that stuff behind you and think institutionally that's like my tagline now I want everyone that follows me to leave that retail mindset because it's not going to help you in fact it's actually gonna be a hindrance or snare you're gonna find yourself not finding consistency at all and if you ask yourself right now are
you consistent if you're following retail stuff you're probably not using the things I'm gonna teach you in this 3 volumes you will quickly find consistency now I did not say profitability I cannot promise that some of you are going to break the rules where you gonna do things early so you're gonna do things late you're gonna risk too much okay and you're gonna do too many things at one time that's what's gonna cause the adverse effect and I don't want the credit for your wins and I don't want to credit for your losses so be
responsible it's only for informational purposes only all right so when we look at high probability scalping now this is an hourly chart on the dollar cad and what I've done is I've highlighted the individual daily highs and lows now it's important that from a scalping standpoint your time frame you're gonna be following Mon mostly is gonna be on the daily because it's gonna give you a bias and I'll show you how to do that it's really simple but for looking for liquidity you're gonna be using the hourly chart because it gives us a real nice
framework to see where previous day's high is or the previous high two days ago okay for instance right now at the time of this recording right over here this is Thursday's data in the far right of the chart okay and yesterday's Wednesday's data you can see the low it's been highlighted here and the high and then Tuesday's high and low okay so I want to draw your attention to the fact that we have traded below Wednesday's low today and we've also now traded below Tuesday's low so that to me is a significant point I'll talk
more about that in volume two but I want to kind of like bring your attention to it right now because it's going to be salient to what we see going into tomorrow's trading okay and you'll see all that in hindsight but I'm drawing your attention to it right now but each day daily highs and lows okay when it's bullish when the market is bullish and I'll show you how to define what's bullish and what's bearish not requiring any indicators no trend lines and moving average and the oscillator none of that stuff okay just using purely
price action only it's all that's necessary but when we're bullish on price action we think the higher prices are in order let's to say we come to that conclusion right away if we're bullish an institutional mindset is running liquidity on the previous day or previous days prior to yesterday's high okay and the reason why is there's a lot of speculations about capturing catching highs in the marketplace okay and especially if we have a day that saw a retracement the day before or two days ago lower that means there's going to be built in positions that
are short okay folks that I tried to sell short on the marketplace they're gonna want to try to capitalize on movement lower where's their buy stop going to be above the most recent high what's the most recent high yesterday or today before now why am I having you look back two days ago and include today's range because every swing high on a daily chart and every swing low is comprised and created by three individual bars you have to be monitoring these daily highs and lows because you want to be able to forecast eventually as I
teach you in volume three swing highs and swing lows before they actually materialize and start breaking down because sometimes the markets will turn on a dime and they don't give you the setup down with an outline in this volume one but this is the bread and butter easy way approach it's not going to give you a set up every single trading day and that's exactly what I want you to avoid trying to trade every single day now there's a reason to trade a demo account every day to practice the setups but do not try to
force your live account into a condition where it must trade every single day day trading is not every day trading so I want you to take a look at when price has moved higher every previous day it's high has been violated okay generally folks won't pay attention that simple phenomenon it's a very simple approach but it eluded me the first six years of my trading I didn't see this element to trading until about six years into my bond trading now I started as a Treasury bond trader and SP futures trader those were my two markets
of choice either I was in spoo's which is SP or I was trading the Treasury market or bonds I was rarely ever in both because they are basically diametrically opposed think of it like the dollar index and a foreign currency okay I didn't do anything else I didn't trade agricultural anymore I just focus on those two pairs or not two not pairs but I focused on those two markets why because I didn't need anything else if you are watching multiple pairs right now stop just do it for one month humor me for one month I
promise you if you give me one month of your time and focusing on one currency pair it doesn't have to be one that I suggest pick one any one of the majors that's crossed with a dollar I promise you you will learn you'll learn more by doing that than trying to do all these other things with other different pairs if you're trading multiple assets and you're now starting to learn forex stop trading the other asset classes and just focus one month with me use the information I give you and again I guarantee you you will
understand price far better than you ever have before and it can be very simple approaches so you got me and want to guarantee there so now if we're bullish what we want to be thinking about is where price is going to be drawn to okay that's called the drawl now when we look for where the markets going to reach for in terms of bullishness it's the previous day's high or an old high that's gonna be in the form of buy-side liquidity or buy stops so the market will draw up to that level okay and dip
into that liquidity pool where there's existing buy stops for instance if you were selling short your buy stop would be above the current market price at what level whatever the previous high was that's what the books tell you right so if your stop hit what that becomes as a market order to send a buy order right away in as a market order so your buy stop transforms into a market order to buy at the market and the market is going to be driven up there from an algorithmic standpoint I'm not going to get into that
here and I'm not trying to convince you of it just just suspend your disbelief if you don't believe it's algorithmic and in terms of how the markets move think of it as just you know supply and demand if it helps you right now okay but when price goes above an old high it's going there to force buyers to come in at a higher price instead of buying low okay they're forcing buyers to buy at a higher price so smart money has at some point accumulated a position at a lower price and they're driving price up
to formulate an opportunity or condition for participants to have existing orders or real interest at buying at a higher level to be forced into or out of positions okay and that's all it's it's all basically framed on now I'm framing this whole discussion tonight on the basis of looking for by side liquidity or by stops or running out by side liquidity pools okay so when we're bullish from an institutional standpoint what we're looking for is the draw the draw is above where market pricing is now in the form of cold highs now we're using for
scalping we're using previous day's high for a very simple little day trading approach to capture 10 to 30 pips inside of one trading day now every pair out there does this several times a week not every day does one singular pair create this condition so it's important you have that in your notes do not anticipate this forming every single trading day in say for instance the euro dollar okay if you don't see a setup in the euro dollar then once you understand the setup okay then you can go into other pairs like pick for majors
okay maybe a cross and that's like your little basket of currencies and you go through that I'm not inviting you to go through 28 pairs okay don't do that but you can find a setup that I'm going to teach you tonight every single trading day to practice on if you have learned what's going to be presented to you in the first well you know the first second and third volume completed once you understand that and you've practiced for at least a month then you have my permission to go into including for majors in a cross
and then start looking like that and you'll see that there is a set up every single trading day but it's not my invitation or my goal to inspire you to try to trade every single day don't do that my hope is that you learn to find one or two trades like this per week and then force yourself to be disciplined did not trade any more because every time you trade you're opening the invitation to lose money and the closer you get to Friday's close with a losing position it's just gonna make your mister make you
miserable over the weekend and it's nothing worse than having made money in the beginning a week or sometimes during the week and then go in one more time and lose it going in the weekend it's frustrating I've done it many many times over the last two decades you don't want to do that it's avoidable once you make money in your demo account okay I'm not promising you make them live funds that could because I'm not licensed to do that but I'm teaching you how to practice in a demo account that's all I'm doing here if
you use this information and a live account it's on you win or lose 100% of the responsibility is on you okay so in this hourly chart we are looking at two timeframes the daily which gives us our bias as I'll indicate and the hourly what sets up where the markets going to most likely reach for for the draw okay that's what it look what it pull is so if we're bullish again we're looking for an old high to run to that's it very simple strategy nothing more than that okay so now we're looking at a
daily chart and I want you to look at the patterns I have here because it's gonna be very important to understand what these are because it's gonna give us the context to define when the market should be bullish and when it should be bearish over here in the left-hand corner this is a swing low and this is a crude depiction I didn't add any color because I just want you to think about the overall pattern itself now either any one of these three candles can be up or down close in nature in other words it
can be a bullish candle or a bearish candle all three of these it does not matter okay all we're looking for is the generic formation of these three candles okay one having the lowest low and a higher load to the left and higher low to the right it's only three candles or three bars needed to find this pattern okay if you look at Mt 4 there's a little indicator you can click on it's called a fractal and I really wish they would have never named that and it's a Bill Williams thing I'm not a fan
of Bill Williams material I'm not trying to be disrespectful but what I'm teaching you is what I learned from my mentor Larry Williams I think he's proven himself he's made millions of dollars and it's documented you know he's took 10,000 to over 1 million dollars in 12 months and you can see that on the rapid trading contest website you can see he's no one's even come close to his his record but his approach to teaching market structure starts with this simple concept of a swing high and swing low so when we see a swing low
it's three bars or three candles okay once that forms what we in the old days will call that would be a ring low okay because we didn't have charge we had to really just write that down on a notebook and the lowest of the three candles or the lowest in recent week or the month we would we would put a circle around that that number okay on our little binder and that's the way it was it was it was like that in old days so we would know that that wasn't important well why because it
had a higher load to the right of it and the higher load to the left of it okay so when we see this formation on a daily chart okay what we're looking for is this to occur after this is important you need to anticipate this forming after a swing high has been broken now probably just took a huge leap forward and probably lost a few of you so let me say it again we are only really interested in looking for daily swing lows after a swing high which is a high that has two lower highs
on either side of it okay in other words we've got one daily candle or bar with yesterday or the previous day's high being lower than today's and then tomorrow's day should have a lower high okay so notes this is what we're seeing a three bar pattern you wait for this to occur in the price action and if price trades through the swing high you are now on bullish alert you wait for the swing low the form what you have done is you've waited for institutions to get back in line with the momentum on a short-term
basis and the algorithm once it creates that swing low again after the swing high has been broken momentum is now bullish and you're waiting for this short-term pattern here when that happens your focus is going to go immediately to the high of this number three candle and I mean I mean I mean number of these candles so that way we can track it and know what we're looking at so this is for directional bias these candles now have numbers on them and it's always moving left to right number one candle number two cannon number three
candle what we're doing is we're watching once the daily swing low forms we want to see the high be traded through one day number four okay once day number four does that we know that day number five we can be looking for a run on previous day's high liquidity you can be aggressive once this formation occurs if we open below number three's high you say Noren Doren London or New York if we're below that low if we have a condition that presents an optimal trade entry you can go along and look for a run on
number 3s high for run on liquidity above number threes by stops that's a little aggressive and I'll give you rules to do that in volume number three but tonight I want to keep it very simple and very very Elementary so as a recap what we want to do is we want to see a swing high this formation form and we see that here okay we see a swing high it has a lower high to the left of it a lower high to the right of it and we want to see it trade through that high
it does it here right here on this large wick candle when that happens we start looking for this formation on the daily chart it happens right here okay we have a long whipped candle it has a higher load to the left of it a higher load to the right of it and the very next day we want to be looking for runs on previous day's highs for a resistance of previous day's high it's going to give them in the retail world the false sense of security that the previous day's high is gonna stop price and
it's not going to so we can see how markets that have this condition have a tendency to continuously move higher each day look at how the previous day's high is violated to some degree okay and then when we get these inside days and I'll talk about that and volume to inside days are going to be important but not so important for the first of all you might just want to understand the basic premise on how we get the directional bias and why the swing highs and swing lows are important so each previous day's high is
taken to some degree every day has a varying amount of pips and again I'm not trying to promote the idea of knowing exactly how many pips you next week's gonna have or three days from now it's not important there there'll be tools and things that you learn in volume 3 to help you get to that but for now just be content with learning the general rules of how to determine whether the market is bullish or bearish if you do this okay this is not mentorship level bias but it is a real quick down and dirty
approach and this is actually how I learned it the first time in terms of finding basically daily momentum it's all of this and it doesn't require you to have any kind of momentum indicator to do it no moving average and none of that stuff okay you can read it just from price so again simple rules are we want to see a swing high broken to the upside okay we see it here with this swing high so now we have momentum on the bullishness pulls back wait for a swing low deform that's this pattern here and
then we start watching number 3s high okay we want to see number 3s high be violated in this case here we see it violate right there with this kind of like of a indecisive candle and in the very night today we see what it opens it trades down and then blasts off through the previous day's high now when you have that type of move it can happen the following day and it does it opens okay and trades above the high a little bit that in itself as a scalp there's nothing wrong with that little bit
of a move but I want you to focus on finding one good set up so if we have a move like this chances are I would probably look at another pair only because I understand the conditions and I know the set up so it may have burnt itself out on one pair which I see if it's a big move if it's just a marginal move then they'll probably seek follow-through on the next day and maybe the next day after that so we have it again here it opens okay trades down a little bit and goes
higher running out the previous day's high again and again that's the trade that's all is it's a scalp we are not trying to get the weekly low at this we're not trying to get the daily low and holding to the close all we're doing is looking for an opportunity to run a previous day's high or a high from two days ago that's the context that's the premise behind the system that's the method okay why does this work I'm sure you probably asking yourself when you know why is this why this does have any validity to
it when bank level traders are working they are trying to turn over liquidity okay and what I just taught you is the draw okay the draw is previous highs and previous lows referencing daily highs and lows banks target those liquidity pools more than anything else in forex don't take my word for it go through your charts and you'll see that's exactly what goes on when you have things that are bearish okay we're just you know flip the script for a minute we want to see price trade below a swing low once that occurs then we
start waiting for a swing high to form why are we doing that because we're waiting for a retracement it's gonna go to an overbought condition we don't need any critters to do that or derive that information when we have this short term high here or swing high form we start watching the daily candle number three and we want to see it trade through that low if it does we know that we are in bear territory and we're probably going to see each previous day's low be violated and that's the setup that's condition and that's an
it's seen here okay we see a swing low broken here and then we wait for a swing high to form that's here we have a high with a lower high to the left of it a lower high to the right of it we wait for this number three candles low to be taken out it does it here so now what we do is we target a run on this candles low it opens trades up creates the high today and slams them okay that's it that's the setup it doesn't doesn't have a whole lot of sexiness
to it but I'm telling you right now it's got a whole lot of consistency to it and a lot of you probably don't have any consistency whatsoever or what you're looking for and this is a very easy bread-and-butter approach now again I am NOT trying to package this in a every day approach for one individual pair this works in stocks it works in futures it works in bonds it works in just about anything they can trade so when we have this momentum on a daily chart and we know we're either bullish or bearish it stays
that way until we get a break in opposing market momentum I'll give you an example what that would look like here we have a swing low form and then price comes down and breaks that swing low that upsets the momentum at this point we have to see a short-term high be broken okay a short hi has to be broken and then we have it here we have a high with a lower high and a lower high to the right of it it's broken to the upside here so when we have that now we go back
into cycle of looking for a swing low swing low forms here we have a candle to the left of it that's high or low below in the middle and the next candle is up so we want to see price trade through number three candles hi it does in fact do it here and we trade through the next day running the previous day's high and it continues that cycle again okay so all we're doing is monitoring a break in the swing highs and swing lows giving us a bias on the daily chart why am I looking
forward on a daily chart because momentum that begins when the daily chart tends to occur and be lasting for at least a few days it could be two to five days in duration so if we have a mentum working one side higher or lower it tends to stay in that direction for a period of a few days and that's all you need to have a really good scenario for short term trading intraday scalps so again in summary when we're looking for the swing low this is only being stalked or looked for in price action until
we see a short term swing high being broken when that happens then we start looking for this pattern okay for daily swing highs this only is being hunted or stalked in price action after a swing low has been broken that gives us a break in market structures but it's basically giving us a definition of and then afterwards it's going to be a retracement and when we see that retracement occur with a swing high we know that we can start looking for sells running out previous day's lows when we see the swing high broken and we
find a swing low form later on we know we can look for kendall number 3s highs to be rated and look for the buy stops to be ran out or intraday scalp that's a very very simple approach is very easy and if you're not understanding it just watch this video again I promise you you're probably over complicating it and it's not necessary so I'm going to focus our attention on this little segment of price action here in the shaded area and we're actually gonna walk through on a narrow a chart and look at the framework
of each one of these respective days and how it targets liquidity runs on previous day's highs okay folks we're looking at the a lay chart at the beginning of that shaded area to show it on a daily chart for us CAD and I want you to just see these lines down here okay these are just delineating the ICT kills them and the red area is delineating specifically aiming at around two o'clock in the morning to four o'clock in the morning New York time everything I say in terms of time you're gonna have to translate that
into your local time relative to New York time okay so if I say two o'clock in the morning New York time wherever you're at globally just get yourself a clock set to New York time and then look at that time in reference to your local time and you'll be able to decipher what it is you have to do and make the adjustments I do not want to get into conversation about time because it's very confusing for me admittedly I've done this many times in the past and erroneously said something and confused a reader or viewer
so it's better for you to just do the work in transferring and converting your local time into New York time okay so London is basically two o'clock to four o'clock in the morning that's the sweet spot or the best time to anticipate a higher load of form and the New York is going to be seven o'clock in the morning to ten o'clock in the morning we'll just give you a nice little one day like that it can be refined and defined in my tutorials but for now just for the sake of this method just use
those times all right so we have our beginning of our shaded area when we're looking for bullishness as defined in the first part of this presentation and I want you to look at how price moves running out previous day's highs okay and here's a previous day's high right here and I'm going to try to do this as as quick as I possibly can and keep things moving along but the a high on this particular day here you can see one to start of this candle here it starts and immediately runs through a little bit doesn't
go by much but then it eventually trades through it here that in itself this little move here that's actually a trade it doesn't seem like much it doesn't feel like much but that's a trade now you're probably because your eyes looking at in the benefit of hindsight you're gonna look at this high and this move down and say well that's what I really want to capture if you're going to think like that about everything I'm going to show you in these tutorials I'm not gonna be any help to you okay because what you're gonna be
doing is trying to have perfection and I can't promise and I don't promise perfection at all I do provide you resources that's going to help you get better at your price action analysis and that's the only thing I promise okay so we have a low here and a daily high and the expectation is we want to see the high be ran out we want to see the the expectation of moving through this high why because there's going to be liquidity a bit above that high why I'm not going into it here just trust me the
banks make runs on previous day's highs and lows and if it's bullish they're gonna be targeting previous day's high okay so the way we frame our setups is we use our FID and we find the lowest bodied fortunately the candle that's going to be this open here and we drag that up to here okay why he just jumped off the level I wanted to have it on sorry you I want on this candle right here because it's gonna be the highest body before this little retracement okay and at this point we're gonna be anticipating because
it only this briefly violated the previous day's high we want to see a retracement our mind is waiting for it to trade lower okay once it trades lower we're going to looking forward to go down into the optimal trade entry okay that's our price pattern it doesn't do it until after this little movement up now on a smaller time frame we could probably see something in here that's an optimal trade entry but I'm going to save that for volume too but in here I'm giving you the big setups for your scalp setup okay so using
the our chart we're gonna see it here and we're gonna be targeting previous day's high now even this day when it trades down to here we could be targeting a run back to previous day's high and now what have we included we have a higher high here in the same day so intraday we have a higher high and we have previous day's high both of these conditions are candidates for run on liquidity okay so we have this one and we have this one so as price trades down here we want to anticipate a movement higher
to run to this level which it does here and eventually back to this high here which it doesn't do until this candle here notice that price trades down in the bodies of the candles respect the 79% race own level okay back up to this high this is why I say you want to take profit okay at old highs and at your first scaling here this is target one you can take profit there notice it never takes the high out yet has to retrace all the way back down to precisely the seven times it hurts me
again then rallies through taking out intraday high previous day's high and again two days ago okay this is your run on previous day's high liquidity now this candle on a daily basis its high is here same scenario in here it rallies up takes out that high which again we're gonna have to see that on a lower timeframe we're not going to do it in this volume but as it runs through we want to see a retracement okay we have the bodies of this run here why am i using this one because it's the most dynamic
recent rally and we want to use it on the highest body open or close which is here price trades down into the sixty two percent recent level right in here we're do be targeting previous day's high which is here and we also now we have an intraday high here so we have two reference points to look for so we're anticipate the banks making a run on both of those levels they initially it's this one okay so on the next day it trades back down again giving you another opportunity to go long if you were trading
here you're outside of the kill zone okay I want you to notice that every time that we create signal and setup if it overlaps with one of these colored levels okay or lines that makes it high probability if it's outside of one of those shaded time windows it's less favorable it doesn't mean it can't eventually move to profitability and your demo it just means that it's far more likely to occur if it's occurring during one of these shaded time windows okay so and again the blue one here is the New York kill zone and the
red one is London so we have a setup here it trades back down into optimal trade entry here and it does so at the time of New York okay so New York and London both have an opportunity to create a buying opportunity London will give it to you that you probably got stopped out same scenario unfolds for New York New York explodes runs through previous type days high of two days before and previous day's high here runs right through it that's the trade and it's over it's done there's nothing else to consider there's nothing else
to worry about the trade is over okay so now in here we've had a couple examples nice little payouts not barnburners not Grand Slams but bread-and-butter setups just using one pair in the course upside inside of a week we have nice little setups and it's given us a really good opportunity to target a logical level which is the previous day's high and under the context of a retracement to a logical level which is the FIB using a framework of bodies two bodies in terms of the swing highs and swing lows and also as a quick
note habits in your notepad easy way to go for what swing high and what swing low I draw my fit from I use session highs and session lows so whatever the highest high and low was during London and or New York I used those reference points and then I just used a body's either the open or closed whichever is the lowest for the low point of the fifth and the high point is whatever the highest is open or the close inside of the high okay and that's all there is to it each each new day
you're waiting for an opportunity for it to retrace back down into what would be otherwise standard optimal trade entry which is a 62 percent 70 percent trade level but targeting previous day's highs now notice once we hit this previous day's high here the mark goes into some of a of a consolidation now we do get a little bit of a run here but not to the degree where we can really brag about or go to great lengths to justify it we do have a nice retracement here okay and I want you to take a look
at that because when we have a retracement of a day or so that usually puts the cycle back in rotation so we have a retracement here price comes back down to the 70.5 level which is a sweet spot o te okay and it's happening at the time of New York so that's a good scenario we could see a buy there but look it rolls over into the next day in London it hits it again so your stop would never been hit but you're holding on for a long period of time so this is where it's
gonna stretch your patience as a scalper which is the reason why I like being short trying because I know these are the conditions it's most likely gonna happen hits the 62% shape 62 percent retracement level rather and once it hits that in London then it explodes what's it reaching for previous day's high it runs through that with no resistance whatsoever and blows through previous day's high back here okay so really nice little opportunity there and whenever you see a full day's down close that's like a big red neon sign say start following me especially if
you're in a bullish scenario that markets primed to have an optimal trade entry long and start running out previous day's highs okay on this one particular day here price moves 3050 almost 70 pips or so okay really really quickly and this is all mostly inside of one hour big explosive price move here and that was seen on October 5th and this continues on going through price action and when we have scenarios that present themselves with the highest form of probability and not seeing any breakdown on a daily chart it gives us framework context and specifics
about what we're looking for when we're looking for it kill zone what price level Osmel trade entry what are we targeting previous day's highs or the day before it so yesterday's high or the day before yesterday's high that's what we're targeting more bullish very very simple approach nothing more to it than that I'll amplify it in volume 2 and I'll wrap it up with concise more or less a trading plan in volume 30 hopefully you found this insightful until next time we should good luck and good trading