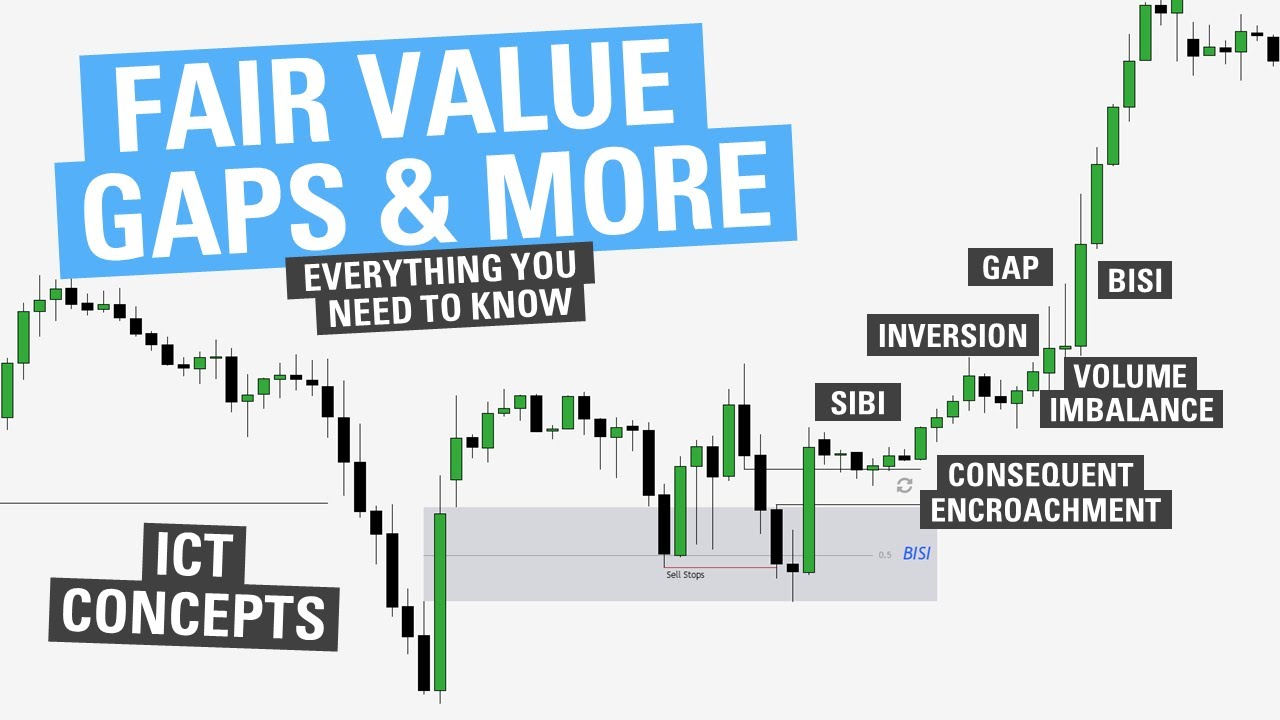
[Music] how's it going everyone this video is going to be over inversions we'll first hop into a PDF to go over what inversions are we will then quickly discuss the consequent crment of fair value gaps and how it is used before talking about old sies and bisses and how they can be used on the buy side and sell side of the curve so let's go ahead and get into it so here we are in the PDF and the PD array we are going to be focused on for this video is a fair value Gap now
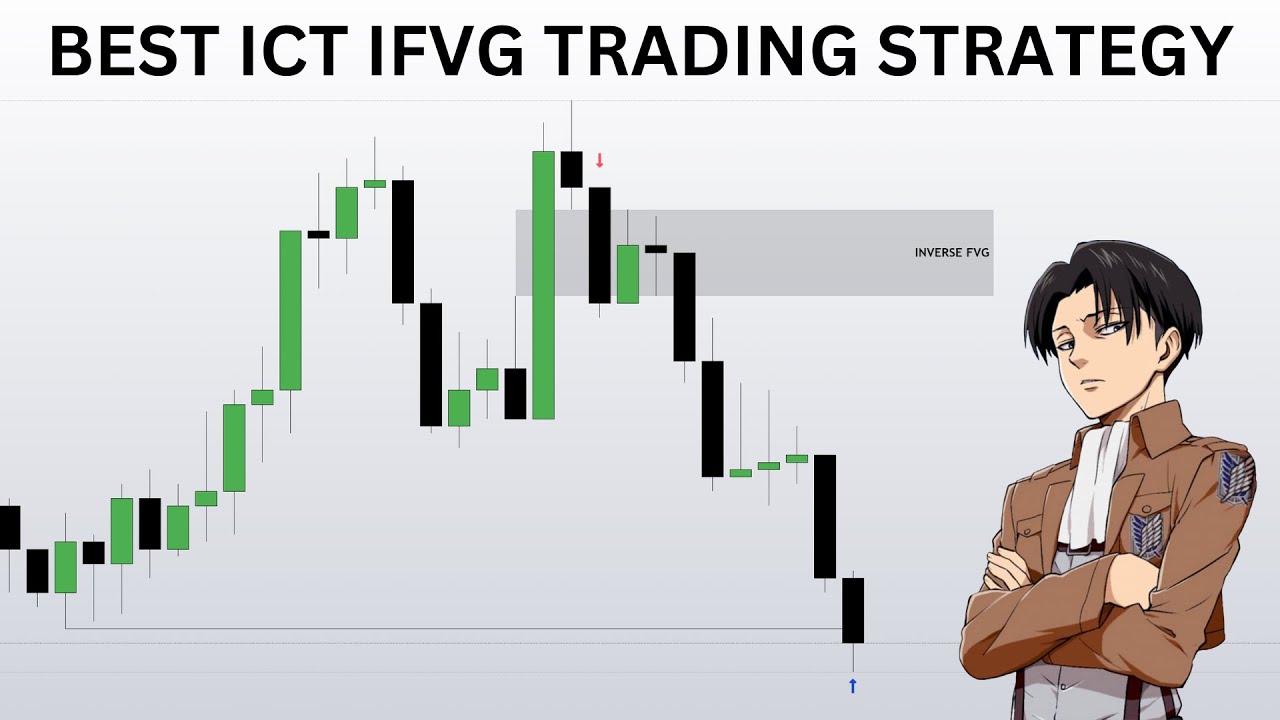
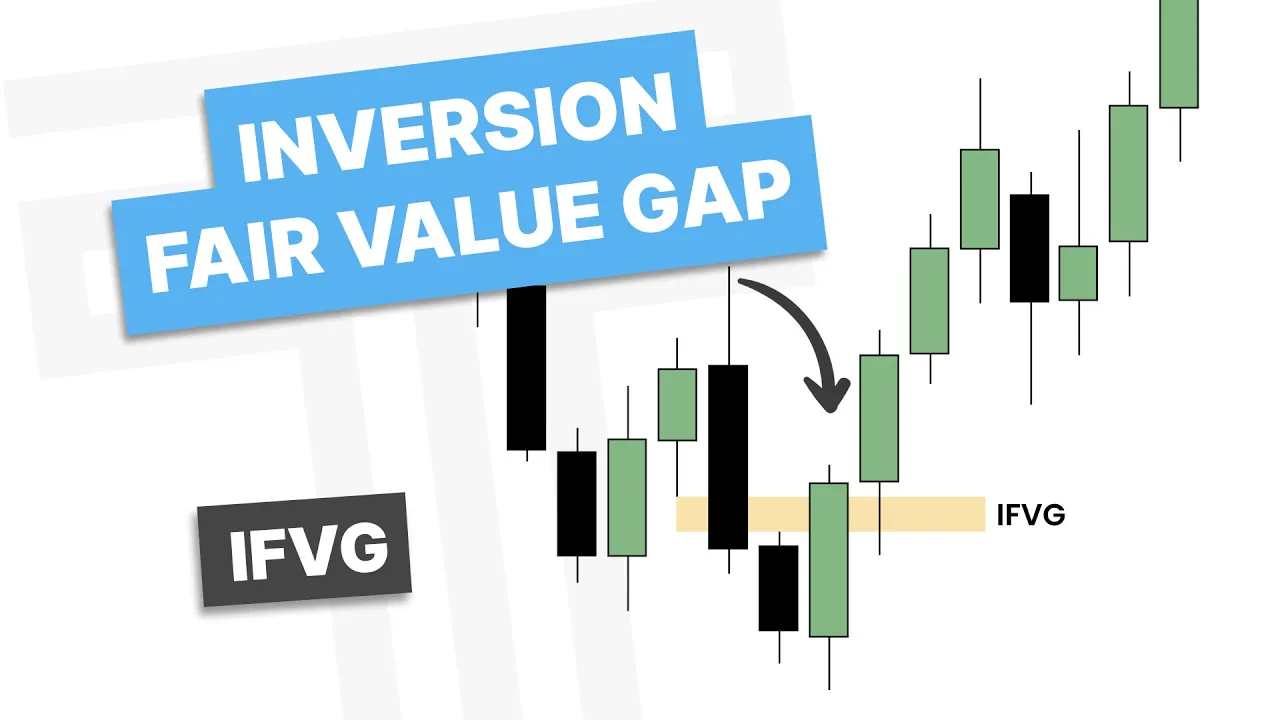
if you don't know what a fair value Gap is I suggest you click the link in the top right corner to watch my video on that but for a quick reminder a fair value Gap is a three Candlestick pattern which the first candle's low does not overlap with the third candle's high or when the first candle's high does not overlap with the third candle's low so now that you understand that what is an inversion an inversion is when a fair value Gap and in this case a CBI or a bearish fair value Gap gets closed
over or disrespected so if we continue ahead here you can see how the next candle closes over this civy which creates an inversion now if we extend this out we can expect price to either retrace into this zone or just move higher so you can see it retraces into this zone or the old fair value Gap it respects the consequent encroachment and then continues higher so what is the consequent encroachment the consequent encroachment is A5 or 50% of a pair value Gap so I can mark this out by just taking a fib from this high
to this low and getting 50% now what I want to see with consequent encroachment is if price comes in and respects this area then I anticipate it to move higher now if we go back and price comes in and violates this area then I can anticipate price to move lower and you can see here how it closes below the fair value Gap and creates an inversion so let's hop into the charts and find a few examples of inversion so here we are with our first example and we we have Euro USD on the 60-minute chart
and we have an hourly sweep right here so let's drop down to the 5 minute chart so here we are on the 5minute chart and if we're going to be watching for an inversion we want to see a busy or a bullish fair value Gap get disrespected so marking out this bullish fair value Gap here we want to see when price closes below that so you can see we didn't close below it yet but right here we closed below it so now we can anticipate price to reach back back into this area or continue to
sell off to where these lows down here so there are a few ways to look for an entry here I can look to just market sell this or I can look for a retest of this inversion my stop above an opposing candle and then looking to Target these lows so let's see how this works out gets tagged in you can see now fair value gaps are supporting price lower and there we hit the lows so now let's drop back out to the hourly chart to see what this looks like so you can see we just
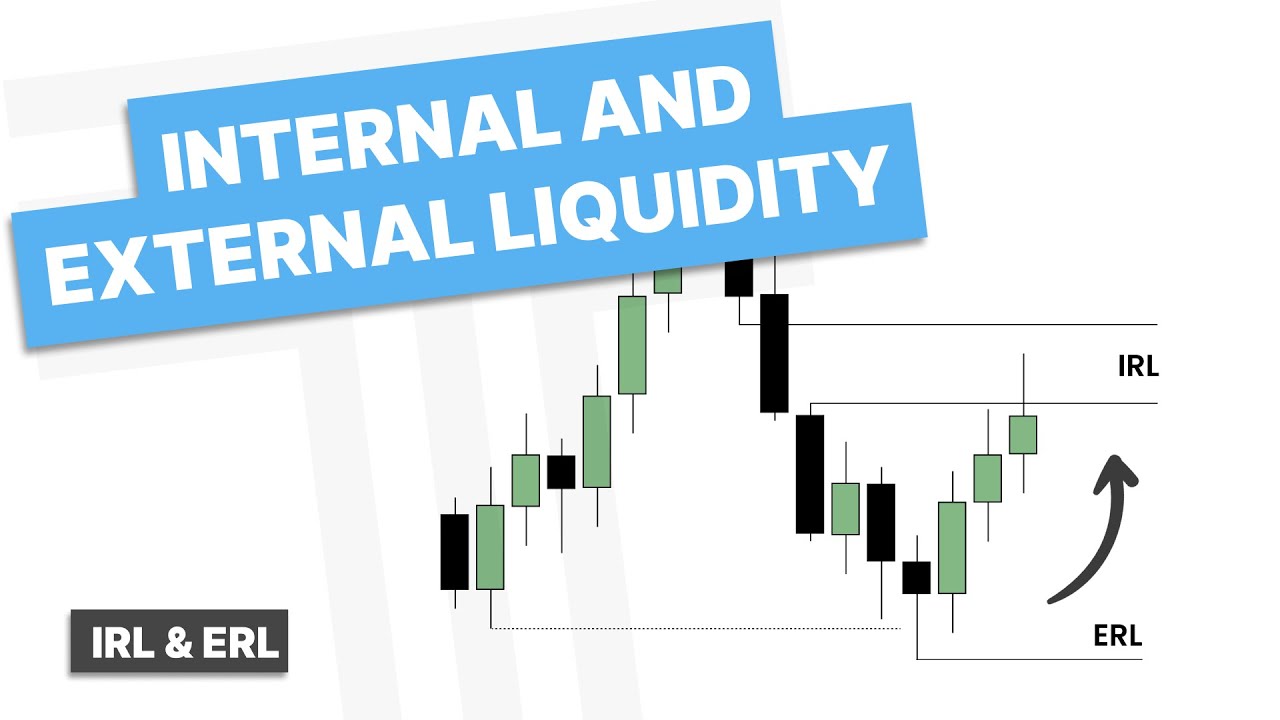
took these buy stops and then ran to the other side of the range sweeping this sells side liquidity now if you watched my previous video on external and internal liquidity what do you notice after taking these lows and closing back inside well we sweep external liquidity and what do we have resting right here internal liquidity so this gives us a framework to trade in the opposite direction so let's drop back down to the 5-minute chart so here we are on the 5-minute chart you can see after we took these lows we Consolidated and created a
range price tried to move higher you can see we wretch into a fair value Gap here and then price closed back lower before making a new low now what do you notice about this new low we swept sell stops here and then created a fair value Gap when price trades and closes over this fair value Gap it creates an inversion now if I'm looking to take an entry off this inversion with my stop on this low and targeting the midpoint of this fair value Gap that's about 1 R which does not meet my requirements for
entry so how can I adjust my entry well what I can do is Mark out the consequent encroachment of this civy here and by marking that out I can look to take an entry at the consequent encroachment of that old civy or the inversion let's see how this plays out so you can see we hit our entry get this placement out price respects a fair value Gap and continues into the hourly civy so let's go ahead and look back out at the hourly chart to see what this looks like so back out here on the
hourly chart just to review what happened we had buy stops resting above old highs price traded above those old highs then closed back inside the range giving us a narrative to trade lower to sell side liquidity a 5minute inversion was used as price traded lower here after sweeping sells side liquidity or the sell stops resting below old lows price goes from external to internal liquidity and a 5minute inversion was used once again so here we are on inq 2minute chart and you can see we get an aggressive move down and then back up so looking
for this to be a retracement I would want to see follow through to the upside however we do not get that after sweeping these highs we can't close outside the range and we just fall back in So with consolidation I'll be waiting for manipulation or I'm waiting for external range liquidity to be hit so I'm waiting for this low or this High to be hit so you can see price does respect this fair value Gap and then trades to sell-side liquidity price cannot displace out of the range and you can see we get another sweep
there and then we have a CBI resting here now if we want this to be an inversion we want to see a close over now we are closing over the consequent encroachment which gives us a hint but I want to see a close over the CBI for it to become an inversion so letting another candle play out we do get that close over so then looking for a return to this CBI I'll have my stop on this low and then I'll be looking to Target the other side of the range for partials or full take
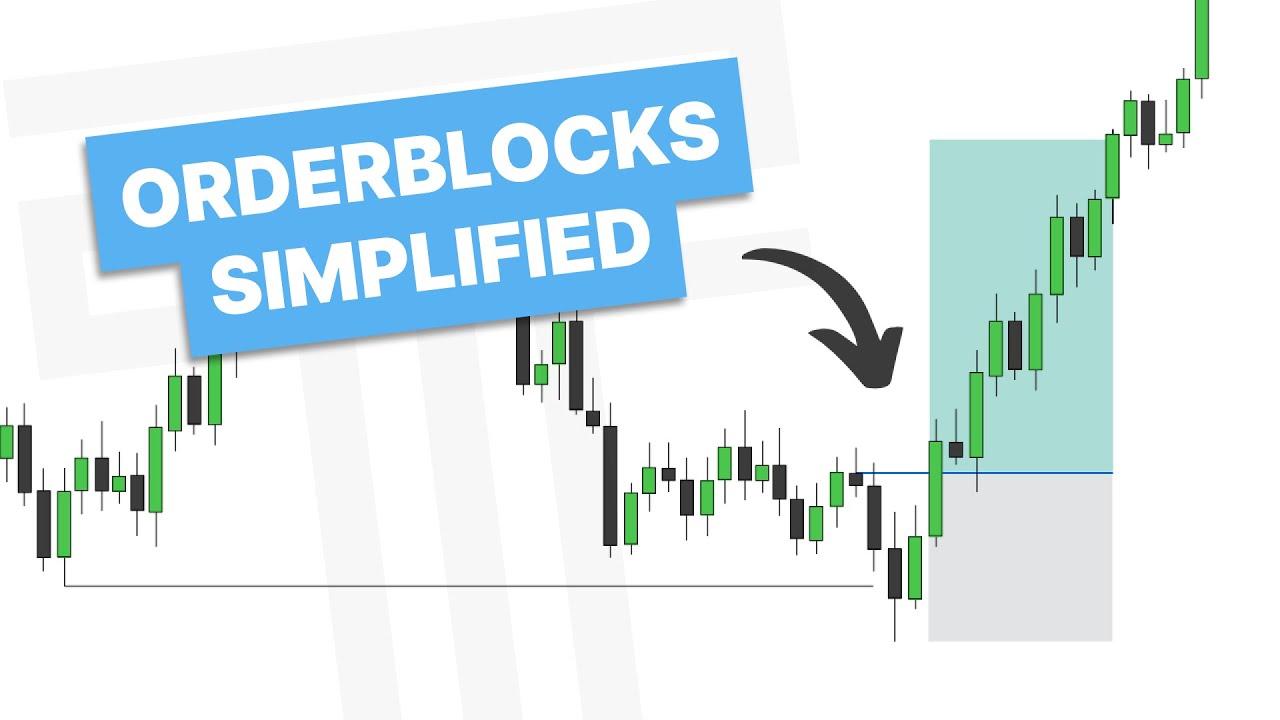
profit so you can see price returns back into that inversion and here now I want to see it respect that consequent encroachment and you can see that it is and there we go we sweep one more time before displacing over validating this as an order block price then respects that and continues higher to make a new high so we are going to continue on with this example and talk about how we can use inversions within Trend so you can see we're trending up here so making a higher high we'd want to see a higher low
put in and what do we have well we have an order block and then an order block off that order block so a propulsion block so let's see what happens if price retraces there it does and if you notice what does it do when it retraces to this propulsion block it creates a fair value Gap or a Cy now that price closes over it this is an opportunity to get an entry into the trend so let's see how this works out you can see it's pretty choppy but we do end up making a new high
so now we made a higher high are we going to make a higher low well we have a fair value Gap here so if we're going to make a higher low here what do we have we have a civy so if we trade over this we can anticipate price to retest it or at least go higher here we close over that make a higher high now we'd want to see a higher low you can see we test this inversion and then continue higher and the one I just missed is we have an inversion here if
we close over retest it and continue higher so you can see if price is trending in One Directions those opposing PD arrays that fail are actually opportunities to get into that Trend let's go ahead and go back into the PDF to learn about how to use old cities and buses so back here in the PDF we can use old fair value gaps to look for reaccumulation or redistribution so for example here we are on the cell side of the curve here we have the smart money reversal change in the state of delivery the inversion Market
structure shift all of that now we are on the buy side of the curve what I can look for is Old Fair Value gaps from the sell side of the curve to support price higher so for example we have an old fair value Gap here that gets traded above and then is used as support to trade higher so let's go look at a few examples of this so here we are on gold daily chart we have equal highs resting above us and let's mark out our cppy right here now if we're going to to have
a smart money reversal I'd like to see a close over this Cy and a close over these down close candles and we get both of those so now I'd like to see a short-term low be put in so we do get a shortterm low so now confirming our smart money reversal do we have any old fair value gaps on the cell side of the curve we do so dragging that out when price closes over this fair value Gap it can then use it as support to move higher here you can see it reaches back into
this old fair value Gap so I'd anticipate it to move higher and there we get a sweep of that buy side liquidity I hope this example shows you how you can use old fair value gaps drawn to the other side of the curve so for example an old cby drawn to the buy side of the curve or an old bissy drawn to the cell side of the curve and use that for reaccumulation or redistribution tion now if you found this video helpful please consider liking and subscribing and I'll see you guys next week


![Nvidia CEO Jensen Huang delivers keynote at CES [FULL KEYNOTE]](https://img.youtube.com/vi/Fym9gcDMgVY/maxresdefault.jpg)