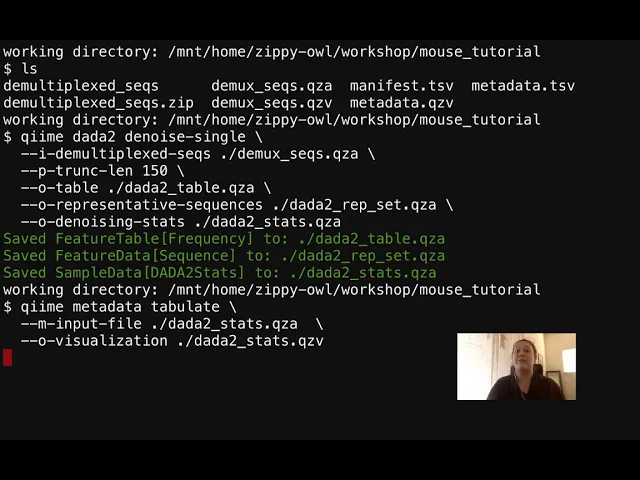
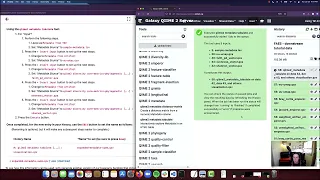
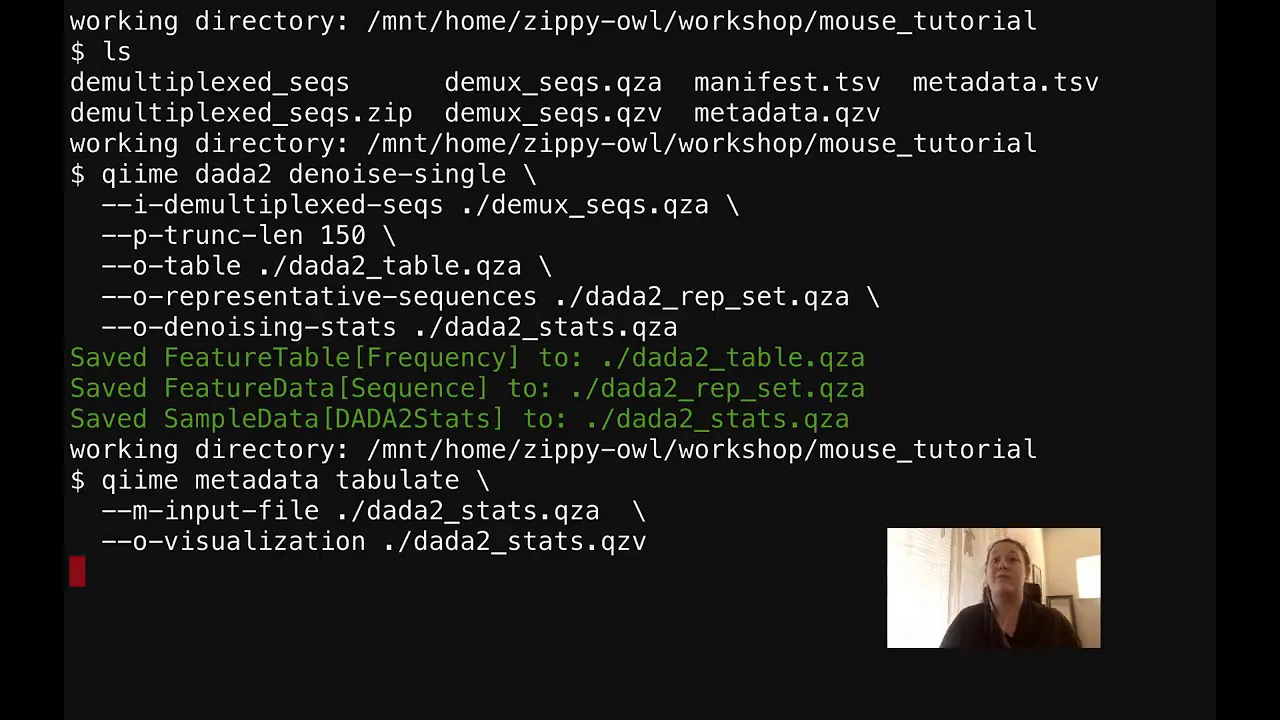
Hi all! In this section of the tutorial, we are going to perform some sequence quality control and denoise our data. First we will run qiime dada 2 denoise-single right here, and then we will run qiime metadata tabulate.
So before we get on with the fun of this tutorial, let's talk about where we came from, where what our last tutorial was. So in our last tutorial, we had imported the QIIME 2 data, and at the very end of our last tutorial we were looking at the demux_seqs. qzv file and we were kind of talking about what it showed us.
So the first step of denoising is actually figuring out where to truncate using that visualization. So let's make sure that everyone has that. So first I’m just going to ls in my working directory of the mouse tutorial -and you should see this .
qzv visualization, and if you don't see it then maybe you should return to the importing and demuxing part of the tutorial, and then come back to this video because that's a pretty important part of this tutorial. So before we jump in to actually doing some quality sequence control and denoising our data, why do we need to do this? So we need to denoise our data because there's noise in general in our sequences that come from sequencing and sample collection, and this could affect our analysis or how we view the composition of whatever we're looking at.
So we need to make sure that the sequences that we're looking at are representative of what we're trying to analyze. So in this section of the tutorial, we will look at where it's appropriate to truncate our data, how to denoise our data, and how to interpret a dada 2 stats. qzv file.
And at the end of this tutorial we should have good quality data, that doesn't have too much noise, that allows us to move forward with the QIIME 2 pipeline. So first we need to look at this visualization in order to kind of see what the quality of our sequence is and where we theoretically should truncate. So we need to go to the location where we can get the visualization, so we're going to go to workshop-server.
qiime2. org/zippy-owl, which is my username. So make sure to enter your username.
So I go to my mouse tutorial directory and here you can see all of the files that we could see over here just slightly differently -just organized differently, visualized differently. So I’m going to go to my . qzv file -we have one called the same thing that's a .
qza file so make sure you go to your . qzv file- and copy that link address. Then I’m going to go to QIIME 2 view, and boom!
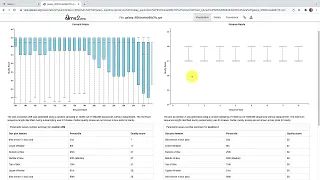
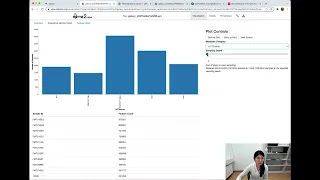
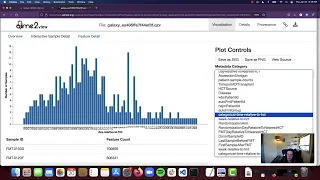
We're going to provide a link from the web and we're just going to paste that little guy in there. So looking at this, it tells a lot about our demux sequence summaries but we want the interactive quality plot. So I’m going to zoom in just a little bit here so we can see this plot a little bit closer up.
Maybe that's a little too much. Okay, so here's our plot on our forward reads, this is a single end read, so we don't have a reverse read. And we can kind of see that our data is pretty good.
There's no real hard and fast rule for how you should truncate your data, it's mostly a judgment call, but it has to be a rough estimate of the good data. What I’m trying to say is it has to be relatively good data so that dada2 doesn't get lost in all of the noise and the bad quality. So a good estimate is probably a median above q30.
We can see by the box plots -I’ll zoom in- you can see that the by the box plots here that the fair amount of our data has a median above q30, so that's really good. There's no major drop off around here, which typically happens with data, so that's really good. Since our data is overall so good, we don't really need to truncate at any specific length.
So we will include all of this sequence length in our analysis. So we will truncate at 150 sequence bases. So let's go to this tutorial again.
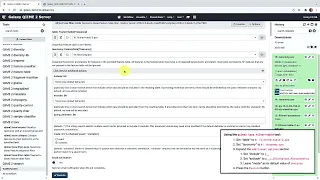
So here is our dada2 denoise-single. So now that we've decided where to truncate, we're going to run this. It takes a while to run, so as it is running I’m going to discuss what we've inputted and what we'll output from it.
But at first I’m just going to run it because it just takes a minute to run. So we got it all in there, press enter, okay. So first we inputted a dmuxseqs.
qza file. This is a zip file that contains each read so when we denoise these reads we'll still know which read belongs to what sample. We didn't use the parameter trim left, but it is an option for the qiime dada2 denoise, and what it does is it trims out the primer if the sequence still has the primer in it.
But our data is emp protocol, which means that it doesn't have the primer still in it, so we didn't have to trim left. We will output a table which has sample ids and sample features, but has no interest in sequences. So this table right here will have sample ids and numbers of features but it won't have any sequence information.
This representative sequence file -believe it or not- has sequences. It's an output of the amplicon seq variance and all of the corrected sequences are given a number called a hash. So whenever the same sequences are found, it produces the same hash.
This is a way it's easier to refer to the same sequences because that hash is so much shorter than referring to them as their entire name. And then lastly, we will output denoising-stats dada2_stats. qza, which basically tells us how the denoising step went.
As you can see by our next step, we're going to do qiime metadata tabulate on that dada2_stats. qza. So that file is actually a metadata file, so we'll use metadata tabulate to visualize it and it can be used later on in the pipeline as a metadata file if you wanted to do that.
So we just got all of the outputs that I talked about. You can see that these are feature tables and this is sample data. So the next step we're going to do is we are going to run metadata tabulate.
So we are going to run this and then we'll get a visualization of that stats. qza file. So it didn't take very long and now we have that stats.
qzv file. Awesome, so now let's head back to that visualization of the workshop server. So basically I’m going to refresh because this page doesn't auto-refresh when you get new sequences, so until I refreshed we didn't have my new sequences that I had just created.
So we are going to want this dada2_stats. qzv so I’m going to copy this address link, I’m going to go to QIIME 2 view, and I’m going to get a file from the web. So then I’m going to paste that in there, and it's going to create the visualization for me.
We're going to be able to view it. So let's discuss what this is saying. So these are all our sample ids, our unique sample ids, and then these are all the reads from the sample ids.
So it's telling us how many were inputted, how many were kept after filtering, how many were kept after denoising, and how many were kept being considered non-chimeras. Chimeras are created during PCR when unrelated molecules become tangled and then they're amplified as a single unit. So for this first one we inputted 4460.
Filtering based on quality, we kept 3764. When we denoised that data, we removed all of that noise from the sequencing and sampling steps, we remained with 2879. And then when we removed all the chimeras we had 2209, so pretty good.
And then obviously that's just for one sample, so there's a bunch of sample reads and you can organize them by lowest, so the lowest amount was actually one that had a huge input, it was the one that had our 16000 input. We filtered out a lot of them so we only kept 9919. After we denoised them, we only got 347 and there weren't any chimeras in there, they didn't filter out.
I know it's kind of shocking to have that many reads filtered out, but the majority of our samples actually didn't lose very many reads, so we're not that concerned. It just means that that particular sample happened to be very noisy and unfortunately it happened to have a high sequence depth. So there you have it folks, we now know how to read a stats file from dada2.
So just to recap what we've done in this tutorial: we learned how to denoise our data, we learned how to do some quality control on our data. And in terms of when to use this, this can be used a lot of times whether or not it's dada2 or another denoising and quality control method. This is a pretty important part of most pipelines because you need to make sure that your data is of good quality and doesn't have noise from sequencing.
Anyway, I hope you guys enjoyed this part of the video and thank you guys for listening. In this section we are going to be generating a feature table summary. Now that we've effectively run dada2, we have our dada2 results.
So we have our dada2_table. qza, our dada2_rep_set. qza, and our dada2_stats.
qza. We have looked at our stats. qza which allows us to see how our denoising went, and now we need to create a summary or a visualization for our dada2 feature table.
The feature table includes counts associated with each sequence and each feature that will allow us to gain more insight on our data. So let's head on over to our command line and make sure that we have everything we need. So I’m going to ls and then my working directory.
My working directory is my workshop directory and then inside that workshop directory is the mouse tutorial. So I’m going to ls and what I really need to make sure I have is this dada2. qza file.
If I don't have that, I can't run this command. So now I’m going to come over and I’m going to copy from this little clipboard guy our command for running feature table summarize. And we're just going to paste that right in there.
We're going to be running a feature table summarize. Our input is going to be the dada2_table. qzv, we're going to input our metadata and we're going to output a visualization.
And so this should only take a couple of seconds and once we have that we will have our visualization. So now we have our visualization. I’m not really going to look into this one but we will look into it later on when we're doing our alpha rarefaction video.
Awesome. Thank you guys for listening and I hope you learned a lot!