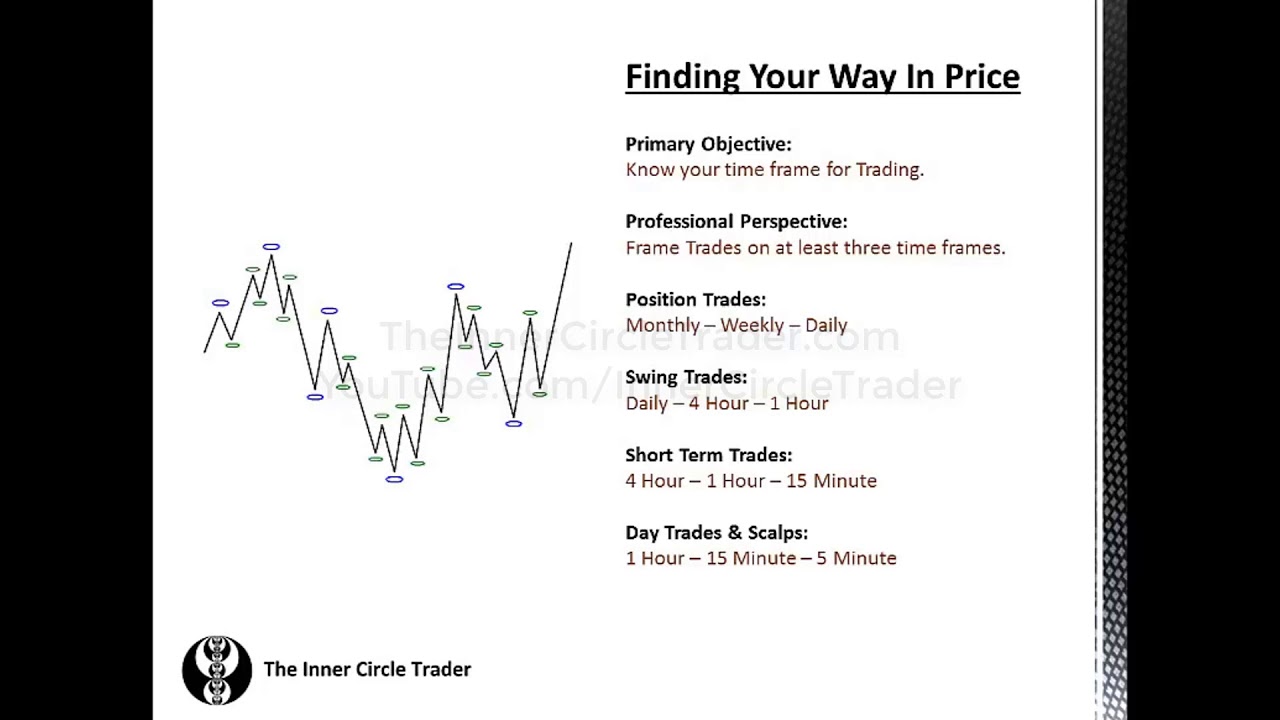
all right folks well we're here so technically this is the first teaching uh I gave you guys an in introduction video obviously if you haven't watched that one yet go to the playlist on my YouTube channel and please watch that one because it'll help at least establish the in my opinion the proper expectations that way you understand what you're getting involved with here and at least it gives me a chance to kind of like break the ice and show you the contrast of what you may be expecting versus what I intend to deliver all right
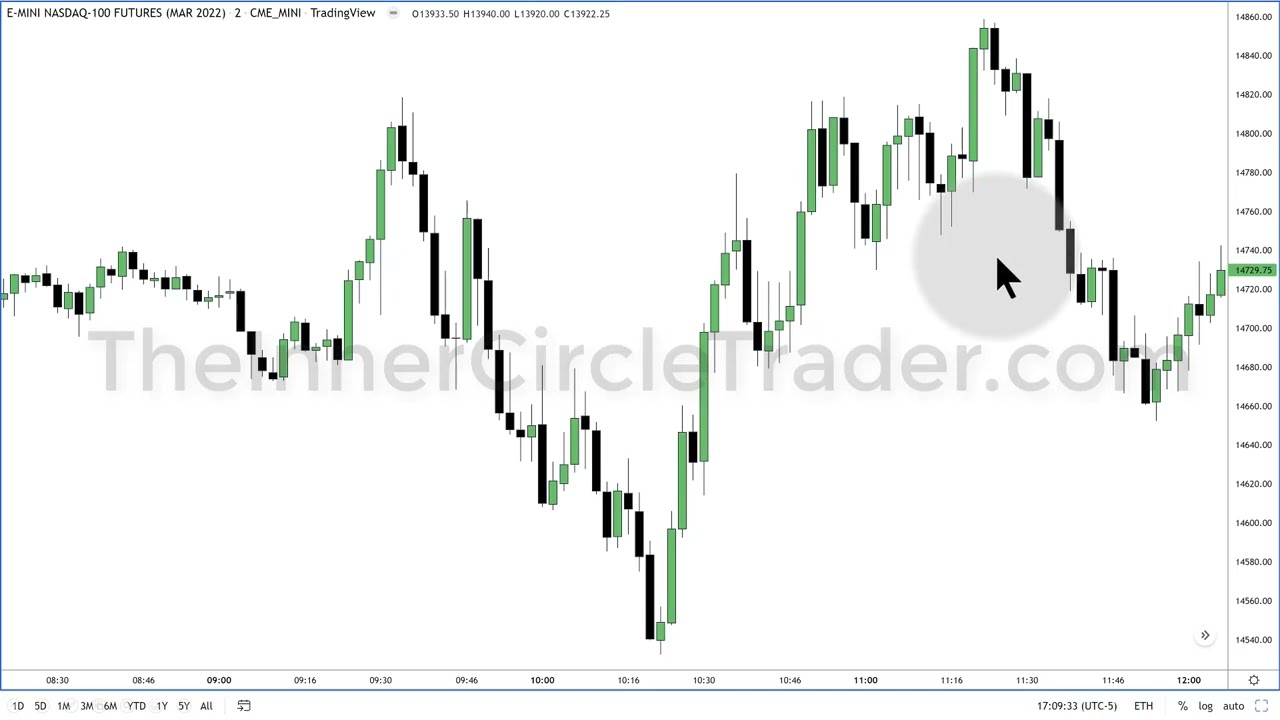
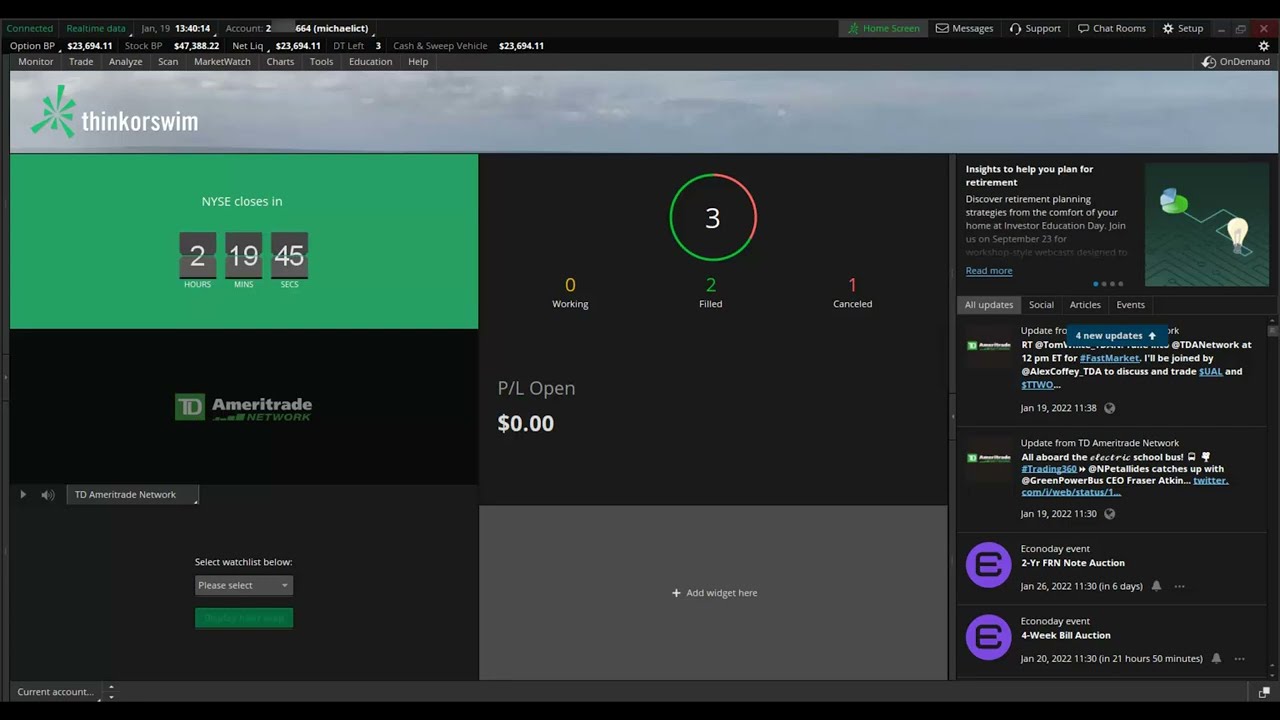
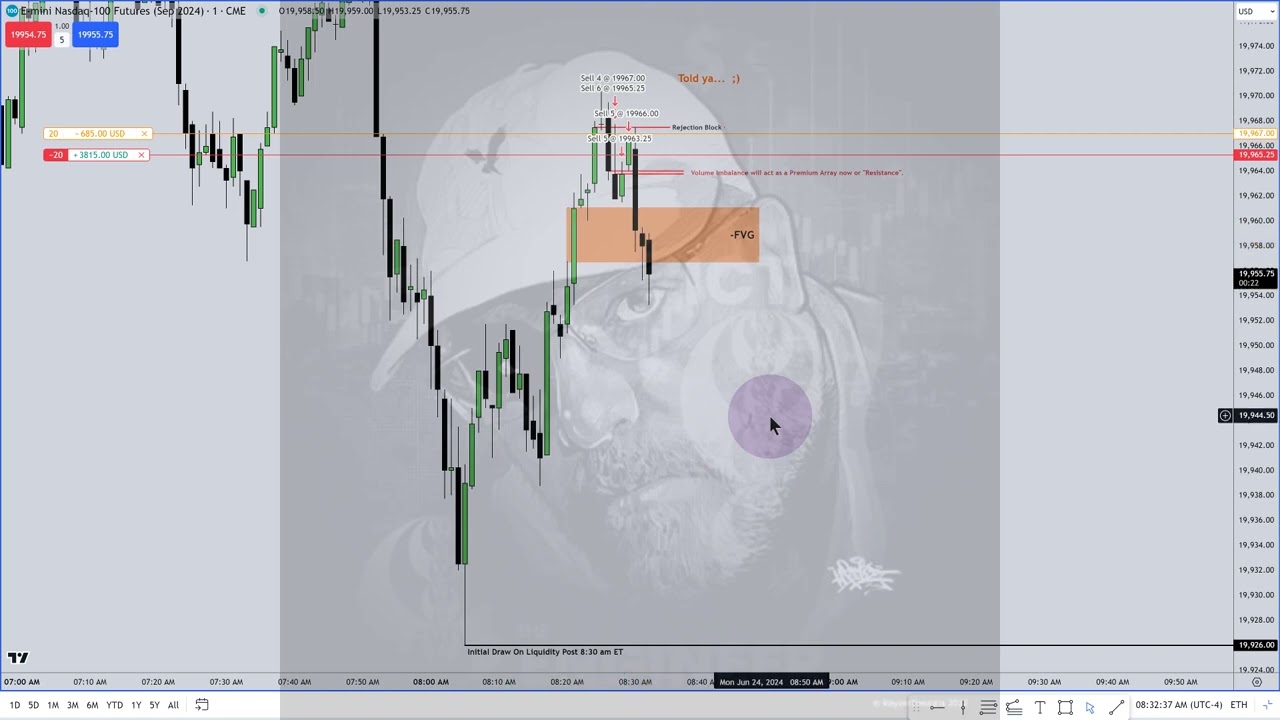
so this first installment is going to be elements to a trade setup all right so coming out of the gate I just want to let you know this is predominantly going to be a Futures index trading mentorship okay the idea is going to be presented in the scope of paper trading on tradingview.com but what you're looking at here this is thinker swims live data these are actual executions I made today and I want you to compare and contrast with what you see on YouTube and other educat where they'll tout that they can do this and
they can do that but really I want you to compare and contrast what you see here all right so we're looking at intraday price action for Nasdaq e- mini Futures and this is actually uh the the main focus of this mentorship okay um I believe that this Market is worth studying I believe it is not just limited to NASDAQ but I believe it's useful to learn as a Trader that views obviously the e- mini S&P the e- mini Dow future and the e- mini NASDAQ now e- mini NASDAQ is a little bit faster a little
bit more aggressive and even with that you can still trade it so I want you to think about what it means to watch price action and understand what it's likely to do before it does it now I'm not promising you're going to be able to do that right out of the gate what I'm going to show you is the compare and contrast to how I can trade versus what I'm promising to teach you in this mentorship how to find specific setups in your demo account okay or your paper trading account I'm not trying to entice
you to trade with live funds okay so that way we know this going in the teachings will be predominantly through the school scope of tradingview.com paper trading module or just hindsight data now I already know some of you are oh here we go the hindsight guy well what you're looking at here is actually live executions from today okay and I want you to think about if you were able to trade a micro account and you were trading the Naas deck and you were able to capture just one of these moves which one would you like
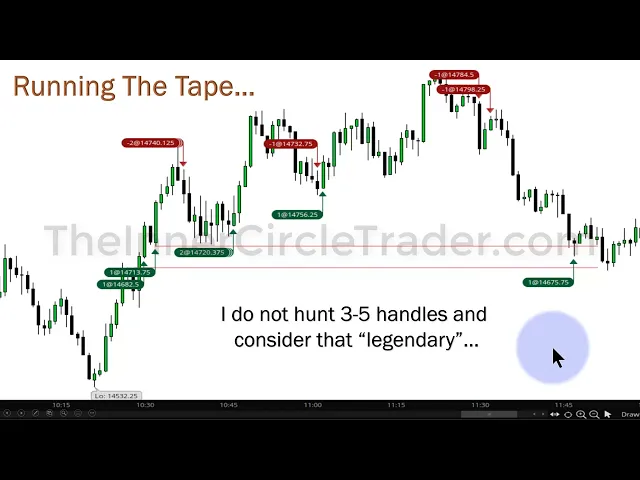
to learn how to find obviously you probably look at this and think well I'd like to do all of them but I want you to think about which one really stands out off the entire chart and this is a one minute chart which one really stands out I'll give you a moment you can pause the video and unpause it when you're ready some of you folks never ever pause it all right so obviously we can see how the Market moves from here okay two orders executed here whenever you see this this is actually a reversal
so if there is a trade on long it'll reverse and take you the other direction okay and then this one here this is a reversal as well then another another close and then another long entry the exit a short entry and then the cover okay I'd like for you to consider what it would take for you to find consistency and how many handles how many full handle moves in an index Futures Contract that would satisfy you and when I say a handle that's essentially four ticks the minimum fluctuation in these markets an example would be
if you were trading the EM S&P and you were trading obviously the 4450 level and you went long if it went to 4451 that's a full handle okay or four ticks or four * $12.50 or $50 per handle the nas deck is $20 per handle so it's slightly different but it's faster it moves a lot more lot more handles a lot more aggression now it doesn't always move faster sometimes we'll have a lethargic price action in this Indy or another out of the three that would be the S&P the NASDAQ and the Dow I personally
don't trade the Dow that much but there's a lot of my students that love trading the ym but ym is the symbol for the Futures Contract and these three markets have the luxury for you that may not have the capability to put up to like $177,000 margin if you were going to trade one full contract of the NASDAQ futures most Brokers unless you're using a discount broker they're going to require you to have Deep Pockets and sense that you're going to have that about $177,000 and about 12,000 and a half for an e- Min S&P
for Futures Contract okay you take basically a fraction of that and you can trade a micro on each one of these markets but obviously it reduces the number of the tick multiplier because you're trading with a lot less technically leverage so I'm going to get into all that but I just kind of like want to begin the conversation informally but also to kind of like show you what it is that I do versus what other people do okay so I'm not trying to you know point my finger at anyone in particular but if you look
around on YouTube there are people out there that try to make a big stink about themselves and they'll try to show results that may or may not be real I'm not here to disparage that they could be actually trading a live account I don't personally care but anyone that trades on think or Swim they can recognize this chart right away I posted a results and updated uh reflection on the Thinker swim or TDM a trade account and it's on my community tab I promise I won't beat you up too much with the community tab but
that's my way of reaching out to you so if you subscribe to the channel and then when you subscribe to the channel you want to toggle all notifications you want to click that little uh I think it's like a bell icon and then all notifications that way anytime I post my community tab it'll let you know otherwise it won't let you know so it's it's my replacement to Twitter which in my opinion sucks so if we look at the EB and flow of all this here where the Market's trading up and between here and here
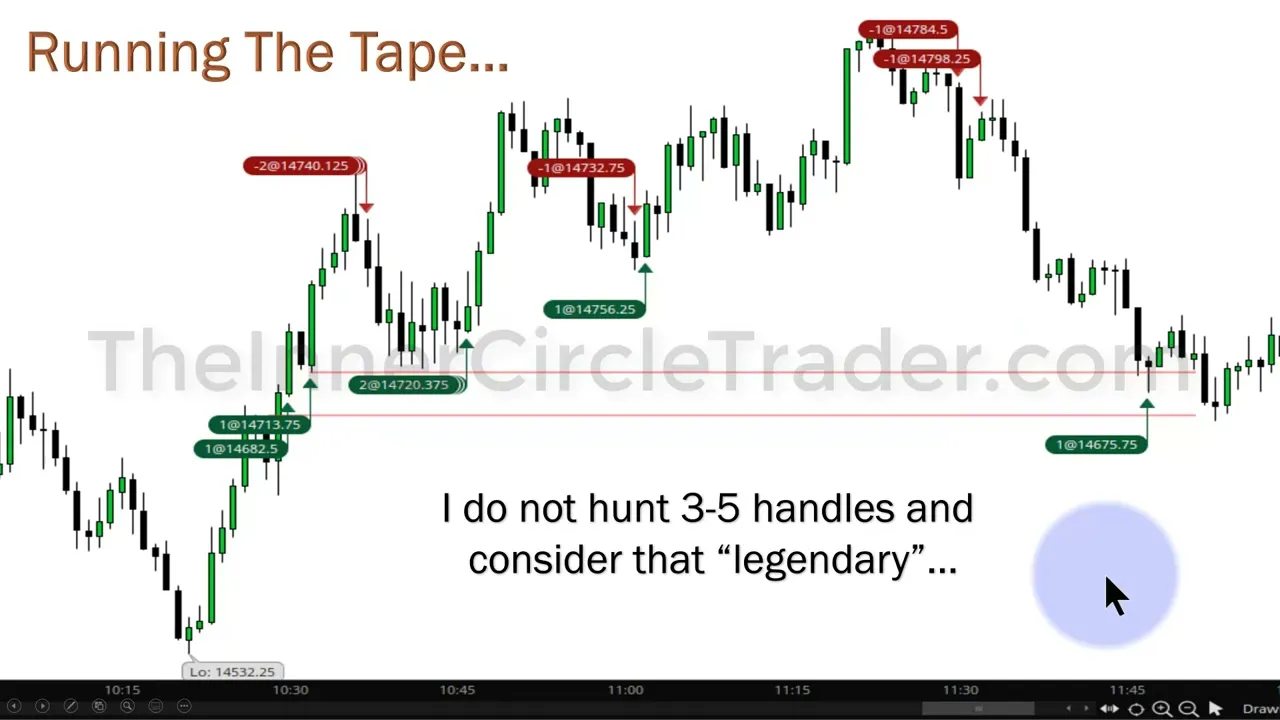
it's not a small number of handles it's a pretty respectful amount of handles it's not a couple it's not a handful and then up here it's a reversal and it comes back down and I buy it back here in Reverse so I'm selling short here and I'm buying long here 740 the 720 that's 20 handles going long here at 720 I'm abbreviating the number just for brevity sake getting out at 732 12 handles then going along here 756 and then getting out at 784 A2 then going short at 798 and covering at 675 so I'll
ask you which one of these trades do you think is the one that you want to learn again putting all aside the idea that you you probably want to do all of these but I'm not promising you that okay I'm going to take you into how to find this setup here notice the number of handles I'm not promising you're going to get this many handles but the setups and the logic behind it will help you find these types of Frameworks framework is the foundation to a trading model so you have to have an understanding what
is you're looking for and that's really the only thing I'm introducing tonight is the idea of what it is I'm promising to educate you with so that way you can go in and find these setups on your own you will not need to be a slave to some kind of blackbox system you don't need to be a part of some kind of signal generating gimmick you don't need to be a part of a signal service you can find these on your own independent that's exactly what I'm trying to frame in all of my students I
do that with my mentorship students that paid me for education now here you are in my YouTube channel I'm telling you the same thing I'm teaching Independence that way you're not requiring any handholding by me once you understand the rules and you go through the processes and things I'm going to teach you how to practice with you will not need anything except for the chart itself that's it and that's how in my opinion and you can argue with this if you want but I could care less if you could any of you would challenge the
idea that independent thinking is not the best way of doing it you want to be able to be Unshackled okay and if you're part of a signal service or if you're part of a approach that requires you to use a blackbox system you're kind of held captive aren't you so if you look at this this chart is clean except for these little bubbles actually show you the transactions you don't really get any kind of well distortion from your reading of price action I don't have a lot of graffiti on the chart okay but the main
takeaway here is I want you to understand that I don't hunt for three to five handles and consider that legendary okay now can you be profitable if you take high frequency trades and you do those types of Trades absolutely that's what Algos do algorithms do that but I'm trying to show you by contrast that there is a way that you can find setups that are outside that parameter of very small little handles and doing lots of contracts so if you're looking at this here and this was say you're trading and you're trading a NASDAQ micro
account you're not making a lot of money on these swings okay I'm not making a lot of money on these swings but I'm able to find these swings and it's not these small little increments okay I'm going to teach you skill sets that Focus primary arily on this okay you want to find a nice price leg intraday I'm not promising you how to buy sell short Buy sell short Buy sell short that's that's mine okay I'm not teaching that and I somebody like oh you're a jerk you're this you're that whatever I didn't promise that
that's why I set the stage in the first introduction video so that way we know what it is I'm teaching you if anyone of you here don't want to learn how to take this type of trade you're welcome to not continue and turn this video off and go watch whoever okay but I think if you give it a chance you'll find some amazing things that bring Clarity to reading price action all right so we're looking at the NASDAQ futures March delivery contract and this is a trading view chart and if you've never used tradingview.com the
way you would pull this symbol up is NQ h222 okay and and this is a weekly chart and I want you to think about each week before the new trading week begins preferably on the weekend okay the idea is you want to try to get a read on what you think that next weekly candle is going to do is it going to go higher or is it going to go lower you're not trying to predict the close of the weekly candle that's important okay you just want to see before this weekly candle opened up all
we had was this IND candle okay do you think that this candle that would have formed and opened here is more likely to go higher or lower obviously with the benefit of hindsight here but I can tell you all of my students know we've been looking for lower prices and I'll just give you a quick short list as the reasons why number one seasonality okay seasonal Tendencies it tends to go down around this time anyway we also have discussions about how the fed's going to raise interest rates stock market does not like that we're also
in earnings season there's a lot of volatility because of earnings and those factors plus the underlying tone of the marketplace which I'll show you when we get into the daily chart it just well it's heavy and this is where it was going to draw to okay did I expect this entire range to be delivered in one week no that's not important the point is I'm expecting the weekly candle to expand on the lower end okay okay or go down and gravitate towards this low which it hasn't broken yet but I think that's what we're probably
going to aim for on Sunday's opening going into Monday's trading so that's where I think it's drawing to and that's the component I want you to focus on with your analysis what is the market likely to draw to when I say draw to think of it as price being a paperclip okay and then you you have this magnetic impulse that specifically price levels and seasonality okay will put on price it'll cause price to gravitate towards certain levels and the measure of speed and magnitude that it moves to get to these levels you learn that over
experience that's not something I can transfer it's something you have to practice and see and study and you get a rhythm for it okay every educator knows what I mean by that and every student that's been trained successfully by any other educator will not understand exactly what I mean by that you just get a feel for it it's experience there's no way of defining outside of that in the early stages of your development you want to at least try to focus your attention on where that Weekly candle is going to do now here's the thing
it may start the first half of the week or maybe just one day expand lower and if you get a setup in that that's it you're done that's how you start working towards consistency no student ever should try to trade every single session every single day because the only thing you're doing is building an expectation that you're going to be able to do this every single day profitably and then if you do get a run of profitability soon as you get a losing trade it's going to blow your mind and you're going to want to
correct it quickly and you're going to start making irrational decisions and then you enter that loser cycle I've talked about many times in the YouTube channel so the only thing you're looking for is a likely movement higher or lower based on on the weekly candle okay that's all you're doing that sets your initial bias for the week on the daily chart you're looking for swing highs and swing lows to get your liquidity and majority of your trading and the draw on liquidity what makes the market go higher or lower it's predominantly found on this time
frame okay so majority of your analysis should really be linked to this time frame right here you have to have an assumption whether you're going to be expecting that Weekly candle to expand higher or lower that's your weekly bi but then you have to go into the daily chart and figure out basically where you are in the grand scheme of things on that Weekly range expanding higher or lower because we're looking for lower prices and we're looking for weakness the expectation is we want to see every short-term low like this would be a shortterm low
this will be a short-term low and underneath those lows there's going to be sell stops okay that's liquidity when I say learn to start looking for where the Market's going to draw to it's drawing to one of two things okay it's drawing to stops which is liquidity or it's running to an imbalance now what's that mean above old highs buy stops below old lows sell stops imbalances is something like this over here where we have one single candle pass higher and the previous candle's high is here and the next candle's low is here so it
only went up one candle nothing moved down the overlap with that same delivery on that price candle there so in other words that's an imbalance it's only going higher and nothing else is here to offset that and efficiently deliver price on the opposite end now you probably heard of the theory auction Theory okay and folks hear me try to communicate some of these things and they'll run away with oh he's just talking about auction Theory and it's not just like when they see me do a rectangle or a box on chart and you'll see one
in this video it's not supply and demand okay it's just what it is you'll see it and you'll know right away after you've been with me for a couple weeks that this is entirely unique and there's nothing else like it and I'm certain majority of you are going to fall in love with this model so we're looking for lower prices we're looking for an expansion I'm using the benefit of hindsight but I can promise you again this was discussed we were looking for lower prices in my paid group and if I did not say that
I have a lot of students that are making YouTube channels they are welcome to come out and say I'm a liar so we're looking at the daily chart we're going to drop down into the hourly chart okay now what I have here is a framework for looking at the weekly range on an hourly chart so all I did was beginning on midnight New York time Monday's candle and then Friday's close and in the beginning of Friday's trading at midnight okay now what I'm delineating here is the fact that we had a nice selloff on Thursday
and the market went into consolidation overnight notice what happens here on Friday this is that old low in the daily chart that's what we're thinking or assuming that it's going to draw to because that daily chart there's lots of liquidity and large fund Traders large institutional Traders institutional mindset investors will be looking at these old lows and old highs and liquidity providers will be looking to take business in around these same levels so if we know that this level down here is the old daily low and again let me take it back up to the
chart on the daily chart that's this low right here okay by dropping down into the hourly chart at levels here all I'm doing is transposing those daily levels right to this hourly chart the entire week has been bearish okay it's been going lower since the beginning then we had consolidation in here the market creates this short-term high in this short-term low what rests above that short-term high if you've taken notes and been paying attention it's buy stops what's resting below this low Here Sell stops watch closely the market trades down initially and takes out the
cell stops why would it do that first this is inducing shorts okay so it Engineers liquidity even if the idea is that they want to take the market down to this level if it's been consolidating I like to see them do this type of move here where it drops down first it's kind of like a sucker play anybody has a sell stop below here they want to sell on weakness they're going to get tripped into the marketplace so now they're triggered in short and then they start doing a run against those Traders and against those
that were already short from this high so what are they doing the Market's being driven higher and the algorithms going to attack that buy stock liquidity pool why would they want to do that number one it's going to punish those individuals here that went short when it drives Above This High here it sends all those spy stops into Market orders flooding the marketplace that gives a huge influx of willing buyers at a high price which is the perfect counterparty to Smart money that wants to sell at a high price remember the market wants to go
down here so when it dries up to here those buy stops are the counterparty or the other side of a smart money Trader that's wanting to go short because they're going to sell short they got to sell it to somebody wants to buy it at a high price that's why the market does this okay in your notes you want to record anytime a significant price move lower is expected always anticipate some measure of a stop hunt on buy stops or a short-term High being taken out obviously it's reversed when you're looking for higher prices generally
you'll see a shortterm low taken out and sell stops taken before you see a very pronounced rally High higher don't take my word for it go through your charts and you'll see it's actually occurring almost on a daily basis so we're going to drop down into a 15-minute time frame so that same old low level down here and that high I just mentioned on the hourly chart and the low on the hourly chart is now been defined with a small little line segment okay so we have a trend line here and a trend line here
that's the extent of a trend line that's it I only use them to highlight to my students these levels are not on my chart I'm watching a naked chart okay you while you're developing you should have these levels drawn out in your chart because it helps you build and ingrain the idea that this is where liquidity is it keeps you focused on that because it's easy to look at all these candles forming if you have the luxury of watching it in life and you can lose sight of where you are and mean once you lose
your bearings it's really confusing and this helps you keep those bearings in mind and what do I mean by that well I mentioned how the market dropped down initially and that takes the sell stops out so sell side liquidity has been attacked Traders are now tripped in going short if they sold on a break trying to be a breakout artist and then the algorithms go right back up to an area where it's been cleanly delivered relative equal highs see how this High here right before it dropped is basically the same high here notice that so
retail Traders see this and they trust it as what resistance so the books always say put your buy stop if you're going to go short right above and clear level of resistance well these levels work for a short period of time but majority of the time you see this event right here and this is how I teach my students to go in there and look for those types of events because what did I just tell you a moments ago about looking for significant price moves before there's a significant price move of any real magnitude or
importance generally there's going to be a hunt that takes place right before that price delivery occurs so what does it look like you have relative equal highs this high and this High the market goes up when we're what we're expecting lower prices on that Weekly chart we're on the last day of the week it's already been heavy it's weak and the only thing it's been doing is consolidate and the first thing it did was broke out to the downside tripping what traders in a breakout to go short so now they have Traders caught on the
wrong side offs side and now they want to take the market up here where those buy stops are going to be resting for those that were smart enough to sell short here or here and didn't get out below here so the larger pool of liquidity is going to be resting here because it's in sync with the downtrend and everybody that was short the day before they seen this High form and once it broke below this low here they all rushed and Trail their stop loss right above that and I understand if you're new and you
think well this is easy to explain in hindsight but I want to remind you go back and look at the first slide I showed you those were actual entries that's a live account through thinker swim Charles swab that was the clearing firm that did the broker side of the business okay so I'm not showing you a demo account I'm not showing you paper trading that those were real entries okay they were real reversals the whole business but the main thing was I showed you that larger trade this is going to be the framework that I'm
teaching you how to find it okay but this pool of liquidity once this occurs you want to drop down to your lower time frames and start looking for something specific and let's go into those lower time frames and find out what that is okay here's a two-minute chart why a two-minute chart well 2 minute 1 minute or 3 minute or five five minutes still has a lot of room for imbalances to occur underneath that time frame and what do I mean by that the one minute 2 minute 3 minute chart tends to be the best
for finding the imbalances for indices okay don't take my word for that okay if you're looking for high frequency setups intraday the one two or 3 minute chart are just beautiful they just offer a real good Clarity the reason why because the high frequency trading algorithms are operating on nothing really higher than 3 minutes majority of the time they're like seconds okay 15c 30 second 45 second 60c intervals okay and what they're looking for are these small little imbalances and what does that look like well we have that run on the buy stops here okay
remember that old high here the old high here old high here it runs right on through that once this occurs on that higher time frame 15-minute time frame you want to drop down to the lower time frames and I'm using the two-minute chart because this is exactly what I was using to find that imbalance and trade off of it okay the market creates a short-term low here here and then it breaks below that this is key this is called a break in Market structure now the foundations and underlying framework is we're in a market that's
what weekly bearish we're expecting that Weekly candle to expand lower it's been expanding all week so we have momentum on our side we have a consolidation that's occurred and we had a pull liquidity engineered with these relative equal highs and the market broke out to the downside first and then they ran on the highs so once it went here we don't rush in there just go short because it went above old highs we're looking for some specific signature that tips its hand to you okay and I promise you when you start going through your charts
and it's going to be homework for you you're going to see this occurring almost every single day and if it's not doing it this way it's doing it the opposite direction as a buy okay again don't take my word for it you're going to be flabbergasted you like that flabbergasted when you see how many times this thing forms every single week okay it's many times throughout the intraday charts it creates this type of move but it runs the stops then we have a short-term low and then it breaks below it so now we have a
Breakin Market structure okay once this low is broken you're going to look for this little area here that's that imbalance I mentioned in the beginning right so what's happening is the Market's going to go right up inside that area there and that's where you want to sell now if you don't sell there you can drop down to a lower time frame one minute chart if this was a 3 minute chart you can go down to a one minute chart and look for that to occur on that time frame as well and it many times will
form if you're looking at a lower time frame like say this was a 5-minute chart and you looked at a one minute chart you'd find one down in here it's a matter of scaling down in your time frames because once you have an underlying premise to the market now likely to go lower it becomes an easy thing to look for these types of things so in your chart once you're developing this idea and and learning it you're going to highlight this candle's low this candle's high and this right here is what I teach my students
as a fair value Gap okay you don't have those in books okay you don't have any of that kind of stuff out there it's something I introduced back in 2016 and obviously a lot of people discovered how good it is and they try to make courses with it but I'm going to not touch that right here but the idea is once it go up into that imbalance there and once it does that soon as it enters that area the algorithm that delivers price now some of you may not know what that means and some of
you may not even agree with it you may think that this is made up or it's contrived I promise you if you spend time with this you're going to quickly come to the conclusion that there absolutely is an algorithm and it's manipulating the markets every single day every single tick it's completely controlled okay period you're led to believe it's buying and selling pressure now if I go back and use that analogy where it went down here first then go up here some of you may argue see that's the buying and selling pressure no it's not
it's liquidity now you may argue and say well we're arguing semantics no I'm telling you what's going on this is the logic this is how these markets book okay once you see these patterns over and over and over again it's very easy to execute on them but the impulse to want to do it the first time you see it because you watch this video that is going to be problematic for you so you're going to have to do a certain number of weeks and months of back testing there's no escaping that you have to do
it any skill set any teacher educator system whatever okay whatever they're going to give you there's going to be some kind of growing period where you have to trial and error fix the problems that you have about yourself and I've literally taken your attention to a very specific framework and setup notice that some of you may think I'm still talking too much but I'm taking you right into the heart of the matter this is what it looks like this is what you're looking for okay these are the Fingerprints of that setup these repeat so if
you know what they are and what those components are that make up this setup you'll be able to find them but focus on the imbalance after the market structure breaks so this big candle here it breaks down look at the next candle it opens and trades higher and stops right there so from this candle's low and this candle's High when this candle starts trading soon as it opens and it runs right up into that that's a short you can go right in there and sell short be done now where's your stock going to be well
you can put it above this High here or you can put it above this candle's High whichever your risk parameters allow for okay um if you're trading the micro which is again it's not a lot of money per tip so the multiplier for that is very very small if you trade the larger full Futures cont cont and if it moves 100 points and it can do it real quick it can burn you pretty bad so you may have the leverage to trade with a discount broker okay you may have the initial margin to trade with
a discount broker but you may not have the wherewithal and the skill set to navigate this market and that's the only thing I'm trying to provide here as an alternative because there's a lot of individuals outs there that will promote the idea that you can go out there with a discount broker and just clean up yeah if you know what you're doing but you don't need a discount broker to be profitable okay looking at this further we're going to look at the logic in here and I want you to think about after this forms and
you see that as your choice setup or entry if it starts to move lower you can still get in it there's no reason not to think that you know you can't get in it here or in here it's close to or in close proximity to where that area is as an entry once we take out a low though once that occurs then it becomes a matter of your chasing price and if you try to get in especially if you like using Market order you may see it trade right to this low and say okay now
I believe it's going to go down you put a market order in the sell short then slippage gets you down here that creates a larger area of risk that you have to assume and it's just it's problematic you want to learn to trust going short when the Market's going higher and that feels scary at first but once you start seeing this pattern form it becomes easy to trust it and in in fact that you want to be doing that you want to be selling short expecting lower prices right when the candle's going up and Retail
Traders can't grasp that many times it's just like it goes against the logic because they think I got to have confirmation all the books say I have to have confirmation and that's somebody that's coming in late that's someone that doesn't have a read price they can't really follow it and usually they're the people that will trade short with additional shell you know sell stops they'll put sell stops below the marketplace and then that's a momentum entry for them and it's kind of like a no-brainer in fast markets it yeah it works but if you don't
know what you're doing you try to do that in a market that's consolidating or about the reverse it hands you your backside okay so if you're looking at this framework here and we've taken the buy stots we have our entry pattern here what would you be looking for as a downside objective well I'm going to teach you the liquidity Matrix okay and sounds pretty cool sounds neat and all that but watch what it is this here is your range this is the low of the day and this is the high of the day thus far
so if we take that range and split it from the low to the high to get the midpoint all this can be determined by a simple 50 level on a Fibonacci so you drag your Fib from this high down to that low or vice versa and have your 50 level highlighted then anything above that 50 level this is referred to from an algorithmic stance as a premium Market it means is expensive now markets can stay in a premium for a while and not go to a discount which would be below the 50 point okay 50%
anything down here is a discount if you're bearish if you're ever going short you want to look at the previous range where are you at inside that range so when this formed here that little fair value Gap once that formed you're thinking okay we are in a premium so algorithms will want want to go to a discount that's the opposing side of the marketplace so if it's going short here it's driving the market lower what does that mean the algorithm is going to start pricing lower you can have all the buyers in the world come
in if the algorithm is in a sell program and it's going lower it does not matter it's going to repic lower and lower and lower and then what will happen is those buyers that may come in with a huge influx of volume they're going to get crushed and they get squeezed you ever hear that term oh this is a bear squeeze this is a bull squeeze all that is an excuse for them not to know why the algorithm is doing what it's doing that's it that's all it is it's an out okay I'm telling you
this is what's really going on so the Market's moving from this premium high this specific entry point to a level below the 50 of this range this low and this high now I want you to again go back and Rewind the video once we're done and look at that execution page where I showed you my entries going back and forth up and down up and down and where I got out at where I got in at okay I want you to think about what below this level here the 50 level what is resting below here
cell stops so now think about the idea of Someone Like You and I that would see this ideal entry as a short we have to sell to get in that short how do we get out of that short we got to buy it back or cover it by buying well we're going to find willing sellers at a low price relative to this point here they're willing already sitting down there with their sell stops right below that low now look closely what else resides right near that low do you see it pause the video before I
show it to you because it kind of ruins the experience because if you find it and I don't tell it it feels good right there is that imbalance I mentioned okay it's only one single candle passing up and the previous candle's High and the next candle's low that area right there is an imbalance from this area here it went down below the 50 level and attacked these cell stops and completely closed in this imbalance so every point of this candle's High to this candle's low that range with the candle only going up that's a by
side imbalance it has to have an equal delivery to be efficiently priced and booked by the algorithm it goes down and completely closes it back in with down movement notice the candle on this here it opens and then trades down so it fulfills its role of balancing the buy side offering now the sells side offering so that is an efficiently delivered price move Precision elements from the entry here down to here everything else after that for the rest of the day I didn't care about even though I had an objective of that old daily low
I wasn't expecting it to run into it this particular day and that's why I didn't participate anymore the rest of the day in hindsight I wish I would have left a small position on and just let it go but you're going to have that you're never going to be right about everything all the time every single day you're going to leave things on the table you're going to get in too early you're going to hold too long you're not going to buy enough you're not going to sell enough there's always going to be some reasons
why you didn't do something right so don't beat yourself up about it okay but if you can find elements like this repeat in the price action can you agree with me that that is amazing precision and this is the logic I used to do that trade the very trade that I showed you that was the largest one in the example of saying which one would you rather learn how to do I basically just handed you an ATM machine okay this repeats every single week every single week now I want you to count the number of
the Handles in this move let's say you got in at uh well this say you got in at 800 14,800 it started to go down you trust it okay we're going to go short ideally you want to enter as it goes into that but it's going to take time for you to trust that but let's say you got in at 14,800 if you got out down here like I did I exited as it went right to the top of that range right here this range here that's the top of it once went below that that
was it for me that closed the trade is that five handles is that 10 handles is that 20 handles is that 30 handles is that 50 handles no it's over 100 and something now let's assume for a moment that you get good at this or I get the inclination that I want to go to some kind of a deep discount broker and I go in I do trades like this and I'm putting on 15 to 25 full Futures contracts what do you think the results are going to be yep so not everything is going to
be easy right away and you're not going to be able to see these things happen just because you sit in front of the charts you have to study and you have to practice and by experience of looking at Old moves and watching real price action as best as you can if you can't watch it live trading view has a replay button where you can watch the candles kind of form but they're they're little stilted because it's not completely painting the candle okay and you can't practice with entering like that you can only just study how
price moved and gravitated towards certain levels it's the best thing you can have if you if you at least consider doing that much that's good but if you really want to take it to the next level and say you're running a business or if you're going to school or you have a job and you can't watch the time frame around the opening of the index Futures and I like watching it around 8:30 in the morning New York local time to 11:00 there's usually a setup in there that I'm going to be able to find obviously
You' seen I did multiple setups and executions today but the point is this that's like that sweet little spot in the morning that I focus on I teach that in this YouTube channel I teach it in my my paid mentorship group so you're getting real stuff here it's not something that was contrive I didn't just make it up because this day worked out in my favor my students recognize these things also and these are simple elements that repeat what you're looking for is a run on liquidity buy stops or sell stops if you're bearish you're
looking for buy stops to be ran then a break-in Market structure lower a short-term low being broken that's what it looks like right here shortterm swing low we have a candle High I'm sorry a candle higher to the left with with its low here then you have the low of this candle and the next candle's higher low than this one so you have a swing low formed if you have that and then you have a break below that if it happens that creates a gap like this that's what you're looking for when it trades up
into that you can go short or if you want to use cell stops you can use a cell stop in this candle here and this let it trip you in and then use the high of that candle as your stop that may be too wide for you but I I mentioned the logic around this is you're using a micro okay micros aren't that big of a deal it's not a lot of money okay you're not risking a full Futures leverage it's very very small so if you're looking at these types of setups and you can
find them forming repeatedly over and over and over again and you study them you're going to see that you don't need to get these little five handle moves these little 10 handle moves you can make a living doing that don't get me wrong I'm not trying to say that people cannot be profitable and wildly profitable but when you learn how to do something like this and you're able to pull down this number of handles and then you have sound money management nothing compares to it folks these are the things that I use when you watched
on when I was on Twitter and I ran up the demo accounts really high these are types of setups I was using these types of setups and as the account grew it was more demo account leverage well I'm not using a demo account right now I'm showing you with a think or Swim and anybody that knows think or Swim when I'm showing you those screenshots the paper trading shows as orange everything on that page is orange when it's a live account it's green okay also here's the rub with a demo account it's just demo demo
demo demo okay I am not trying to promote the idea that you're going to get rich notice that account hasn't gone Bonkers it hasn't ran up to a million dollars because this mentorship is to hopefully inspire you to pick up a skill that if you deem it useful and you decide at your own discretion and your own timing and you assume that risk on your own because I'm not going to tell you to do this if you decide to get really good at this and you put money behind it that's a skill set that could
I'm not promising but it could alleviate some of the problems with what I believe is coming in terms of financial hardship not just in America but everywhere jobs are getting harder and harder to have the economy is a mess so how do we answer that how do we get another income stream coming in this is in my opinion this is one of the ways that you can at least investigate the idea of doing it all right so I'm going to give you some homework in closing I want you to go through all of the e-
mini Futures Contract charts okay just like I showed you here these time frames go back and look at the presentation and see what the time frames I gave you listen to what I gave you in terms of audio commentary that is enough in fact I gave you a ton and it may have your head spinning if you're brand new to me or if you're brand new to technical analysis or trading me feel like man is too fast do not send me an email I promise you the lessons I have planned will help eliminate and answer
majority of the things you're going to ask just try to study and keep up with the pace that I'm going to put you through which isn't going to be all that bad but as we progress deeper into the teachings many of the questions that are going to come up or when you start going into the homework assignment where you're looking at old data an intraday chart is anything less than a daily chart so like a 4H hour chart that's intraday 1 hour chart that's intraday 5 minute 3 minute 2 minute 1 minute all those time
frames are intraday what you're going to be looking for are breaks in Market structure after a pool of liquidity okay buy stops or sell stops have been taken in an opposing direction of your weekly expected range in other words are you expecting higher prices or lower prices on the weekly range so if you're looking for lower prices your focus is on a run above an old high once that forms then you're looking for a break- in Market structure on a lower time frame once that occurs and you have an imbalance that's your trigger okay and
then you split that range that was created find out where the 50% is and then if you're selling short you want to find something like an old low or an imbalance to aim for as your Target and you want to get the closest Target don't try to get fancy and say okay well I think it's going to go down to that lowest low and try to use that for your exit because sometimes these markets can deny you that so lwh hanging fruit is how I teach you want to have the easiest Target and then allow
the market to go farther and you just not be a part of it it's okay is is 125 130 Handles in an index not good enough I think it's good enough but I'm probably just biased but the homework assignment is again you going through the charts using the logic I framed in this introduction lesson looking for Breakin Market structure I also have lessons in this YouTube channel that talks about Market structure breaks and things like that and then you're going to look for the imbalance in price which is that fair value cap then you're going
to determine where an opposing high or low resides than log and back test the number of handles you see in hindsight examples and other words how much did it offer and you're going to get a collection of doing that the next lesson I'm actually going to show you how to go back into the charts and look for them how to log them in your journal and give you more insights about how you can find these setups that repeat every single week okay so again I'm going to build on this foundation in the next episode The
Next Episode will will be next Tuesday and the time upload will be 10:00 New York local time hopefully you've enjoyed this one until I'll talk to you next time I wish you good luck and good training