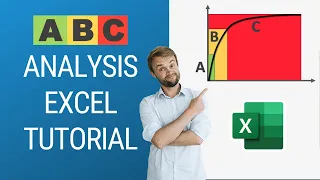
welcome back to local TV this week we're going to be talking about ABC analysis an inventory categorization method that has its roots in perrito's 80/20 rule the method works by splitting a catalog based on its perceived Worth and has been adopted by many major ERP software's as well as the supply chain industry as a whole so Johannes that's a quick overview of ABC analysis but perhaps you could sort of explain to it for us in a little bit more detail yes I mean as you pointed out the ABC analysis takes its route I would say
in the Perito analysis which basically describes entire categories of I would say social networks so basically it's it's the idea that when you look anything that is like socially constructed usually the 20% most active most important most something represent 80% of the mass you will find that on LinkedIn the total amount of let's connections that the people that have the most connections on Lindy in the top 20% is probably having something like 80% of the links if you look at the wealth you will have the 20% reaches that probably have 80% of the wealth and
if you in supply chain if you look at products the top 20% of products have like probably 80 percent of the sales and indeed it's a it's an Italian mathematician and civil engineer Pareto who discovered that during the late 19th century so that's that's probably the the origin although if we think in term of categorization of inventory it probably the the idea is just an insight without the math who's probably dating back from the antiquities but I don't I don't have it exactly I would say precise sources on that but I would suspect that people
have been doing that like literally forever so that's of a background - so how does it actually work them so the key insight in in ABC analysis for inventory is to categorize your SKUs or products into classes you will typically have let's say three to five classes and you will go from the a class which is dedicated to the fast movers to the last class that can be d or e that is going to be your slow movers and and with classes in between the two present varying I would say velocity for your different for
your different for your different products oscar's so what you what you do end up is relatively coarse grain buckets that gather products that have somehow similar inventory velocities on in terms of how many units do you need to produce or serve on any single day okay and so is this something that's being used like regularly by companies on sort of a daily basis it seems like very simplistic yes it is very simplistic it is widely used in in the supply chain world and and I would say widely abused as well the key inside is that
you have some categorization that so this this categorization how does it help well it helps when you have products that that it really reflect the physical constraints that you have on your product so for example in aerospace you would have say a first category of products that are very expensive and repairable so that that's going to be your row table and you're going to track them at the love of the tsiyon under then you're going to have like relatively cheap but still we bubble you're not going to track them at the love of the certain
number you're going to track them how many units do you have for a different product type and then you are going to have like consumable where you just you cannot repair them so you don't expect that the product will flow back and you you just count the quantity so that gives you in this case different categories buckets that represent different modalities of of handling the goods in this sort of situation having classes to reflect I would say the distinct physical processes that you have makes sense just like for example in food industry instead of aerospace
you would typically have a different processing for frozen food or dry food again those categorization we flag the fact that it's it's a very different physical handling of the goods but ABC analysis by itself is not concerned not really about the physical aspects of the goods it's only concerned about the sales velocity and when I was reflecting to to the abuse is the idea that you basically create broad categories that are only defined by the relative sales of the products because that's if you have like let's say three classes a B and C typically what
does that mean to be an a item that means that you have let's say above 20 units per day being sold or produce that will make you an a item and you see so that's that's just a numerical cutoff on the amount of sales that you had for or let's say the last three month I mean it's the the recipe vary from one company to the next but the key idea is that you define a velocity as an as an average of a certain period of time and and then you define cut off that one
cut off for each for each categories that you have ABCDE and this is it okay well logically it kind of seems to make sense it kind of sounds like a good idea you want to categorize your products into which the most important which are maybe not so important I kind of get the impression it's something you don't completely agree with and so why is it not relevant so I mean the interesting thing is that when you think about the route of this ABC analysis is that it lets you operate over your inventory without doing any
counting whatsoever so if we if we adopt I would say a 19th century perspective on the inventory management what would you do I mean for the items of Class A you would take big bins so you have like large containers and you would have a rule that is a bit Kanban like that say if you see that the beam is half empty you pass a wielder and this is it and then for item B it's the same thing but you have a beam that is a bit smaller and for item C you even you probably
don't even have a bench you just have a shelf and you have one product on the shelf and when you consume one yuri other one again a bit kind of Kanban like so with these methods with this sort of organization you can have a way where you can actually manage your inventory without counting anything you know on site when you go and pick an item if it's an item a you could directly look up the bin if it looks like half empty you pass an order of let's say by default one hundred units if it's
an item that match a bin of Tybee by default you pass an order of let's say ten units and if it's item or type c you pass an order of one unit every single time you consume one you see that again that lets you operate your your inventory and your supply chain literally without doing any kind of inventory counting which is great if you do not have any kind of software to run your supply chain but when we project that in in a world where we have computers and we can actually track and count inventory
automatically it doesn't really make much sense because fundamentally the inventory categorization the class ABCD is just like a very it's a discrete low resolution approximation of how many you need to do pursue produce or consume over the last couple of months and this is it which means that any kind of decision that is based on the class could be actually refined more accurately made more accurate if instead of using the class it was actually using the actual sales history of the product instead and that's where I would say the great fallacy is is that the
ABC class do not add any additional information to the product compared to roll demand history of the product so what are the sort of problems that can arise from taking sort of an ABC approach them so you have you have many I would say overall the main angle is that it's it's it's very very low resolution it's a bit like you have the capacity to do the calculation by the gram but you round it up everything by the tone that's a sort of problem of when you when you do this it's it act as a
massive rounding so what what problems do you have I mean first you have problems such as all the products that are within a class can be extremely a tardiness it's it's not because you've created five you have let's say 2,000 products it's not because you've created five classes that you that you're very specific I mean each class is still containing something like 400 products and you can have huge amount of of of it a virginity in those classes so that the first problem is that it gives you an illusion that those things are kind of
the same while mostly they are not and it's it's it's true for the top sellers we are typically probably your top 1% of the product is is probably having a sales velocities that is like 10 times higher than the top 10% you know per product so so that if you if you have like five buckets you you will not get this this granularity also at the other end of the spectrum for the long tail I mean again the long tail is very very long so it's it's in the long tails of your class let's say
you have three classes your class see it might contains items that are only sold once a month in items that are sold only once every decade you know all of that is packed together and and yet it's very it's very very different the way you want to approach some things that is needed once per decade and something that is needed once per month and then further along I would say that the total poems that you get from I would say a very crude disk disk classification is that this classification tends to be also very unstable
over time we we have experimented with with several clients and we were typically noticing that something like between a third and half of the products change of class from one let's say period to the necks of one quarter to the next so basically when you when you look at the sales of a quarter you do your ABC analysis and you you look at the sales data for the next quarter you redo your ABC analysis you you can end up with situation where you have let's say 40% of the products and that's really the sort of
things that were observing that have a different class which mean that just because you've change of quarters suddenly you're going to have like a real the policies that is completely different for a given item just because it this item change of class it doesn't really make sense you know if you had an item that had had a gradual but very gradual slow down over the last two years why would you decide that just because you go from one day to the next and that you've you've crossed a certain numerical threshold that suddenly this items that
you were during once a month you would reorder it only twice a year you know that's that gives you tones are very nonlinear effects with with lot of gaps or products that that suddenly jump from being reordered once a month to being reorder only once a year and it's it's extremely arbitrary and it does not reflect you know the the fine-grained evolution of the demand ultimately okay so how can you sort of approach things in kind of a better way because if you're not sort of categorizing your sort of products how do you sort of
know that you're taking care of those products that are really most important so yes here it's typically it's typically I would say a divide-and-conquer approach that supply chains that some some supply chain manager have over their own supply chain where they are going to say I am in order to make sure that I pay really attention to product that matters most I will have I will say if I have a purchasing manager who is managing items of clay class a they are going to manage let's say 50 items and if it's a manager that manage
items of Class B this manager is going to manage the 200 items and if it's a manager that manage items of Class C this manager is going to manage 1000 items so that you have more brain power over each of the items that are most expensive however this is again taking the perspective that all those decisions you know supply chain decision how much do i purchase how much do I produce where do I put the inventory should I actually liquidate the inventory should I move the price and whatnot all those decisions are driven by by
humans who do or everything manually in reality with as soon as you have computers the world things is changed completely the computer has no problem - basically we process thousands of items dozens of or hundreds or even thousands of times a day if that's what makes sense so in order to to - if you want to ensure that for example you you have a higher service level for your items a so what are you really saying well what you're really saying is that if you have an item that has that is selling more chances are
that you can have a better forecast why because again that's that the game of number each you have it's it's much easier to forecast if an item is telling as steadily at 100 units a day you can say next day is going to be somewhere around 100 and that's going to be a reasonably good forecast maybe plus or minus 10 percent if you have an item that is selling once a month what is the most probable team and for tomorrow is 0 unit but it's it's it's very erratic you might have days where you sell
to extra so so bottom line there is a silver lining which is if you have items that have higher volume you tend to have lower errata city and so ensuring a higher service level so let's talk outs is more cost efficient why because the amount of inventories that you need to keep is more or less proportional to your lead time on one side and the errata city on the other side so if you have basically an errata city that twice as large you need to have twice as much so so you need to more stock
for items that sells more but comparatively to items that have low sales volume you need a lot less so you invent your inventory that you keep for highly for high-volume fast moving items is more efficient in terms of transforming euros or dollars into extra points of service level so that's why typically you end up with those buckets and all those recipes but you can see the problem completely differently you can say well first I'm going to adapt a probabilistic forecast that is going to natively reflect the uncertainty so for high-volume items I will get a
forecast that is high obviously but also that is relatively concentrated because my uncertainty is low and the poetic forecast gives you a priority distribution with that reflects the uncertainties that you will have on future demand and then for I would say slow movers you will get a probability distribution that is going to be where the mean of the distribution is going to be much lower on average you have less demand but the distribution is going to be very spread because there is a lot of uncertainty a lot of rata City and then you combine that
with economic drivers so when you say that you want to have a high service level what you're actually selling is saying is that for every stock out that you face you lose margins and you maybe have I would say a stock out penalty so that you know the the commas that you lose with your clients when they expect to find something and that you and you cannot deliver the good that we're basically advertised so so the idea is that if you combine the fact that you have economy drivers it has the cost of stock the
carrying costs of purchasing cost the cost of stuck out the margin that is your extra reward because you're going to resell your stuff at something that is beyond your cost obviously then the the fill rate is that you get all the service level that you get is just a consequence of combining those economic drivers with your probably stick demand forecast and the categorization the ABC categorization do not even intervene in the calculation because ultimately the the ABC categorization is just a crude way either to estimate the future demand or the errata city of the future
demand which you get out of the box if you have a probabilistic forecasting engine so you say it's a very sort of crude way of doing it with a VC analysis isn't like a low cut solution just a much finer grained kind of optimization kind of an extension of a VC analysis that what's the key difference I mean the key difference is that we would just consider that we have as many classes as we have items and as many classes as we have possible sales history you see at some point if you have a granularity
that is so thin that you have one class per situation the categorization becomes a bit meaningless and I would say the approach of low CAD is to think of in terms of information you know more in the sense of informational theory where does the information come from to take a better decision ultimately if all the information originated from the observed sales history then a forecasting model can potentially internally rebuild its own classification if it helps you see but it sits inside the forecasting model or engine and typically because it's very granular it's not how it's
being done you know it there is no there is no saving the only saving of ABC analysis is that it's it's a sort of methods that let you avoid doing calculation all together which is very great if if all you have is a pencil and a sheet of paper and thousands of items again 90th inch in now it says it's obliging of the 19th century if you want to track thousands of items by hand it's a nightmare and so so it is it was very very the clerical cost of keeping track of stuff was was
very high so you wanted to have methods where you do not need to do any calculation not even an addition whatsoever and it's interesting because those those methods were kind of relatively intuitive and ballpark and guesstimate and and and I would say represent some kind of estimation approach and look at we really take I that's basically the quantity of supply chain approach is to quantify things to the fullest extent possible knowing that we have ridiculously fast computers that can do or billions of additions a second so raw processing power is not a scarce resource so
it's very simplistic ABC analysis and you mentioned that one of the real positives is you can just you don't need a pen and paper and there must be some other benefits the ABC analysis Y company is still using it what those benefits I mean I'm not sure program we have seen we have seen lot of situation I would say there is lot of imaginary benefits real benefits tangible benefits it's much less clear again companies are using that for divide and conquer to basically spread the workload of manually processing the items of many supply chain practitioners
well the answer is don't do that it's it's a bad idea you should have something that process uniformly all the items if you have a method that rely on some kind of packetization chances are that you can rethink your methods to remove the packetization and directly use the average demand over the last few months it will typically perform better you do not need to have something that goes through big increments or big steps and in terms of reporting I would say it's an approach where very frequently the management produced totes of vanity metrics and people
are I would say entrench in the habits of say oh look dear CEO we are so good when we look at the a items because our a items have a service level of let's say 95 percent but again this is a percentage and not dollars of error so it doesn't matter if your if your sales volume if your a items have a very very high service level if your client if your clients still think that what they really need is the rest to see it the the thing is that you really want to bring it
down to I would say dollars of performance dollars of error I mean things that are expressed in dollars was a rather than in in percentage and an ABC analysis it's it's typically aware to build vanity metrics where you have percentages and you build extra percentages such as on top of your percentages and the the disconnect with the actual reality can be very very strong and if you if you compound that with the fact that those ABC classes are also very unstable you know from one culture to another you can end up with the illusion that
your metrics are good while actually things are changing all the time for example if you have an item an item that is Class A you suffer a massive stock out this item is likely to drop into Class B very fast just because the the amount of unit that have been sold dropped because of your struck out but then in terms of statistics it looks good because you just kicked out from your class a an item that was badly performing so suddenly you know the just because you have items where you have massive stuck out they
will actually exit themselves from the class a by design because the class a wave like the sales volume so if you have a massive stuck out on something that is Class A it's going it's not going to last in the class it's going to drop very rapidly into Class B and see where you would say Oh everything is fine again this this product had tribal service level but it was a Class C so all is well no not all is not well here you you just you you just have a side effect that things that
perform very badly exiting your fast mover class but for all the wrong reasons okay well I'm afraid we're gonna have to wrap things up there but a big takeaway from today is ABC analysis is just for the very vain yes and don't do that cool so that's their everything for this week thanks very much for watching and we'll see you again next time bye for now you