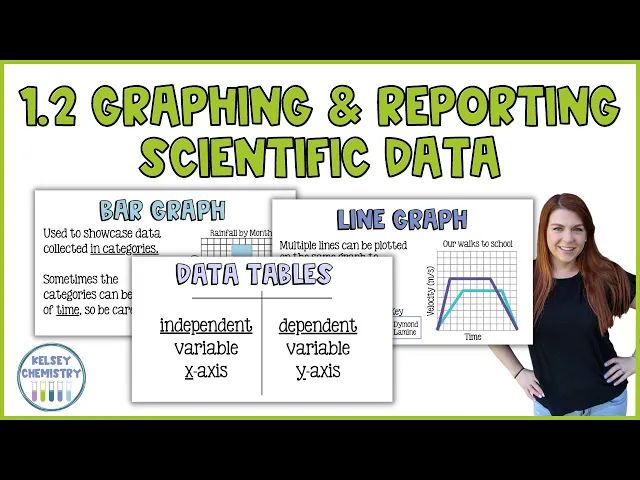
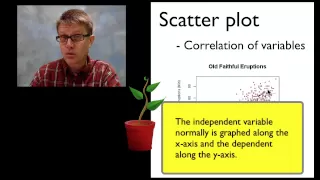
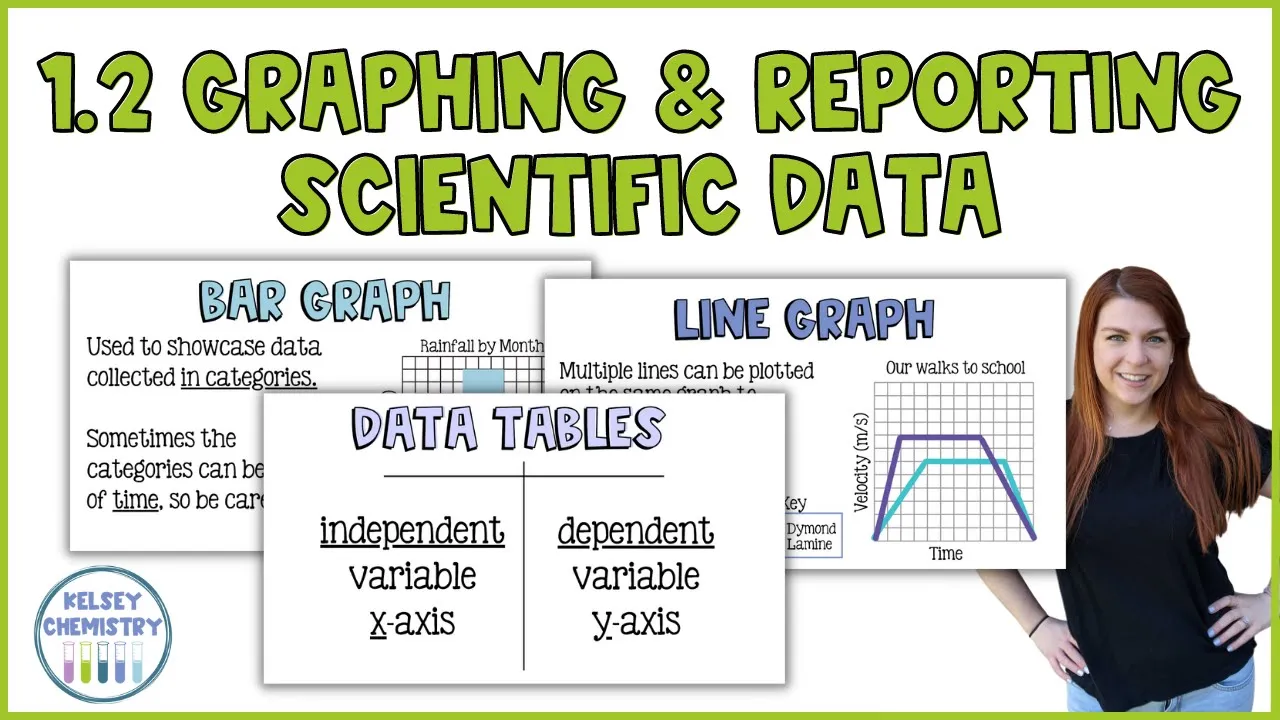
hey there welcome to today's lesson on collecting data so we know that when we do experiments we have to account for some specific variables and i would love for you to pause this video and take a second to define those terms in the simplest terms that you can you are defining independent variable dependent variable and controlled variable all right the independent variable is the thing that you are testing the dependent variable is the thing that you are measuring and finally the controlled variables are things that you are going to hold constant so that you can make comparisons and today we're going to move forward with all of this data we're collecting and we are going to showcase it in graphs and charts and we're going to follow all of the scientific conventions which i'm going to teach you right now so after scientists collect their data we have two ways that we really organize the data and that is going to be with graphs and data tables graphs are very visual and they can give you a good look at what the data is immediately and data tables are kind of like the raw data before it is manipulated at all graphs can be tricky because depending on the axes and what we're measuring it can sometimes be easy to manipulate data and make it look better or worse than it actually is um imagine taking a graph and stretching it out really really big or shrinking the data really close together to make a line graph for instance look more dramatic or less dramatic depending on what you're going for in a data table you have your data just running down and that is not super visual it takes a lot more thought but it really can't be as manipulated the way a graph can so it's important to really know how to read these and read them well so that you're getting a good accurate picture of what this data is supposed to be so we're going to start with data tables because this is how we showcase raw data and data tables are typically going to look like a t-chart sometimes they're boxed in it it's okay it doesn't matter in this first column we typically are going to put the independent variable or the thing that we're testing and when we translate a data table to a graph this data in this first column is going to go on the x-axis in the second column of a data table will be the dependent variable or in other words the thing that we are measuring and when that gets translated to a graph that data is going to go on the y-axis occasionally you will see data tables that have more than two columns and if that's the case you would read it where the independent variable is still the first column and then you can have multiple dependent variables in multiple columns data tables have this convention so that super quickly we can decide um just by looking at the data table what the scientist has is testing and what they are measuring and i don't know if there is a big data table meeting a few years ago and everybody decided that this is how they were going to do data tables but it is the way that we do it so we are going to whenever we do data tables put them together in the same way so that if we write up a lab report and we're going to share it with other scientists they can go aha that's the independent variable that's what they tested those are dependent variables that's what they measured and they're going to instantaneously know what your experiment looked like they are going to follow those conventions that when we read their data tables we know what they tested and what they measured okay when we translate it to a graph we typically are going to do a graph on what we call a coordinate grid which is this grid here and the vertical axis the one that goes up and down is called the y-axis and that is where our dependent variable is plotted so if we were thinking back to that multiplication experiment this would be the scores that the kids got so um i would imagine that the more sugar a kid had the worse their score because they're all hyped up on sugar but that might not be true maybe sugar gives them the energy that they need to take the test because it might be a test that's at six o'clock in the morning who knows um that's why you test it to make sure that you uh have some good reliable data so this is where the kids test scores would go and in our data table that would be the second column our graphs always begin at what we call the origin now the origin will typically be in this bottom corner um because a lot of the time in science we're graphing things in the positive so we're working in the quadrant that is positive in the x direction and positive in the y sometimes we plot it on the the whole grid and if that were true our origin would be in the middle and then we can have negative x values which would be back here and we would have negative y values that would be here and the origin would maybe be in the center um but typically in chemistry we're not working with negatives very often so the origin is going to be in the bottom left corner and typically that is going to be represented by the coordinates 0 0. if we are plotting things that are in the thousands or the hundreds and we don't want a lot of empty space before we get to our first data point we will sometimes put a little squiggly line on that axis and we may go from 0 to 100 and then maybe 110 120 130 140 150 that little squiggle line is kind of like in writing a quote where you put a dot dot which means that you left something out in a graph you use that squiggly line to say hey i'm skipping the first hundred data points that we're not using and starting my graph really at a hundred so sometimes you'll see that squiggle there it's really not common in chemistry but i just wanted to point it out in case you came across it [Music] finally on a graph we have the x-axis which is the horizontal axis and that is where we are going to put the independent variable which remember is the thing that we are testing so in our multiplication thing this is going to be the amount of sugar and then right here would be their scores the amount of sugar the thing that we're testing versus their scores this is a lot to keep straight i know back when i was in school i learned and i don't know how old school this is because i've never been asked to teach it this way but regardless i learned the variables as the responding and the manipulated variable so this is how i learned how a graph works and i think it's good so i'm going to share it with you on a graph the manipulated variable is the same as the independent variable that's what the scientist is testing and that's the thing that the scientist is going to manipulate right each group of students is going to get a different amount of sugar that's the change that the scientists manipulates with their hands like a manicure m-a-n-i is hands that's the prefix so they are going to manipulate which is the independent variable thing that they test that goes on the x-axis so we have mix the responding variable is going to be the response to the change so we give kids different amount of sugar and then they have a different test score that score might be higher with more sugar it might be lower with more sugar that's what we're testing but that that's the response that we get that's also the dependent variable it depends on the amount of sugar right so that goes on the y-axis so if you remember dry mix you will always remember which variable goes on which axis now getting into graphs no matter what type of graph you have they're all going to need a few things first all of your graphs are going to need a title just like all your data tables you have to explain what your graph or data table is showcasing graphs will also need axis labels so here we are counting the number of students that's our measurement and we are asking what pets each student has so that's um the test what's the most popular pet i guess and that is going to go on the x-axis and we have to label them so that anytime you read a graph you know what you're looking at and then lastly this one kind of goes back to that squiggly line i was talking about the numbers are in consistent increments so here you can see that my graph goes by twos that's fantastic i cannot have a graph that the first like we put a 3 right here and then we put a 4 right here and then we can't make this line 9. we can't do that because we would have from here to here each line represents one and then from here to here we've gone from four to nine and that means one space on the graph really is the equivalent of five kids we can't do that we need our numbers in consistent increments and the reason is because we want this dark blue bar that represents nine kids to be triple the size of the line that represents three kids and it is and the graph should showcase that if it's a good graph that is what it's going to look like now we don't have to have nine lines to represent nine kids each of these lines we could have done 2 4 6 8 10 12 and you might do that if you have a lot of data and not a lot of space maybe if you were surveying the entire fourth grade or the entire school you would have you know more than 12 kids um in a particular category i assume that dogs and cats would be really high so you would maybe set your graph to go by tens in that case that's okay as long as each line of the graph represents the same amount if the lowest data point let's say we we pulled the whole school and the lowest data point we had was 100.
um you wouldn't maybe go 10 20 30 40 50 60 maybe you wouldn't do that maybe you'd put that squiggly line and then you would start at 100 and then you would go 110 120 130. i don't think that's the best option i don't like to do that because like i said i would want the 100 to be half the size of 200 or a fifth the size of 500 i like to see that in a graph so i wouldn't necessarily choose that for a bar graph i think that would be great for a line graph but you can do it that is um as long as after that squiggly line that break they call it um your your lines represent consistent increments now there's three primary types of graphs and there's different variations of each of these types but we are going to choose the type of graph depending on the data that we collect the first is a line graph and the line graph is going to typically showcase your data collected over time not always but a lot of the time it's data over time so here this is a physics graph but it's a it's a good idea we have velocity which is very very very close to speed and that is velocity over time so this is the passage of time there's no units on this there should be units and there should be numbers but this is just to get a picture of what the graph looks like each of these lines might represent 10 seconds it might represent 10 minutes but it should be the same increment each time and the same thing here this might be 1 meter per second 2 meters per second or it might be 10 and 20 meters per second there's no way of knowing because this one's not labeled but this proves my point that we want our graphs labeled and we want them labeled well so that we know what we're looking at this graph is called my walk to school so it might be one meter per second and this is probably seconds but either way um this is what a line graph would look like a lot of the time it's collected over time but not necessarily you can also have a double line graph and this is where you can plot multiple data tables kind of on the same graph and this is what i was saying if we had a data table that had two dependent variables if we had a data table for these two walks to school we may have um time running down the first column because that's the thing that we are testing and then the thing that we're measuring is speed or velocity so we would have a column for diamond who is graphed in purple and then we would have a graph for lamine which is graphed in this bright blue and then diamond would have her own column and lamine would have his column and then we could plot these on the same line graph and then this is good because we can compare our data definitely diamond uh walks faster than lamine she accelerates she gets up to whatever this speed is and she walks way faster than him so i don't think they're walking to school together but um because she's definitely ahead of him she's walking much faster but they they get there at the same time they're going to end their walks at the same time so anytime we have multiple lines or multiple sets of data on the same graph we have to have some type of key to indicate which line goes with which data set so here it's color coded on line graphs you'll sometimes see it in dashed lines or the they'll be points on the graph so this one diamond might have triangles at the end of her data points like where the line changes and then the mean may have circles or squares all right bar graphs bar graphs are typically going to showcase your data in categories and here we are looking at rainfall by month measured in inches so we are measuring rainfall in inches see how this works your your axes tell you exactly what's happening um occasionally your bar graphs will be categorized by time so it's really important to be careful with the type of graph line graphs are not always by time bar graphs usually are not time but sometimes they are it kind of depends sometimes it's really just preference um so for for this graph i like a bar graph because it's going to tell me that in april it rained almost twice as much as it did in may if we were charting rainfall for an entire year maybe i would want a line graph and if i were comparing two years i might want a double line graph like maybe 20 21 compared to 2022 and then we can you know track some changes in rainfall year over year um but you could also do that in a bar graph you can have march 2021 versus march 2022 and put them side by side and see maybe if one is taller than the other one i like those as well those are really fun for comparison so that also would be a double columned data table and here we have a pie chart and pie charts sometimes called circle charts circle graphs pie graphs it's not really a graph it's more a chart um they are going to showcase data as part of a total so typically we are going to take our raw data and convert it into a percentage and then we're going to plug that into the graph so here this is favorite colors in my class so all of the kids in the class were surveyed and they were asked what's your favorite color so what happens is you count all of the kids who like red and you are going to take red divided by all the kids and multiply that by 100 to turn it into a percent if you're really good with percentages you can reverse engineer this to figure out exactly how many kids liked blue for instance um so i don't know how many kids are in this group but let's say it's 25. sometimes on your pie chart you will see the total number surveyed not always um i like to see that i think it's it's um good practice to do that but let's say that the total number of kids in this class was 25.
if we have 40 percent of the kids in the class like the color blue we have to ask ourselves what is 40 of 25 so we would do 0. 4 times 25 and we would come up that that answer is 10. so that means 10 kids in the class like the color blue if there are um 25 kids in the class and 20 of them like green we would do 0.
2 times 25 and we would get five kids like green that means two and a half kids like purple so probably not the correct answer it's probably not 25 um because that doesn't make sense you can't have two and a half kids but um that's why i like to see a total number surveyed on a pie chart this you'll see on like shampoo bottles a lot of cosmetic type things like health and beauty body care type things it'll say like 30 of people saw the softer hair 45 of people saw less wrinkles it'll be that kind of thing and that is data that would be in a pie chart mostly um it would be people who had softer hair people who were happy with their hair people and it's usually the result of a survey not always though and then you would just showcase it like this and um it also is going to visually tell you like this light blue section is the biggest section so you know that the most people like blue even without seeing the numbers all right you should build a graph and try to figure out what type of graph this data should be plotted on we're talking about the growth of a plant given one cup of water daily and the growth of a plant given two cups of water daily we have two data tables and i want them on one graph let me see what you can do now this is what my graph looked like um i decided on a double line graph and i started on day one i wanted my origin to be zero zero so my graph doesn't actually start on the y-axis but if you started on day one that's fine as long as you're working with even increments i have plant one in this purpley color and i have plant two in the green color and i like this because we can compare the data very well we have a title the growth of it turns out their tomato plants um given different amounts of water so we have one cup of water and two cups of water on our tomato plants and we are measuring in centimeters and we are testing their growth over a certain amount of time you can see on my graph that all of my stuff is in even increments so here each of the vertical steps represents two centimeters but i haven't written it for every single one which is kind of important a lot of kids miss this this line here is zero and that's two and that's four that's six that's 8. i decided not to write every single number because i didn't want my axis very cluttered so i've done that which you very well can do you don't have to write every single number but every step should represent the same amount and in my case that's two centimeters here i have um three blocks on the horizontal represents a day so this is one 1. 33 1.