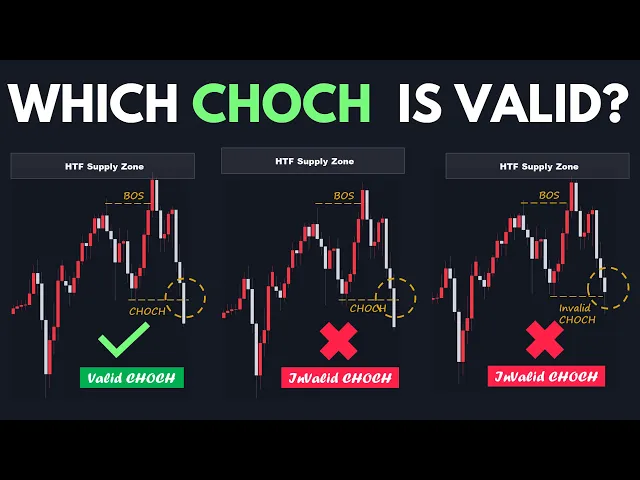
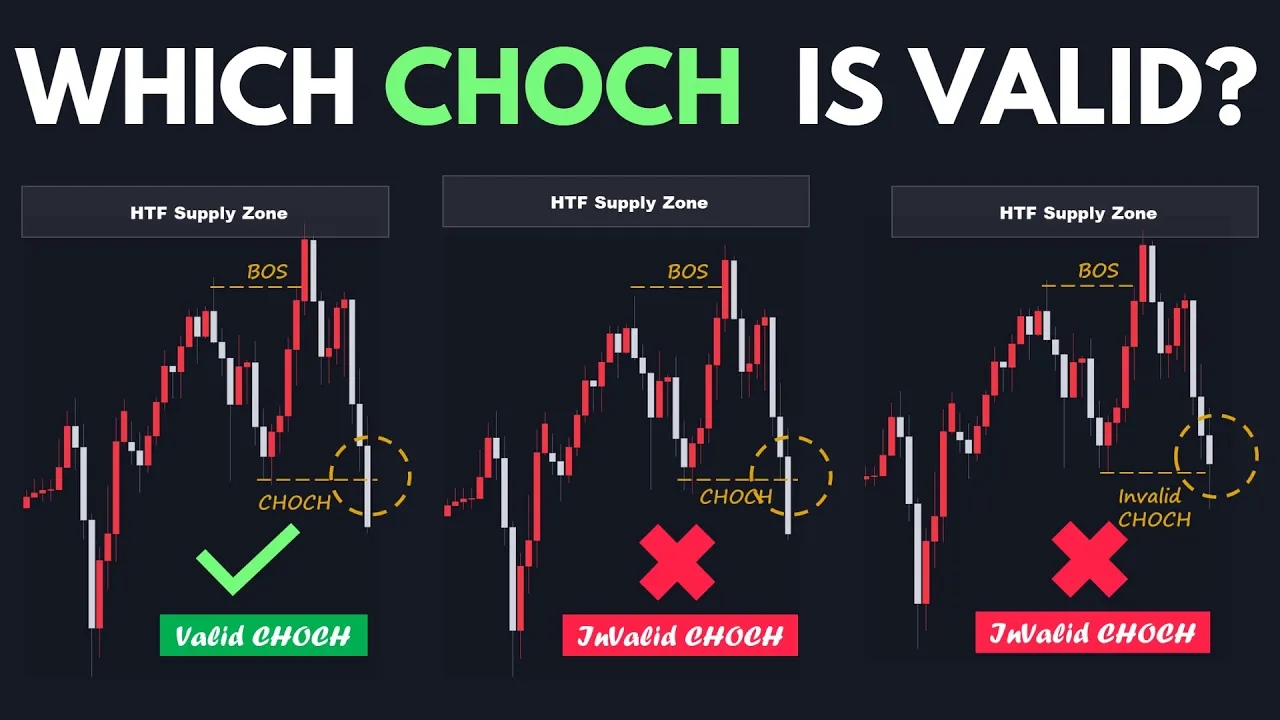
Hey traders and welcome to another episode of Smart Risk. Today we're diving deep into a critical skill every trader needs. The ability to identify highquality and valid change of characters in the market.
This skill is not just a step. It's the first and key one you should master to pave your way to becoming a profitable and successful trader because without mastering this topic, you are likely to fall into market traps. In this advanced episode, we delve into various types of change of character, trading strategies, and associated price actions that you might encounter in the market.
But that's not all. We'll also break down the key criteria and rules that can turn a change of character into a high probability trade. So traders, if that's something you're interested in, please give this video a thumbs up to show your support and subscribe to our channel if you are new.
See you after intro. [Music] [Music] Welcome back traders. So let's get started.
So what is the definition of the change of character? A change of character occurs when the dominant market momentum subsides signaling a shift in the overall trend and order flow over time. This pattern serves as the first indication that a shift in market structure is on the horizon suggesting a potential shift in control from buyers to sellers or vice versa.
Now let's see how we can identify a valid change of character in the market. In the bearish scenario, the change of character takes place when the price breaks and closes below the most recent major low and the latest demand zone. The same concepts apply to the bullish scenario.
In this example, we see that the price was in an uptrend, consistently forming a series of bullish structure breaks. However, a shift in market structure occurs when the price breaks through the most recent major low and demand zone, signifying the first change of character. The downward momentum continues as the price pushes through the next demand zone and higher low, resulting in a second change of character.
This dual change of character suggests an impending shift in market structure. Now we can anticipate the price entering the bearish order flow. Please consider this crucial point.
Every time a zone breaks, an opposite side zone automatically forms. Since price has broken several demand zones, a supply zone has been created at the extreme. Therefore, our expectation is for the price to push higher toward the extreme supply zone.
If the price reacts to this zone, we can enter the market by placing sell positions. Our anticipation for the price is to form successive bearish breaks of structures to the downside. Looking at the chart, we notice that after the mitigation of the extreme demand zone attributed to the change of characters wave, price reversed its direction, pushed lower, broke through and closed below the newly generated lower low.
Subsequently, the price formed a pullback, rose back up, reacted to another supply zone, and then continued pushing down, breaking another structure once again. As evident, the market's overall bullish structure has changed to bearish after the formation of the change of character pattern and the price entered the bearish order flow phase. So, a change of character involves changing the market's overall trend from bearish to bullish or from bullish to bearish.
Once again, let's consider a market structure like the one described where the price has formed a change of character by breaking and closing above this major high. Additionally, we see that price breaks through this supply zone and it's noteworthy that the price has not left any unmitigated supply behind itself. As you can see, all of the supplies are mitigated before.
So, this means as the price breaks through the latest supply zone, it signifies the formation of a demand zone. As mentioned earlier, whenever a zone breaks, an opposite side zone is automatically formed. Therefore, a newly generated unmititigated demand zone emerges at the extreme.
Considering this, entering a long position based on this demand zone is a viable option. There's a high probability that the price will return to this demand zone, react to it, and then change its direction to the upside. This expectation is supported by the prior formation of a bullish change of character indicating an upcoming shift in the market structure towards a bullish trend.
So in this situation, price has a great opportunity to retrace back down, touch our newly generated demand zone, activate our pending buy order, and then push to the upside. Now, let's move into essential criteria and rules that we need to consider in order to identify valid and highquality change of character patterns in the market and understand how we can use them to our advantage. But before we continue, if you're curious about how we stay updated on financial news and fundamental analysis, well, we rely on Fastbull, one of the best trading websites with various useful trading tools.
This site provides one of the most accurate and detailed economic calendar, a tool we use every day before starting our technical analysis. 247 economic live streaming also allows us to stay informed about the latest Trading World's news and fundamental analysis. So, if you want to benefit from multiple trading tools that can significantly improve your trading, make sure to check the link in the description.
The first criteria that must be met in order to identify a valid change of character is higher time frame mitigation. A change of character is valid only under one condition. Price must reverse and originate from a higher time frame supply or demand zone before breaking the recent major structure and initiating the change of character.
If the price creates a change of character without interacting with a supply or demand zone, even with a valid candlestick pattern, it cannot be considered a valid change of character. This is a crucial point that needs careful consideration because it helps us identify high probability points of interest and valid reversal patterns. This prevents us from falling into traps caused by false reversal changes in market character and trading in the wrong direction.
For example, consider a bearish market structure where sellers are in control. Price has formed a series of bearish break of structures and supply zones associated with these structure breaks. Now, in the following scenario, we see that price moved upwards.
After indicating a tiny rejection from the last supply zone, price broke and closed above it. Here we facing a common scenario that frequently occurs in the market. Many novice traders who haven't correctly identified the market structure often consider this upward movement as a change of character, a signal of a reversal in market direction.
They believe that the bearish phase has ended and it's an ideal time to go long with the newly formed demand zone. They typically place their stop loss just below this new demand zone. However, contrary to their expectations, price made a brief upward move, mitigated the upper supply, and then continued its bearish movement.
This resulted in hitting the stop-loss of traders who had taken long positions. They often failed to realize why their stop-loss was triggered by the price. And unfortunately, they repeat these actions repeatedly.
What they missed here is a crucial point. The price didn't reverse from any unmmitigated demand zone. They shouldn't have entered a long position until the price reached a major unmitigated demand area.
Their identified change of character was invalid and the price only moved upwards to mitigate the upper supply zone. It used the last supply zone as an inducement zone to sweep more liquidity and gain more momentum to fuel its downward movement. This scenario highlights that without a proper understanding of market structure, you're likely to experience losses.
Inexperienced traders could have avoided this if they had a better understanding of market sentiment. they would have noticed that their identified change of character was not valid because the price hadn't reached the higher time frame demand zone yet. Now let's move into the next confluence criteria for identifying change of characters with high probabilities.
Liquidity sweep. To obtain additional confirmation in identifying highquality change of character patterns indicating an upcoming market structure shift, we should wait for the price to establish static liquidity zones near our identified higher time frames area of interest. We fully discussed static liquidity zones and their various types and models in the market in detail in our previous episodes.
I strongly recommend watching those episodes carefully if you want to have a solid grasp of static liquidity zones and understand their profound impact on market price direction. However, let's have a quick breakdown of them here. As you know guys, static liquidity refers to the specific zones in the market where a large pool of money is resting such as stop losses, buy or sell orders and also can be found in various areas on the price chart.
But the most important and practical types of static liquidity that frequently are seen in the market are equal lows, equal highs, and dynamic trend lines. Each of them falls into distinct categories like double bottom or double top and triple bottom or triple top patterns. Bearish or bullish dynamic trend lines.
Imagine we have a structure like this on the higher time frame like 15-minut time frame. The price is in a downtrend having formed a series of BOS's to the downside. After tapping into the previous supply zone, the price reversed and created an unmititigated supply zone awaiting mitigation.
Now the price is pushing to the upside. Zooming into a lower time frame like the 1 minute time frame, we see that the price has formed a series of higher highs and higher lows on its path toward the 15minut time frame supply zone. Just before tapping into the supply zone and right below it, the price created equal highs forming a double top that accumulates great liquidity near our identified higher time frame supply zone.
We see that the price sweeps the liquidity accumulated above the double tops, taps into the higher time frame supply zone, reverses its direction after mitigating the 15-minut supply zone, pushes downward, and creates a change of character by breaking and closing below the most recent major low. eventually breaking through this demand zone formed by the break of structure. As mentioned earlier, every time a zone breaks, an opposite side zone automatically forms.
Since the price broke through the latest bullish demand zone, it has formed a supply zone right here associated with the change of characters bearish wave. So here we have the confluence factors that we were looking to identify a highquality change of character pattern that provides a high probability in the market. After mitigating the higher time frame supply zone and conducting a liquidity sweep in the current time frame, a change of character formation occurs.
In the next step, we can place a sell limit order at the lowest point of the newly generated supply zone, setting the stop-loss a few pips above the highest point of the zone. For the take-profit, we can either set it at the unmititigated demand zone of the higher time frame or target the current time frame swing low. Recognizing a liquidity sweep pattern before the price reaches our identified area of interest is crucial.
This pattern confirms the strength of our supply or demand area. We use liquidity sweeps as a confirmation factor. The idea is simple.
Market requires liquidity for momentum. If the price doesn't sweep liquidity before a key level, it often uses that zone as liquidity to fuel its momentum. As a result, if price taps into higher time frame supply or demand zone without sweeping liquidity and subsequently price shows a rejection and also creates a change of character pattern on the lower time frame.
However, there is a high chance that price will continue moving in the opposite side of the newly generated change of character and also fails and triggers the stop-loss of the traders who have entered into the market with the expectation that price will change its primary direction after emergence of the change of character pattern. Now, let's proceed to the next criteria which is the double zone breakout. For a change of character pattern to be more effective with a higher chance of success, the price should break and close below or above the two successive supply or demand zones along its path.
For example, in this scenario, if price breaks through this demand zone also, we have double zone breakout because price breaks out of the two successive demand zones with a bearish single leg movement. This pattern will be a strong confluence and confirmation for entering into the market by opening short or long positions depending on bearish or bullish order flow. Let's consider a scenario where the price only created this supply zone.
The price broke through and closed below the two demand zones already leaving a significant inefficiency behind. This provides a strong confirmation after the emergence of the double zone breakout. Subsequently, a newly generated strong supply zone forms at the extreme.
In this case, we can place a sell limit order at the extreme demand zone because the price has a great chance to return to fill the inefficiency left before fulfill the orders, tap into the order block, mitigate the supply zone, and then push to the downside. Considering the concept of a double zone breakout or even multiple zone breakouts into your trading will enhance your confidence in your trading journey, making you more certain about your trades. Now, let's explore another possible scenario of a double zone breakout that you might frequently encounter in the market.
Once again, we have the same scenario with only one difference. The price couldn't break through the second demand zone with a single downside movement. We see that the price broke through the last demand zone and created this supply zone at the extreme.
Then price experienced a temporary pause and a pullback, but it couldn't mitigate the extreme supply zone. Instead, it formed a liquidity pool by creating a double top. Subsequently, the price pushed to the downside and broke out the next demand zone.
Since a demand zone has been broken, a new opposite side zone will be created, which is this supply zone. As mentioned earlier, the upper supply zone is the extreme one and the second supply zone located a bit lower is called the decisional zone. Please consider that we cannot place any trades based on the decisional supply zone because there is a high chance that the price will push higher to sweep the liquidity accumulated above the double tops and trigger the stop-loss of traders who entered from the decisional supply zone.
If you had entered the market from the decisional supply zone, there is a high chance that the price will push higher to mitigate the extreme zone and also sweep the liquidity accumulated along its way. If you had an order, you would be part of that liquidity. What we should do is wait for the price to sweep the liquidity accumulated in the market, tap into our extreme supply zone, and then we can enter the market.
That's it traders. Thank you for watching this video. I hope you found it informative and useful.
Don't forget to hit the subscribe button and turn on notifications to stay updated on our latest videos. We value your feedback and suggestions, so please leave your comments below and let us know what topics you'd like us to cover in our future videos. We appreciate your support and look forward to seeing you in the next episode.