[Music] [Music] yes [Music] [Music] okay folks we are looking at part six on the trading plan development series and we're focusing on short-term trading in this example and obviously you know we're not gonna be reinventing the wheel here a lot of the concepts that I'll be Discussing here are taught in previous teaching modules I would counsel you to look at my short-term trading video module the power 3 video module how to capture explosive profits in the forex market video module and well you'll you'll refer back to the optimal trade entry video module and maybe even
the fib concept so your module may be of help to you as well but let's take a look at the overall plan here okay and we're looking at short-term trading plan And the premise to this style trading is we're gonna be trading in sync with the market structure and want to talk about market structure in this video module little bit more great detail because I really wanted to differentiate it from market flow okay because there is a difference in what I mean when I say market flow and market structure okay if there was one specific
preference over trading with market flow or March structure it would be a market structure Okay I learned it from malaria Williams and I think this will be more or less a better treatise on the explanation on how I trade with it in this month in this module all right the duration this style of trading is as low as intraday a entry and exit of the same day - as little as a few days anything greater than 5 days in a trade I would consider swing trade so 5 days or less to me as a short
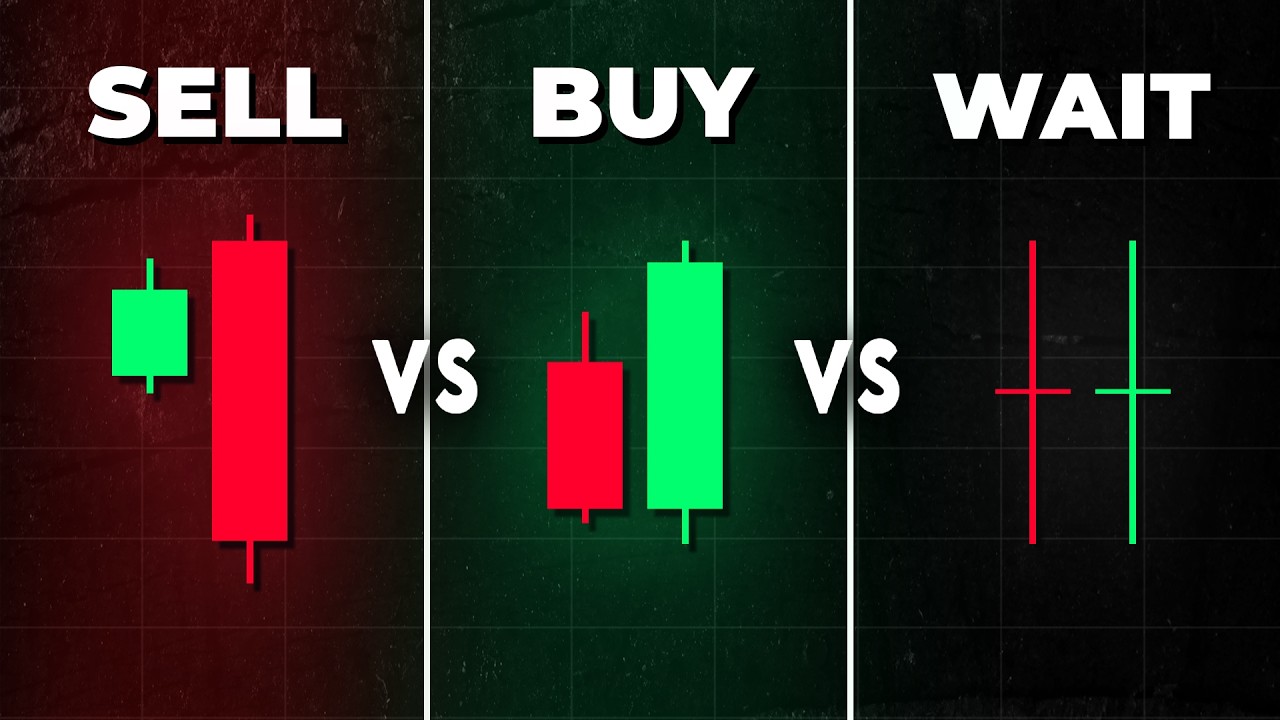
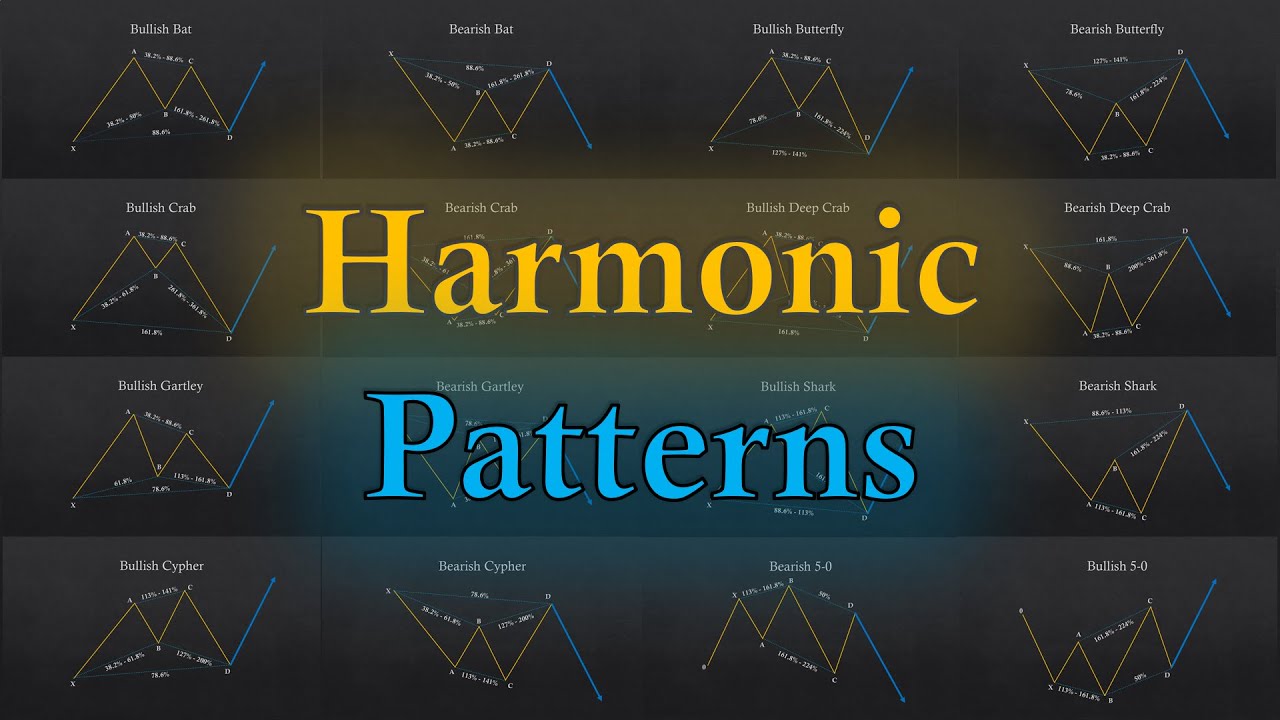
term trade and the average pips in terms of Profit we're aiming for 50 to 150 pips per trade alright so the buy signals how do we arrive at looking for buys where we're gonna be trading long in the observance of a bullish market maker profile that's the fractal we're gonna be highlighting in this video module there's all types of fractals all different styles of trading fractals i--came fractals are simply a pattern that is infinitely visible okay in any time frame up or down okay they're gonna Look a little bit different overall but generally the overall
premise or pattern to it is universally the same okay and you'll see what I mean by that when we look at the actual market maker profile we looking to find price patterns and confluences to support our trades in the direction of the market maker profile and market structure those both being bullish and we'll be utilizing the optimal trade entry for entry price and using fib extensions for profits nothing New here guys new known reinventing the wheel here simple concepts we've already talked about in previous video modules sell signals obviously much like everything else in my
teaching is just reverse everything so if you look for the observance of a bearish market maker profile the fractal again we're looking for with a bearish market structure and we'll be looking for price patterns and confluences and we'll be utilizing the alcohol trade entry for our entry price And using fib extensions 127 162 and 200 for profit now when we put a trade on the risk we associate to each trade will be maximized at no greater than 2% per trade ideally I recommend 1% even then it's demo account guys because you don't want the demoralizing
effect of being wrong in seeing your equity erode even if it is a demo account you don't know you're not learning anything about loosing money fast ok trust me I've done that a lot early on I've lost a lot of Money okay and I never learned anything from that ok I learned from really learning to step back and lose money slowly that's that that's when you learn because when you quickly lose money and lots of it you're you're so swamped with emotions okay you can't think objectively and you want to be able to lose money
slowly and objectively look at what it is you're doing wrong and take a you know a step back and look at it if you loosen 7 8 12 15 percent in one or two trades okay I've done that okay years and years ago I've I've done that and I'm telling you you don't want anything from that you actually will find limitless reasons to get out of this and never do it and never give yourself a chance so again can't stress it enough keep your risk very very small if you're brand new absolutely brand new risk
1/2 of 1% how about that goes against what you thought Is logic on you think you got risk a whole lot of money you don't so if you're looking at you know a trading portfolio and you use these concepts or any other trading concepts obviously risk management is in the forefront of your mind as a trader I said even as a developing trader because as a professional like myself I the first thing I care about is what am I gonna risk okay what is my risk overall and how quickly can I remove the risk and
go To break-even and then immediately looking beyond that point to lock in something I want to get paid okay I don't want I don't care about right I wanna be paid I know there's enough opportunities every single week I can I can harvest money from the market every week okay that's the months that you need to adopt there's no rush to get in there is a rush to protect your assets and your in your equity so there's where you rush you rush to save money and you Move slowly when you're trying to make money okay
so that way you're controlling your drawdown and for more information on that obviously look at my handling drawdown and inevitable loss this video module okay that's actually how I handle with losing streaks and yes surprised I had losing streaks so you have to have that in your arsenal as well so now taking a step back and looking at this you probably scratching you're saying we'll wait a minute This really isn't on trading plan well that's for the guys it just started watching my videos and they're looking at this saying what does this even mean for
those who didn't follow me for a while and have digested two previous videos and you understand a little trade entry is you understand what specific price patterns we're talking about do you understand what confluences are okay you had a brief introduction to fractals with the Osmel Trade entries we're gonna learn a little bit more about that in here and what specifically a market maker does on all time frames to facilitate trade but it's not my goal here to break down every intricate detail that goes into making a specific short-term trading plan and the reason why
is because I don't know your personality I don't know what framework you're building you're trading on and you'll understand more about what I mean by that when we actually break down the Market maker profile because every one of these profiles is ambiguous okay in other words it can be viewed even though I present it as a bullish market profile you may hone in on one aspect of this specific prat fractal and you may say well this is a pattern I see clearly and I'll present it in this presentation as a buy model but you may
see the opportunities in there to sell okay and believe me this will make much more sense when we started looking at it but If that's what you see that's how you trade okay and don't discount that okay and rewind that for a second and if you're if you're listening to the playback go back a couple seconds let me hear that again that specific aspect of this fractal pattern if you specifically see the selling aspect of a buy model that's your niche that's your framework to start trading okay all you need is a small little segment
of the market place to be profitable okay that's what you're Doing this for you're not in here to impress your wife you're not here to press your husband how smart you are you don't wanna go back to high school and say you know your physics teachers hey look at this you know I told you I was gonna amount to something I'm a Forex trader okay that's not that's not your goal okay and if it is you know prioritize make it back to getting profitability okay keep the ego out of it so with all that You
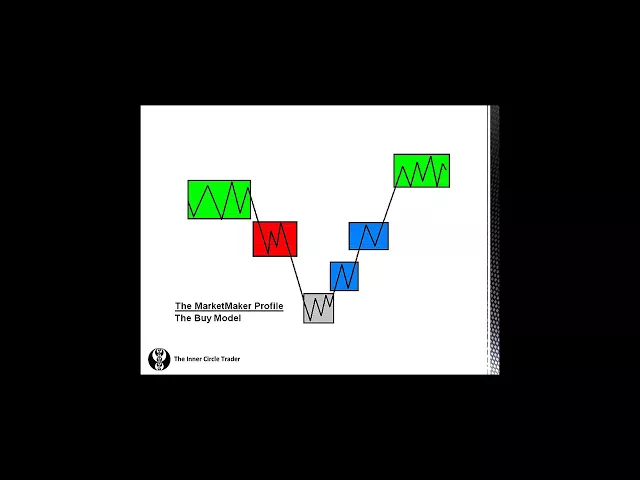
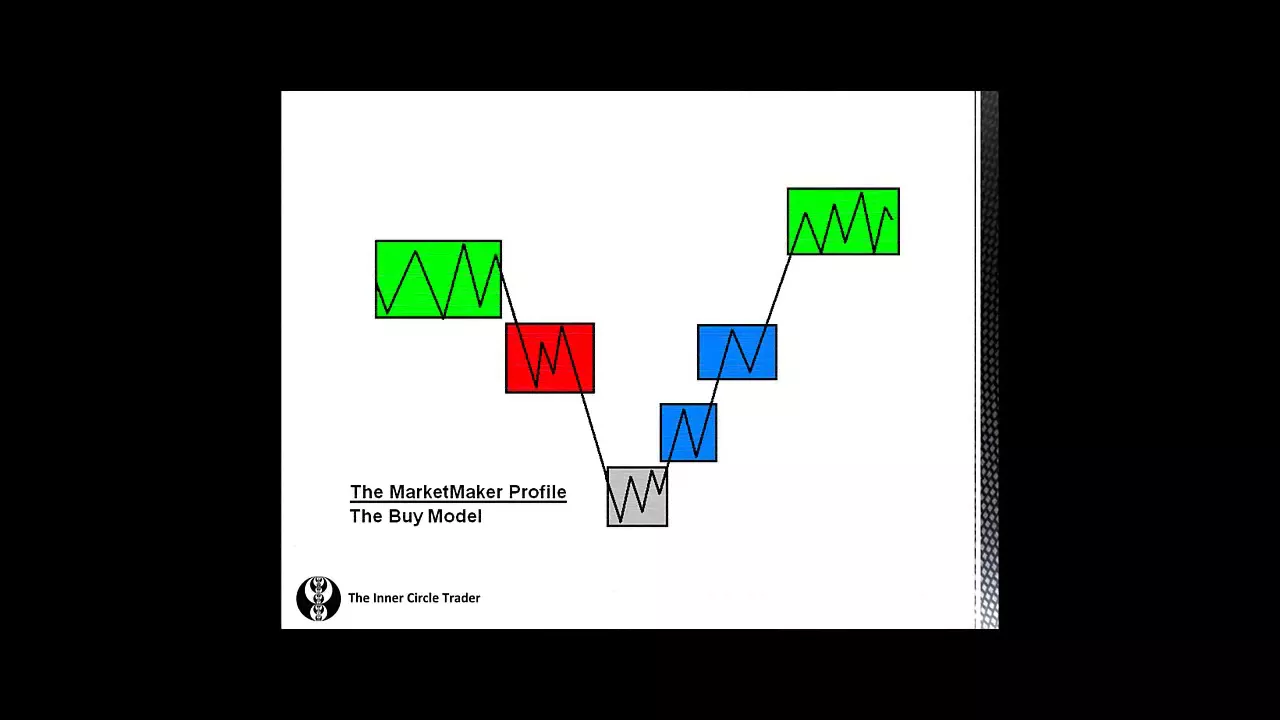
know I could go on and on and on here let's look at the actual market maker profile okay this is the market maker profile for the BI model okay and what this specifically is detailing here and it looks rather elementary looks rather simplistic but I assure you it's conceptually and how I trade okay this overall diagram is the basis on how I can anticipate price action I can anticipate specific targets I can Anticipate reversals I can anticipate continuations I can anticipate pauses I can anticipate price retesting previous support and resistance okay everything that I do
internally as a trader can be summarized with this very pattern right here okay and basically the concept is simply looking at how price in here okay you find a resistance level okay and in here this green box is the only kneading in solid Asian this consolidation is essentially happening or occurring Rather around a higher time frame hopefully nothing less than one hour basis resistance level okay so the top of this range in here really is assuming that we see a resistance level here so while prices in this consolidation as a prat as a pattern trader
you would be hunting climax reversal types patterns okay those being MACD divergence bearish type one bare stochastic divergent an ICT reflection optimal trade entry cell okay Turtle soup cell okay so those types of patterns okay or a hammer or a lot of guys call them pin bars okay if you see that in candlesticks up here that end is just implied resistance level those are all patterns that you would look for okay so you have a resistance level here you have a confluence of price pattern that could be a candlestick like a bearish hammer it could
be railroad tracks it could be tweezers it could be a whole Slew of different types of candlestick patterns but associate that also with an ICT reflection an optimal trade entry in here something else and maybe even if you're going to be utilizing an indicator not stressing it here but I know it's probably a foreign word to purists but yeah if you can find something indicator wise to support it also yeah you know it's just something else that you would you look to see what other traders may be factoring in to Current market sentiment okay so
obviously you'd be looking for something on this very short term in here as an overbought reading maybe it's the castex RSI whatever oscillator you use William for sin are anything that is you would be looking for an overbought reading in this in this you know consolidation area now once market structure breaks down okay and again we're going to talk about market structure and going in greater detail and how I use it but right now We're just giving a brief summary or an overview if you will market stocks are brakes it trades below the ranged low
here okay when we see that we enter a new phase in the market profile this red box delineate a new phase or segment of the overall profile now the reason why it's red okay in case you're wondering what's the deal with all these colors why even wise got to be specific colors well to me I'm on alert okay this is a red alert type segment of this market Profile or this fractal pattern that I'm looking at in price now this overall price swing down to present a buying opportunity this could be present on a one-minute
chart again I do not trade with a one-minute chart but you can see this pattern unfold on one minute I look for long 5 minutes 15 minute one hour for hour and daily ok so by having news timeframes okay in an understanding of hard times in support resistance levels When I see this pattern unfolding it makes trading for me and obviously when you understand how it works for yourself makes it very easy to anticipate okay and that's what you want as a trader you want to be able to anticipate things expect specific things unfold and
price action and then get yourself in sync with your anticipation of what price hopefully may do but there's no guarantee that's going to do that so that's the reason why we use stop losses So getting back to this box here why is it red well once we break out of this consolidation here okay and that specific price point I'm anticipating a retest of this specific support level now broken it's gonna be hopefully a resistance point okay so if price can trade back up and at that point I'm gonna sell okay in here if I miss
this opportunity so this here this high in here in this red box there are several Patterns you can utilize for trading in here you can use a turtle soup cell pattern you could use an ICT reflection pattern you can use a type 2 trend following which is a higher stochastics overbought reading here comparable to this previous high here okay between this high and this high you'll see overbought readings on the stochastic but this reading here on this high in price does the cassock will be even higher in terms of being an overbought So that's a
type 2 trend falling or you may know it as a hidden divergence ok bearish but again it's a nickname nice divergence it's a trend following the nature and he dubbed it as a type 2 trend falling or you could see a type 1 bearish divergence in here on this little small little range in here as well or you could see an ICT Grail which is an optimal strategy from this high to the low in here and wherever the retrace is up in - it could be a type 2 trend Following with that optical tradition which
makes it an ICT Grail pattern again if you don't know what these things are I'm more or less driving you back to the previous course videos and it's in the high probability price patterns video ok you'll learn all about those price patterns in that video module this red box here could also present you and I see stinger cell signal which is a optimal trade entry with a type 2 trend trend Following bearish divergence within the second overbought reading here this will be a type 1 bear's divergence that's what an ICT singer is so it's a
type one within a type 2 with an optimal trade entry confluence at a implied resistance level which would be here okay now getting back to the reason why it's red I don't have to see it retest here ok so this area here this is the one that has a lot of ifs okay it could break out and never retest that okay on Strong markets it will just continue pause bear flag in here and then move lower going down into the implied support level okay so this area here it can retest I like to see that
ideally but I don't necessarily have to have that okay now what does that mean for you as a trader in here on the short-term basis if you see this pattern unfolding over an hourly basis this could be as much as 30 pips or 50 pips here okay you start seeing this Paul's In here and you know you've probably got a good leg before it trades down into a higher time frame support level whoa what am I talking about selling short this is supposed to be a bond model yeah you see what I'm talking about if
you see this price pattern unfolding in your charts okay and it's clear that you understand this leg is going down but you necessarily don't have the confidence needed to be buying boldface support levels here okay you you would End up catching the by maybe on this side here after the breakout and the break-in market structure then a retest and then maybe you're a good candidate to be a buyer there but not necessarily down here in the gray area if you see this pattern as a sell obviously don't be limited by buying two descriptions okay to
me this is a buy model because I'm more focused on this higher time frame swing lower because the market is being engineered to go lower into a key Support level that I would imply or expect rather to see price bounce down here assuming there's a higher time frame monthly weekly daily for our one hour support level down here too anticipate a price movement higher now assuming that we saw a price move out of this area here okay that's fine it goes down to the level we're anticipating a support level to be unfolding when we get
to this area this is the gray area because we don't necessarily know that That support level is going to provide support at all okay you may get a small little bounce and this area here this is where you'll have to take first profit why is it blue okay and why is this one blue because if you do buy down here on this support level okay that would be down here that we're assuming based on a hard time frame premise look at the range okay you have this high to this low as price starts to move
up okay if we start getting back to old support Broken now resistance this could be an optimal trade entry to continue even lower so you want to take some profits here move your stop to break-even okay and then have your remaining portion of the trade reach for what level here this one here now this in this specific point here you could see a tight two trend following an optimal trade entry for an additional buy again okay bold flag in here.we rallies on up and in here between both these blue boxes or Even the lows in
here ICT singer buys ICT grails okay type two trend following those patterns could be seen on the upside in here so that's how you hunt those okay anticipate those types of patterns forming on the impulse move up away from the higher time frame support level what's so specific about this area well go back to the range here's the high down to the low you want to be taking some profits here because you may be pulling up international trade entry Based on this previous range here to here so why not take some off again but still
leave that stop down here okay don't move the stop until we break out of this area here it's got to cancel out this optimal trade entry from this high to this low because this one here the second little blue box here this could be a continuation okay we're going to talk about that later on it's a by model that really is transforming or mutates into a Continuation lower okay it'll be a trend following going to lower and we'll talk about that again in greater detail actually walk through it now as price goes on higher obviously
this previous consolidation those participants that are higher timeframe premise or position traders they're not going to be in a rush to the lower stops down above this high or this high okay they're willing to sit back and allow price to retrace deeper but their stop-loss orders gonna Be wrestling right above this highs that's where you take your profits on your short turn trading okay always look to take your profits on short term trades at logical areas of stops okay any previous highs okay as price moves up look to take profits there because there's a popular
liquidity that will offer many times outstanding areas to take profits now why do you take majority if not all your position off here because this could be a reversal And trade very very deep into the range between the low made here and the high here or below here to the higher why sitting through all that drawdown without taking profit it doesn't make any sense to me okay this low here to this high that range it we could be deep could pool deeper in terms of retracement and still overall trade higher okay but take some profits
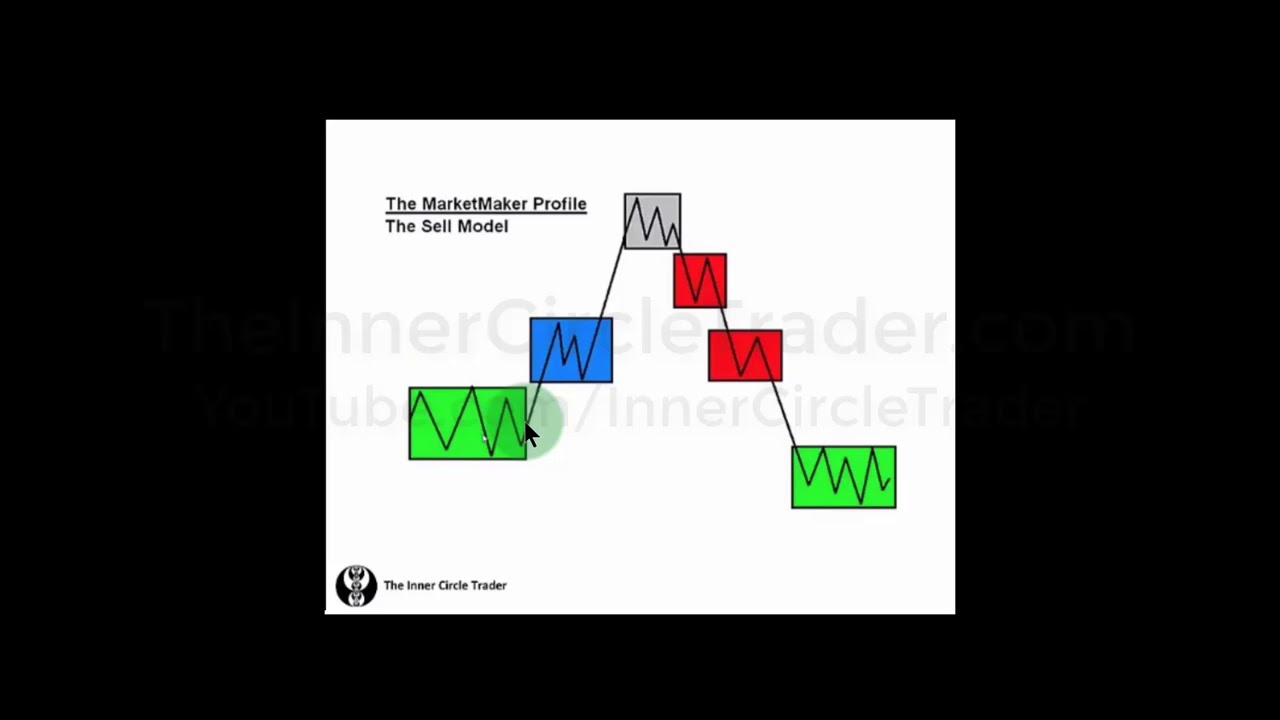
or here's the here's what could really happen you could take this position and See profit all up here and never take anything off and watch it come all the way down and trade and reverse completely against you that can happen guys I know it doesn't seem like it could because we all want to be right but it's not about being right okay it's about being profitable all right let's look at a market maker cell model okay this one here this is actually how I learned this pattern I Saw this pattern before I saw the by
model and it's because I my belief is I think the market is predisposed to go up everybody thinks buy and hold you know and buy and sell it so to me in this pattern it makes more sense to me but usually you see a consolidation in a support level price makes an impulse move up okay and comes back down doesn't have to finds old resistance broken now support and bull flags in here now you can get a type 2 trend falling in here a Lot of the continuation patterns we discussed earlier turtle soup false previous
low taken out stop rage which so you know something that effect moving up into a higher time frame key resistance level okay so you're anticipating the consolidation to run up into a higher time frame resistance then a break down okay and then obviously every test is what we're looking for okay but over here the focus is now going to be on are we seeing trend Following signals like type 2 ICT stingers Grails ok to imply continuation moving lower bear Flags something of that nature because when market structure breaks in here and we're gonna take a
look at examples of that we want to see lower prices because this area here will be an area of pockets of stops resting right below that that's what we're capitalizing on we want to get short at a resistance level but this is a gray area again we don't know with any Great certainty or you know assurity really that this is gonna be a high we're trading it with the anticipation that it will be based on a resistance level that we may see up here based on a monthly weekly daily four hour and nothing less than
a one hour basis so this swing lower is what we're looking to capitalize on down into this area where we would run the previous consolidations area of stops okay now again going back to that same premise Why don't I give you specific details on how to trade it with a specific plan conceptionally you may see this as this area as a buy in this area to take your profits at or show your stop loss at and then eventually get tagged down and that's your profit from maybe in the consolidation buying an awful trade entry by
you here or an ICT reflection in here or in SN T bullish diversions something that's a climax reversal could be a reason to be getting along in here And this is your confirmation in here it may be even bought this okay and then looking for it to move even higher you know this could be your trade in this consolidation or pause to here or consolidation beginning to end here this could be their whole trading career this is this one pattern this one portion of the the fractal just so you can see how it could be
utilizing again I don't teach this and I don't advocate it but just so you can see it you could be a Scalper and see a higher time frame and resistance I like that and when price breaks down here these smaller little price swings inside this area here using fit extensions you could be taking profits down here and this could be your scalping career right here okay you could be doing that once a day and then just be done make 10 15 20 pips and beat walking you'd walking out the door see you later again I
don't trade like that I don't Teach that but I just want to show you the universalism to this pattern that's easily applied to all types of trading styles but generally we're looking for this area here to sell into a higher time frame resistance level with this premise unfolding okay the larger leg and price is going to be the high down to the low blowing out the previous consolidation all right now some of you probably all recognize this pattern that seen my London open trading video I Released a couple years ago but I took down because
I really wasn't pleased with the overall presentation of it so I am revamping it and that's what part 7 is really highlighting it's this you know the center for a flagship of that module my London open tactics but this area here between here is high in this low this is the lion's portion of the move and this is a very easy aspect of this rattling fractal this this pattern or the leg of The pattern is what we're looking for okay now inside these red boxes you could see type two trend filing again I see reflections
continuation patterns of all sorts okay and obviously optimal trade entries from previous highs retracing okay and every retracement should set up into another optimal trade entries going lower reaching for this area of consolidation we're underneath it will be resting stops and again we're looking to take profits at logical areas Of we're stop-loss orders would be okay alright market structure look at this it's not the best obviously but it will accomplish the means I'm sure when you're looking at price action okay it's probably easier okay this is how I did it as well well my computer
when I started utilizing computer charting and not use paper charting because I started as a commodity trader actually actually drew my bars vertically and put the little open tick to the left and closed Tick to the right and I did that for all the commodities I traded and at the time I was doing about 15 different markets which was stupid because I didn't know what I was doing I thought I had to be and everything but I learned hey I found out by taking a step back okay and looking at the charts on my screen
from across the room I could see the price swings very easy that way and it really was a the premise that I was always too zoomed in I needed to be on that One-minute chart I need to be on that five-minute chart because that's where the money's gonna happen and it's not how it works okay so this depiction of market structure hopefully and if you don't see this try that put your computer screen alone and watch this video or watch your charts and sit across the room okay hey there's a look at it do you
see the price swings on this chart it's obviously not a price chart it's a hand-drawn diagram that I've made in just paint on the computer okay just for simple crude demonstration but hopefully you can see the price swings here you have this leg up then you have this leg down a retracement then you have the second leg lower you have this price swing up you have a retracement then you have a second leg up okay now looking at that you can see peaks and troughs highs and lows okay and that looks more or less like
this Okay you can see that we do have short-term highs and lows in the marketplace here assuming this is a currency pair or a stock now these little circles okay are essentially what we used to call ring highs and ring lows okay this is a premise I learned from Larry Williams and whenever the market made a short-term high or low and that would be a low with two higher lows on both sides of it so it's a three bar pattern and whenever you had a high with Lower high on both sides of it again three
bar pattern that's a swing high whatever that appeared on our daily charts we would make a little ring around it or circle it okay and how those levels mapped out comparable to each other okay you can discern the overall trend of the marketplace without having trend lines on your chart without having moving averages on your chart without having any real anything just except for price price telling you what The trend is okay and because I'm a swing trader by nature this to me makes greater sense than having moving averages trend lines and looking for the
picture-perfect trend line or trend up or trend down they don't last like that guys and when you see it clearly as a trend it's over okay that's about one that's reversing or it's about the reverse soon so by looking at price in terms of swings okay that's what helped me as a trader taking small segments of The market and breaking it down and mentally modulae okay and in digesting it like that I learned that you could be very consistent in seeing where specific price moves up and down will unfold but looking at this chart here
it's pretty obvious that these are short-term highs and lows but if you haven't already noticed there's other highs and lows here notice that we have the blue rings here okay these little areas are intermediate term Highs and lows sounds cool doesn't it well essentially what that means is this year you have a high and now I'm assuming here that there was something on the other side here so again this is just a crude demonstration of what I see in the market place in terms of market structure there's a lot of guys on YouTube talking about
market structure a lot of Forex quote-unquote mentors talking about market structure okay but I don't think they utilize it in the Capacity that I'm teaching here and I'm not claiming originality here guys I'm all I'm doing is passing the baton to you I learned it from Larry Williams one of the best traders there is in terms of price action and you may see him as a price trader in terms of price patterns but you know his early works in terms of market structure and and that nature man they're just timeless they are absolutely gems if
you can get hold anything that Larry Williams did early On all his books great things just get it looking at this overall crew diagram okay now by looking at it when you see a short term high here with a high and a short term high lower so in other words you have a high here with a lower high on both sides of it this is an intermediate term high okay if you have a enemy term high over here with an intermediate term high over here this makes this a long-term hi so entering a term high
and long-term highs And lows those are the specific swings in the marketplace that you're looking for so having a market or chart rather noting all the swing highs and lows on a short term basis it may seem daunting at first but by doing that you'll start seeing there's specific highs that are higher than two previous short-term highs again that being animated term high if you see that enamine term high with lower enemy return highs on both sides of it that will classify that as a Long term high okay now as price breaks down okay and
you start seeing enemy a term lows and you have another enemy a term low if we break market structure at any time in here okay that means breaking short short term highs and lows in here we break this short term high here now market structures broken to the upside okay price comes down makes a low but it never breaks that long term or enemy internal oh here it rallies up and again breaks its previous high here so We're breaking highs and maintaining higher lows okay do you see a trend line on this chart no you
don't need them okay you see a moving average on this chart no you don't need them okay so as price starts to break ties in here you see market structure being bullish eventually at some point you'll see the enemy at term high here formed now look here is the main thing I want you to see if you missed this getting long and you miss this opportunity to get long and Sync with it if you see an enemy a term high take out a previous intermediate term high is market structure bullish or bearish it's bullish okay
it's bullish so even though you'll start seeing these short-term lows and highs in here and I think this is what gets everybody confused it's okay well market flow has broken to the downside here so now I'm gonna be looking today a seller why why why what are you thinking That's not as important as the overall market structure market flow is gonna go up and down all the time then upon whatever timeframe you're looking at if this is a daily chart okay this being a bearish market flow here that's fine if you're a day trader you
might even see it trade lower but generally you're in a bullish market environment cuz this enemy entorhinal return high so the trend okay is bullish the market structure is bullish I would Expect to see expansion to the upside okay or another new leg up what do you mean by that what's the previous leg well here's the enemy in turn hi where's the enemy a term low or a long term low prior to it down here so I'll be utilizing this swing from this low to this high at some point when the market makes a low
that's tradable okay I would look for that same price move from this high to this loan terms of range I would add it to Whatever that buying point is to the upside okay now would give me you mean my measured move type of analysis okay so even though we start seeing all these little short-term lows breaking and it looks like market flow which is not what I'm teaching here I'm teaching market structure okay because it's that's to me it's much more significant much more stronger in terms of analysis that break above an area term high
here that to me Is significant because now even though we see a retracement all that's going to be is a low to that internet term high as it retraces what you're going to do it's going to retrace down to optimal trade entry and I'm going to buy that and once it has its first impulse off of that if I missed it the first retracement there that's where I'm buying for an optimal trade entry so this is how you start anticipating okay these fractal patterns to unfold Okay these buy and sell models on the market maker
profile okay because you'll start seeing these things unfold with this premise in mind okay so we've hopefully arrived at where we determine a bullish or bearish market structure okay alright we are looking at a mountain and it's not a mountain guys this is depicting a rather crude overall swing high okay or a upswing in the market place okay that we would utilize for going short okay because our belief As professional traders using technical analysis and price action price action is engineered to go up first to go down okay so price goes up to go down
and then price goes down to go up looking at this crude depiction of a market swing up if you add to that levels of predetermined key support resistance levels okay in other words you would anticipate okay you're gonna anticipate at some point over here price of a rally up but as price rallies up okay if we Have a bullish market structure think now if price is trading it around in this area here if price is at this point bullish on the market structure and this is a key support resistance level okay if price is going
up to it do we anticipate price to trade here and trade lower or do we anticipate price breaking that and coming back to it and find the support hopefully the latter okay the higher time frame premise is going to have more weight so if we are looking For bullish prices we're gonna have more influence or expectation rather on seeing support and resistance levels being broken to the upside and eventually coming back and finding support so these levels we would have more credibility established on the fact it's gonna break as resistance but then come back and
find the edge support same thing here as price rallies out through this level here we expect it to give way On the upside but then find likely support here later on okay if it trades back to it same thing as we're trading ups into these resistance levels you can anticipate price giving way as broken resistance but will lend support okay again we get to a hard time frame key resistance level okay when we see this this may be a very higher timeframe daily weekly monthly okay or could be a big figure on top of it
it could be a monthly high on top of a key resistant Level a lot of factors overlapping this specific price point making it a key level we would anticipate the reversal here and then obviously with that expectation we want to dissipate two support levels to start breaking down and then once they're broken we would anticipate those support levels to be more influential in price in terms of resistance okay and again going lower this level here we wouldn't see it give way as support break it and will permit Price to come back to it but lend
and anticipate it to be as resistance as price moves lower again we wouldn't see support be broken but we would be comfortable with it being retested as resistance and then trading lower obviously into our objectives so what does that really look like in terms of price swings with that same model and well here's a crude example obviously we'd see price straight up to these levels maybe even offer very very Short-term resistance and that was what we expect okay but we're really anticipating price to break through these levels as price moves higher will permit price to
find support there but being cognizant to the fact that price is not going to always stop on a dime allowing slipping through our predetermined levels now when price does that this creates new shorter term supporting resistance levels so while these may be higher time frame support Resistance levels respectively as price moves anjaii rates between these levels it's going to create new support resistance levels on the lower timeframe so they're going to be useful to us in terms of short-term trading and obviously the better signals will build around the higher time frame support resistance levels but
don't be afraid to take trades in sync with you for all model okay or direction if it provides it even if it's on a shorter term so in Other words if this is a daily okay these short-term lows in here could be traded on a one-hour or 15-minute basis and surely with a five-minute chart okay getting in sync with the higher time frame surge up into a higher time frame to use distance level and then slide lower on the other side of this fractal okay so again as price starts to break down over here and
market structure is broken you can get your standard optimal trade entry bears patterns okay anyone Start seeing these levels provide you resistance okay and if it trades it to as support it should be very short-term very little momentum up okay that's what you're looking for the key is you want to see very little bounce to the upside that's your clue that the levels are going to break down that support but will be more influential as resistance on this side much in the same capacity on the reverse as price was moving up here the these levels
will provide very Short-term resistance but eventually give way but be very influential in terms of finding support much in the same capacity of looking for price swings higher for selling dips in the marketplace obviously our new difference just simply reversing the rules assuming that we do have key support levels okay these being noted here same premise in mind that as price was moving lower we're expecting these levels to break away and if price trades back tone Again they should lend resistance as price trades down into a higher time frame key support level down here we
would anticipate that reversal here okay and this would be an ideal indication to apply the market-maker profile for buying the K of the BI model and as price moves up higher obviously the resistance should be broken but permitting price to come back to and find support again looking for price to breakthrough but allowing Price to come back and find support this is the overall price swing down okay and the concept that I use for supporting resistance and how I measure and anticipate a specific price level and if it's an overall profile that's bullish I'm gonna
look for resistance to provide support more than resistance okay and I'm looking for confirmation in that in terms of price action what does that look like what a crude depiction of price obviously it looks like this on The levels providing short-term support but giving way coming back finding resistance but permitting slipping not expecting price to always stop on a dime and looking for obviously all these levels the give way but looking for more in terms of these levels as resistance than the RS support then the higher time frame support level causing the reversal this would
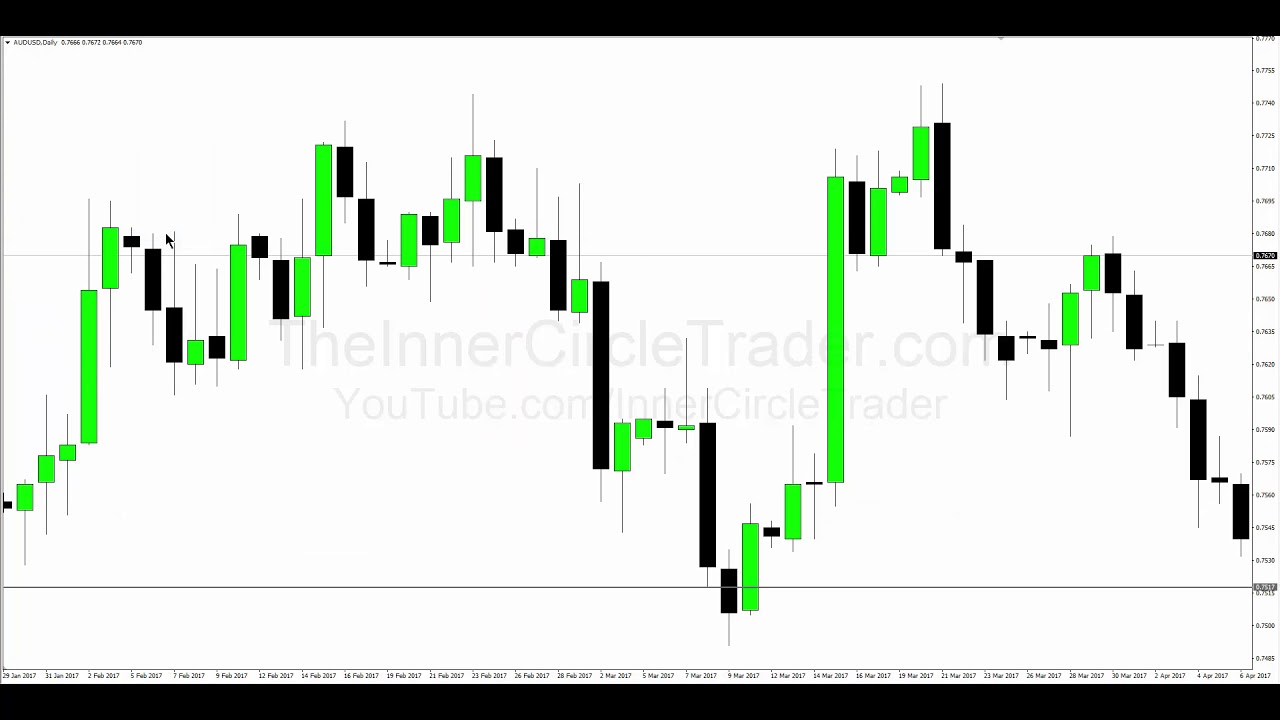
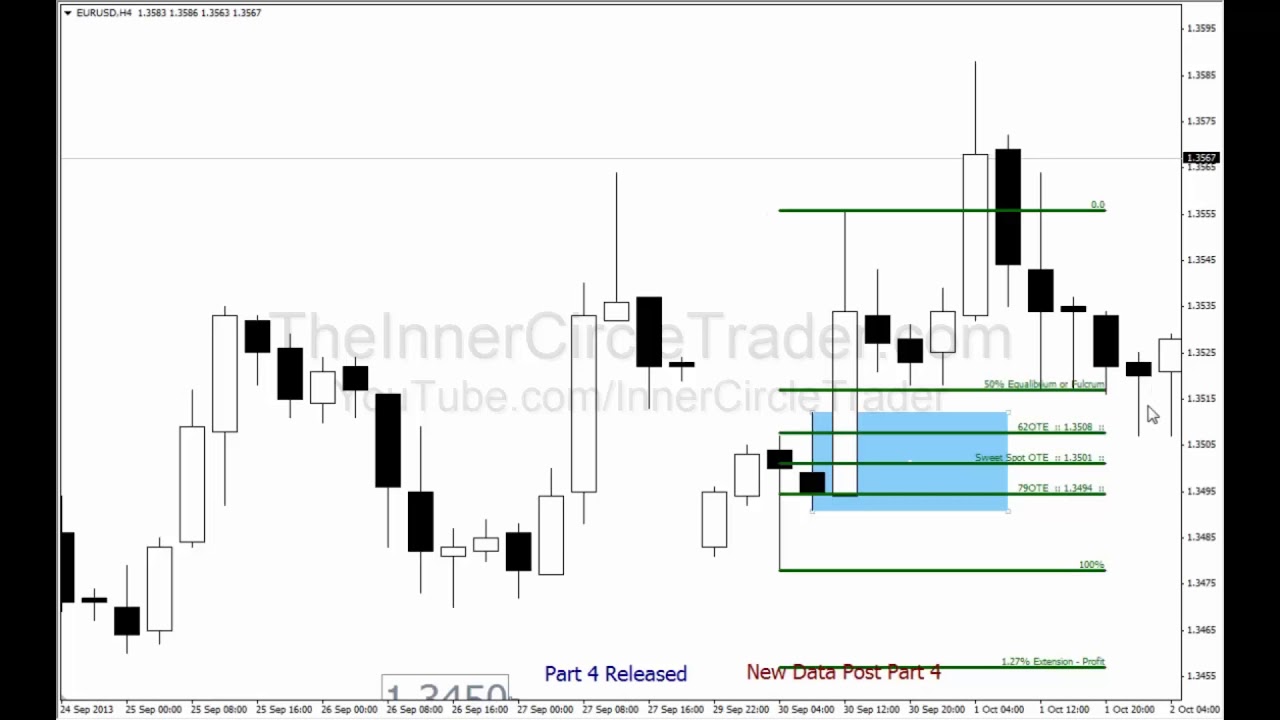
be the market make a profile for the buy and then obviously looking for upside breaking all the levels as Hopefully the market provides a little to no resistance but lending at these predetermined levels on a higher time frame monthly weekly daily for hour and one hour nothing less than a one-hour those levels that will be clearly discernible in those higher time frames to provide support for price okay we are looking at the Australian dollar this is a daily chart okay and some of you that were at the webinar that I did with mr. Chris Laurie
we did A webinar together and I highlighted this very level here in the 101 50 on the Australian dollar and before we build on this example I just want to clearly discern and this is a real quick rehash of what was discovered in that presentation if you use this low here and the high here this red line here is essentially around the 50 percent mark or level of the range between this high in this low and it is a mid figure point in other words it's a 50 level 101 50 This area here is we
would anticipate an opportunity to get long in here or a bye okay so we're gonna use this whole thing in terms of price action this is a small little sampling okay to how you utilize this market maker profile and not just the buying scenario but we're also going to look at how it could be utilizing that small little segment of price action a could be a seller as well all right we are looking at this specific area in price okay this little Gray box it's going to delineate the very nature of a market like a
profile we're gonna talk about how using this reversal scenario okay because that's what this is being taught here I'm not teaching you trend-following short-term trading like the short-term trading video module does okay I emitted the reversal okay or pure support resistance plays okay that's many times very difficult for a lot of traders to do it's easy to trade with the trend and I Teach that first because it's easy to do this type of trading takes a little bit more finesse and it takes a lot of confidence in your ability to read price and I understand
what key support resistance levels are but obviously looking at daily chart the 101 50 level and the fact it was in a mid point of that big large range and just put a 1 on 150 level on your chart and just study how many times it has been support resistance over the last number of years Really and you'll quickly the CERN that is a key support resistance level so we're going to drill down into this small little box here okay essentially and break this whole thing down and utilize the market maker profile in the Australian
Dollar all right inside that gray box there's a smaller little range this small little range is where all of the busy bees were doing all their work busy bees in this analogy it's the smart money now the Smart money will accumulate during consolidations okay and here's what I want you to think for a moment imagine smart money the central banks and the big dealers okay the guys that are the movers and shakers in the marketplace okay if this entity that we're gonna quote-unquote call smart money okay they are the big dogs that have big players
in the industry we're gonna more or less think of them as a Tyrannosaurus Rex okay there's a big dinosaur okay that is The carnivore of all carnivores there they are it okay apex predators by definition if this big dinosaur okay wants to jump in the pool all right and the pool being the marketplace that's assuming for a moment the dinosaur that is smart money because it's so big okay it's so huge in terms of its ability to move the marketplace if this dinosaur smart money jumps into the pool what's gonna happen it's gonna be a
huge Reaction into the water okay and number one the water level is gonna rise up quickly okay and it's gonna make a big impact okay a big splash in the market you see that in price action okay if there's a lot of buying during a consolidation and price moves up out of that okay and it moves quickly this dinosaur okay knows that it can't buy a lot and not move the market okay it's gonna create a demand so if it wants to assume A position but it wants to get an average price okay in other
words smart money wants to get involved here okay it sees value here it'll buy some but because it buys inserts large quantities and creates a short-term demand for it okay it will wane off its buying an allowed price to move back to a more favorable point okay or equilibrium okay and they'll buy a little bit more okay and as they buy it'll rally up even more now they don't Want to draw too much attention and they don't really want to see price move too far away what their average hopeful price would be okay so they're
looking at price eventually moving lower okay and it's moves back the lower into that same consolidation area this specific point is where they're going to accumulate more of that same position okay so they're that dinosaur wanting to get in the pool so they're gonna go in that water one leg at a time slowly but Surely putting themselves in that water now by doing that yes the water level will rise it'll rise up quickly at first but then it'll wait for the waves to settle smooth out a little bit and then it'll start to put its
new leg in I can then slow lower in its body and eventually once it's down into its shoulder length the mark will be all up here okay and at that point everybody in the market will say wait this is a bullish market let's get in here and Start buying it so we don't want to be buying when it's obvious okay we want to be getting in there when that Tyrannosaurus Rex is lowering one leg at a time in and we'll know it okay we'll know it when it happens when it starts to move up out
of the consolidation we know that that large entity we know and call smart money is on the move it's doing something because the public's not going to make a rally up like that okay only institutional level trading is Going to move price same way it does here there's going to be an absence of interest on the buying aspect of the market so if the institutions are not willing to buy okay what's gonna happen price is gonna fall in a bet and if they do selling in here it's gonna cause capitulation which is what you see
here as well but price trades down into this higher tiny frame 100 150 level and I have a smaller short-term level here but we're not gonna talk about that here We're just gonna focus on that 100 150 level so we have a higher time frame support level and then prices in out of this range okay we would expect accumulation to be unfolding now again we don't know who smart money is we just know that the smart money entity itself it's gonna most likely work its way in the marketplace here because it we're at a higher
time frame support level so as price starts to break up out of here okay this area sets the stage for what We want to see the market maker profile we're going to start seeing the characteristics that these market mega profiles provide for us in terms of anticipation in terms of price action so let's go in and look at this specific segment in the marketplace again this is the Australian dollar okay and we're drilled in to October 7th and 8th okay and here's that area where we sold off so we had a consolidation in here price
broke down moved into another Consolidation at that higher time frame 101 50 key support level price inside this consolidation it moves up out of it okay and this was the first indication that we had smart money enter the marketplace okay without looking at all this information over here cuz we're gonna come back to that in a little while this price action here is very very symmetrical and okay in the Lord's there's a lot of symmetry to how price is moving in here it's nothing that you Can't see on your own after some study but what
do you want to what do you want to focus on here is the nature of the buy model okay I want you to look in this example and find the buy model can you see that buy model in this small area of price I'll give you a moment to look at it okay then looking at price action okay again focusing on this area here this is your cell model do you see in that same example in terms of price action do you see an example of where That cell model can be found in this small
segment of market of price again I'll give you a moment or two to see if you can find it and I'm gonna give you example of it so don't worry if you can't see it because just an exercise of observation okay and now looking at this example in price when we see the market maker profile setting up and we're going to give again very clear examples inside this segment of price you can anticipate what's gonna most Likely unfold again it's no guarantee that when you see these things it's gonna happen exactly to script but to
me this is how you know I look like you know an ace in the videos because I'm calling specific price swings and Pacific levels before they happen now again looking at price here if you're looking at price here can I put a little hint here to you this area here is an area where that profile unfolds can you see it now Again I'm going to I'm going to give you a greater detail example but do you see this little consolidation here think of this consolidation as that okay in this little area here is this pause
in price doesn't look like much of a pause here but it was and then rallies up makes the high here so that's the zenith of this price move I'm sorry this price move here this zenith is here in the profile model then we saw a price slipped down as market structure breaks which is what Happens here then you have the optimal trade entry here and then price slides the lower taking out the low or the previous consolidation here as noted here okay so inside of this area of opportunity there's a good chunk of pips that
you could very easily harvest intraday okay not necessarily a long portion of time it's just still an opportunity for you to take a short term trade looking at this example okay where is the market Maker profile for the buy this area here is this consolidation this pause in here is this area right here notice how it didn't get back up to that area like I was stating before it was too weak there was no there was no demand for it so there's no demand there's gonna be a lot of supply so supply is gonna come
in sell it off and you can greater move down into a higher time frame support level and we move into a consolidation which sets the tone for the market to be In this stage here okay now we're hunting a reaction in the marketplace right here so as price moves up out of it which is what we see here price comes down retest it like we like to see here and that's this area right here and then price moves up which is what you see here makes the pullback in here and you see that here now
price fails to go above this high here okay so it doesn't get above here so this is why you want to take profits at logical Areas which is here and here again being here and here okay because you're working within what range this high to this low so this could be an area of opportunity to take profits and obviously here because if you look at this high to this high you're in the same concentration level okay and that's probably start the rally again it failed and moves lower okay remember I was talking about how between
this high and this low and the module for the buying Price at this point okay when it starts to go higher it may not get up to this level here it may come back and retrace into the range between this low and whatever highest forms here and you see that forming here from the low and the consolidation up to the high all we did was retrace deeper and what that does is allow the market makers to take out the stops that are on the right side of the marketplace okay and retraces from this low to
this High and you find out that will trade internet to 62% at a certain level and then price starts to resume and move even higher okay so now take a step back okay and if you if you can't see it on the five-minute chart like this let's take a look at it one a 15-minute basis okay we're zoomed out a little bit more thinking in terms of that same buy model okay watch what happens we're using that same 15-minute chart now we have that first consolidation up here we have the Gray area down here where
the buy should take place where here we have price now move up and now this is what this is that pattern right here but if you're zoomed in a five minute we expected to see it here but now we're looking at a fifteen minute suddenly the fractal can be seen on a higher time frame still the same price segment moving okay higher but we're not seeing it to do the same unfolding that we'd sell in the five minute we are expecting to see it Trade down here and then move up and while this was profitable
yes okay we didn't see what was unfolding on the fifteen minute because we're in too tight now suddenly this consolidation and then move lower down to a key support level 101 52 run up and then trade back down into this area here is exactly what you see here okay so the market makers were using the 15-minute time frame to do they're dealing okay so watch what happens Price rallies up here okay and then gives you that other retracement deep here okay and it rallies on up to do what to take out the previous consolidation where
the stops are resting right here and that's what they do here they clear out the stops okay so you see how this model gives you the ability to anticipate price action and swings in the marketplace okay now if it's not clear to you I understand it's going to take Some examples and some time used to looking for it and you look at hindsight examples for a period of time and it may take months to get the perspective on seeing it okay but when you see it you can't ever forget it it's there it's gonna be
embedded in your brain now looking at this example here okay this is that one example I mentioned earlier that I was going to give you a greater refined example of it we have this area of consolidation price runs up out of it There's a little pause here it makes the zenith breaks down comes up gives you a little trade industry and if falls out of bed or as it go below the previous consolidation so what do you think module that is the market maker sell model look at the profile here okay you can see the
D have the consolidation here which is here to move out in the pause in here here the zenith of the move right here which is here the breakdown and the optimal trade entry in Here which is what you see here and then the move lower to get below the previous consolidation as noted here okay just between this high and then move below the low here that's rather handsome in terms of a very short-term trade and you can take 40 pips out of the marketplace rather easily here okay so now let's take a look at again
that consolidation what's specifically is different about this market maker profile that isn't seen in the previous ones okay because Overall inside this higher free market like a profile okay notice that we had that consolidation out here and in the higher time frame fractal moving higher this is a bullish scenario overall remember that 15 minutes right we just looked at but within that larger 15-minute market maker profile or that fractal pattern that's bullish we just pulled out a bearish cell model so again that's the reason why I don't give you specific entry pattern concepts to trade
You know on a short-term because it's so dynamic when I give you this for instance looking at the cell model here you may just see the buying aspect okay you may see just the here's the optimal trade entity to get long we're in a nested optimal trade entry here so I'm gonna buy that so you're you're using this profile to be long in here or long in here to get this as your profit objective and maybe your line doesn't understand to get to this point here you Know this could be the cell okay that's fine
it's all about profitability it's not about being right okay and when you trade fractals okay it's a lot of freedom but there's a lot of rules too okay so it's a freestyle way of trading without bias really if you think about it and that's the nature short-term trading you can work with in a bullish market environment and be a bear but you have to understand what you're doing and it takes a little bit of finesse okay But if you look at just the bullish market structure and trade bullish market maker profiles it makes trading very
very easy and if you just understand the sell model for the buying portion of that fractal which is here here or here there's nothing wrong with that absolutely there's nothing wrong with that that's your short turning search term trading niche okay so that's what you would utilize for your trading okay we just looked at an example okay And how the market maker profile on a short-term inside of a larger higher timeframe fractal appears to fail okay but what it's doing is actually it's giving you a continuation of the larger profile okay and let's look at
what that means assume we have a support level here and price moves from that specific point and breaks market structure okay so when we have market structure break like this this will give us the indication hopefully to anticipate Higher prices and when higher prices hopefully come on their way now we have the green light go looking for now anything that retraces from this point we're looking to hunt an optimal trade entry to go to long and when you have that okay you're in you're gonna see price meander it's gonna move okay you come back to
your charts and it looks a little different and it's fine and this is the part of trading that's hard because you have to wait for the setups And every time you come back to your charts it's gonna look a little bit different okay but you're stalking you're setting up okay now looking at this chart here we have our higher time frame support level but now also we have new support resistance levels you have to factor in okay and because as far as just this has never exactly to the pip you'll allow for certain slippage but
if you're waiting for retracements retracements don't Always go back to the levels okay retracements will read a little bit early and this is where you can use the double-o 50 optimal trade entry levels okay double-o 50 i means using the big figures and the mid figures to pull your fibs from in using swings okay and i'm not teaching that here I'm gonna counsel you to go back to the other videos and learning about that but looking at price obviously you see price did in fact snap up from an optimal trade entry okay and Now looking
at this okay you would expect to see price do what move inside of a cell model okay so you're expecting price to find its zenith in here and start to break down lower looking for what looking for that lower low in the previous consolidation or beginning of the price move up so this overall price swing we're looking for it to move down here but if you're in a higher time frame bullish scenario within bullish Market structure or a more higher timeframe bullish market maker profile you're gonna look at this area here to see where price
may form a new buy in other words in bullish environments the sell model won't come all the way down here it's just going to give you a higher time frame retracement on the overall swing here okay and what that looks like is this you have price come back down and you see price coming all the way from its zenith okay and which You anticipate if you're just looking at the model itself looking at how price moves lower you're not expecting that lower low so as price starts to move lower if we're in a bullish environment
we're not looking to see price move back below this consolidation we're gonna expect price to come back down and maybe retest this support level or work within this optimal trade entry range here or this optimal trade entry range here and maybe even factor maybe pivots maybe a Trinity level oh how about that we didn't talk about that yet have we so then you would be looking for your implied support levels to be a factor in this retracement as it pulls back into a deeper price swing and by having that expectation as price starts to move
into these support resistance levels again we're going to have more emphasis placed on this then looking for the previous low here taking out four stops because the smart money's assumed a position Back here okay they're going to defend that price action as price starts to come back down here they're going to accumulate more of that same position here it's counterproductive for them to come back all the way down here okay when they're trying to get price you know higher or at least maintain a specific price level so that's why we see these overall declines deep
retracements within a bullish market environment Because you're seeing more accumulation unfold by the smart money and what that looks like obviously is a continuation and you see the expectancy of a retracement to a support level and then a bounce and right here if you miss the opportunity to get the support level okay you can see a smaller short-term optimal trade entry forming here and you can utilize that as your entry for short-term trading to get in sync with the higher time frame market maker Profile okay this could be a five-minute price action and basing your
trade or on the idea that you're on a one-hour or four-hour market maker profile that's bullish and by seeing that unfold then you would see obviously price move on higher this is the range that you'd be utilizing here the low to high this confluence may be a 62 it could be a sweet spot it could be so nice at a certain level there could be pivots in here it could Be a Trinity level in here there's a lot of factors in here but and obviously looking at previous lows is the key because if they're going
to take price all the way down to run out old low for stops but not necessarily the beginning or consolidation of the overall price swing up okay so this price swing up is going to be a continuation and move higher and overall by looking at price in that respect you can see just looking at this this is a Very rather generic depiction of price action but it really is seen a lot of times when you are in a bullish market environment in other words if price is overall bullish this is the type of price action
you end up seeing higher high and higher lows how about that no necessity for trendline obviously the same thing can be said on the reverse looking at a key resistance level like this during a consolidation you would expect to see Price eventually moved to a point where it breaks market structure and that looks like this here and it's the market maker straw market structure shift rather and we would be looking for price action to do what move down into a market maker profile for a buy ok so because we're trading from a key resistance level
we're trading lower McCain eventually trading down into a key resistance support level okay in other words we're expecting price to Eventually move so every time we come back to our charts we're seeing the expectancy of what we're waiting for it to trade down to a support level okay and as price starts to move back to new levels of resistance we anticipate price to react accordingly but doesn't necessarily have to trade back to it okay again as we retrace we're looking at what price move from a high down to this low so we have a new
range price can come up Necessarily fall short of this okay and you see this probably in your own trading many many times where price fails to get back to that point but in terms of the range okay we went back to 62 79 or maybe to meet mid point seven the point five sweet spot that I use for my optimal trade entry and eventually sells off but in here this could be a reflection pattern this could be a turtle soup okay it could be type two trend following that nature okay and you Can use this
by mile that would be hunting initially okay as an area just to get short in the marketplace but as price starts to move down and we trade into what will be considered a higher time frame support level okay we would anticipate price bouncing and you start to see the early works of an optimal trade entry in here okay so you could be a buyer here with the expectancy of the market maker profile by model unfolding and as price starts To move up okay one would expect to see what well looking at a price action you
would expect to see higher prices moving even even further up but if you're thinking just in terms of this buy model and not taking into consideration the fact that this could be the retracement here for an over continuation lower we have a bi model that's going to mutate into a continuation for a sell-off and continue lower okay so you always have to be Cognizant of that happening and that's why we always use the previous range okay so looking at that you have this high and this low price is retracing into this into that okay that
could be an awful trade entry that could be unfolding inside of your expected price move so even though price and cancel that we go back up into a higher time frame resistance level but now we have this range still to consider this high to this low we're at sixty to seventy Nine percent retracement in terms of that range okay so even though we would be hunting this by model okay market maker profile we still have to be cognizant of how this may unfold into into a trend following continuation lower and by that you would see
price start to give a little trade entries in here on this lower timeframe and it starts to break down and this is the reason why we have to take profits because simply taking a position Assuming it back here at an area of key support resistance but the expectancy the price moving up into an old salvation to run stops that's too myopic you have to have the the the the ability to accept the fact that you're probably going to be wrong okay and you're always wrong until you take profit okay so if you see price starts
to break down like this obviously you're gonna wish you had taken profits but you know sometimes that's too late so overall looking at How the Australian dollar moves on a five-minute basis you can see how this area here is delineating the range and this is the obviously the low at 101 48 but the key level we were watching was 101 50 so inside this consolidation the smart money was accumulating and price moved up and then came back down and retested this broken resistance down support and then all in here they continue to work within a
higher time frame by model where price eventually Moves higher on an hourly basis you can see how the Australian dollar traded within that same area of price okay now look at how that 101 50 level reacted on an hourly basis okay so far we've only looked at a 5 and 15 minute chart on an hourly basis look what unfolded eventually price eventually moved up okay retested trade it up to 102 246 came down gave another buying opportunity okay and then rallied up and then came back deep like we were Talking about earlier okay in this
retest of this old range that we had initial accumulation they took it back down to that specific point given an optimal trade entry okay and then rallied up even higher and then eventually took out this previous consolidation area so this is that buy model come to fruition okay so over 200 and some pips okay offer here as a short-term trader okay if you were looking for that type Of trade but this is the area that we called for in terms of short-term trading on did a video previous to all the price action unfolding as it
did here and again I'd count you to take a look at Chris Laurie calm and go into his video archive section and the webinar we did together is archived there you can see the analysis that was done as well looking at obviously the daily in terms of what it looked like all of this price action in here is what Was called okay so over at a period of a few days okay you know over 100 and some pips obviously but eventually moving to the point of over 200 some pips now if you're looking at this
video module and you're wondering this looks nothing like the short-term trading video module you did like where you talked about the 18 and 40 moving averages right you're right because there's a difference okay they're short-term trend trading which is what that video module Talked about and then there is climax reversal short-term trading and this is what that premise was in this teaching model module talking about how looking for reversals at resistance and support levels is what we focused here notice how the low here that we were targeting based on trading the market maker profiles during
that specific time the moving averages were saying what get short okay but support resistance trumps everything So when you see that type of event unfold obviously the moving averages are lagging okay but price action is not its leading okay so getting in here long and in the very next day getting along here as well waiting for higher prices you can actually see the market maker profile here on a daily chart because that we're looking at here here's the range in here here's the breakout of that range the big Tyrannosaurus Rex jumped in the pool Okay
and it's sat still for a moment and we've priced to get stabilized again and then it put its next leg in started putting more of its body and then price eventually moved higher and I could tell you the price has actually moved even higher than this since this particular low here as well so we were very fortunate enough to have a very good example of price action in the Australian dollar and I was very pleased to be able to share that beforehand in Video recording and targeting of the specific price levels where I thought price
was going to trade to and be able to share that with Chris Laurie as well in a webinar so hopefully this has been very insightful to you and it gives you some framework to utilize some of your short term trading and where to apply specific price patterns and and how to use that in your arsenal for short term trading put some thought into how you're going to be a trader you can use either One of the buy or sell module and if you look at that fractal pattern and if you just understand part of the
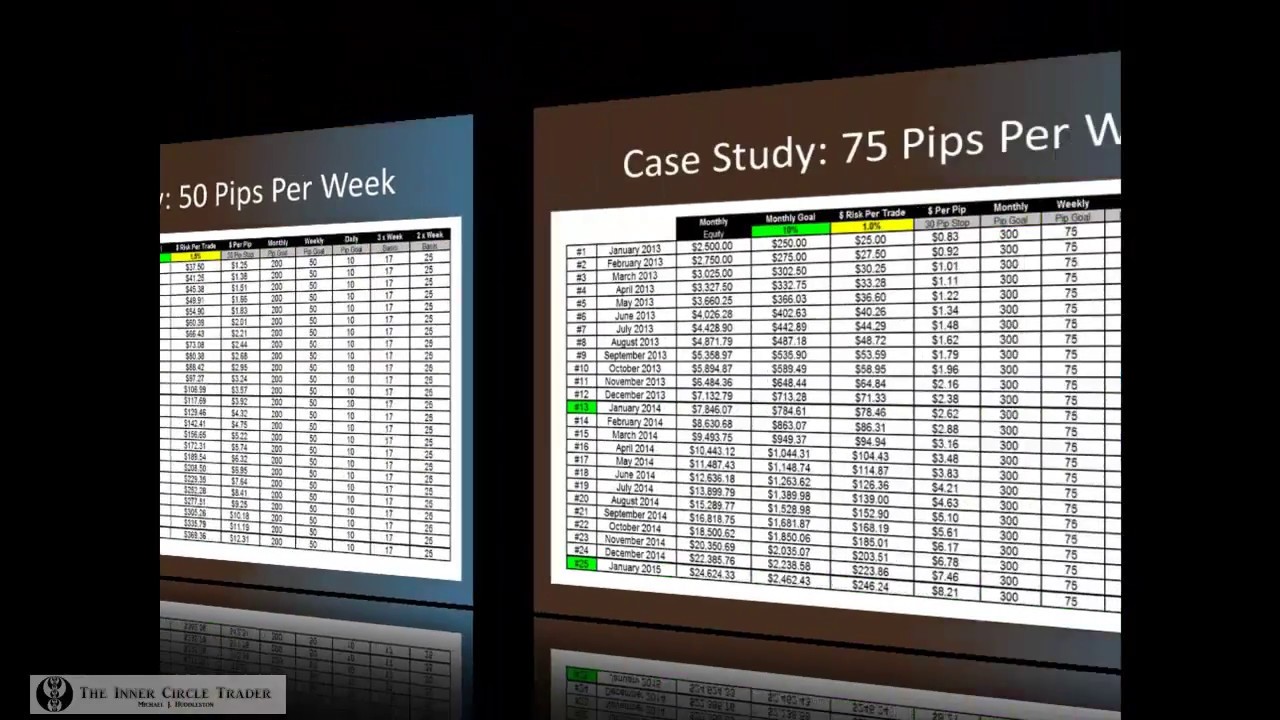
fractal and you can make a career just on that so if in a bi module and you just see the cell aspect of it that's all you need okay because remember you can build a career on 50 pips a week