All right folks welcome back so i do apologize and i appreciate your patience because friday we had an issue with our internet locally so i'm not sure what was going on but we had an outage in our area today has since been restored which i'm very thankful for but on this review Lecture teaching i'm going to cover a couple things and i want you to understand what it is we're doing so that way we're not taking away the incorrect things and focusing on the things that are not salient to the discussion but i'm also looking
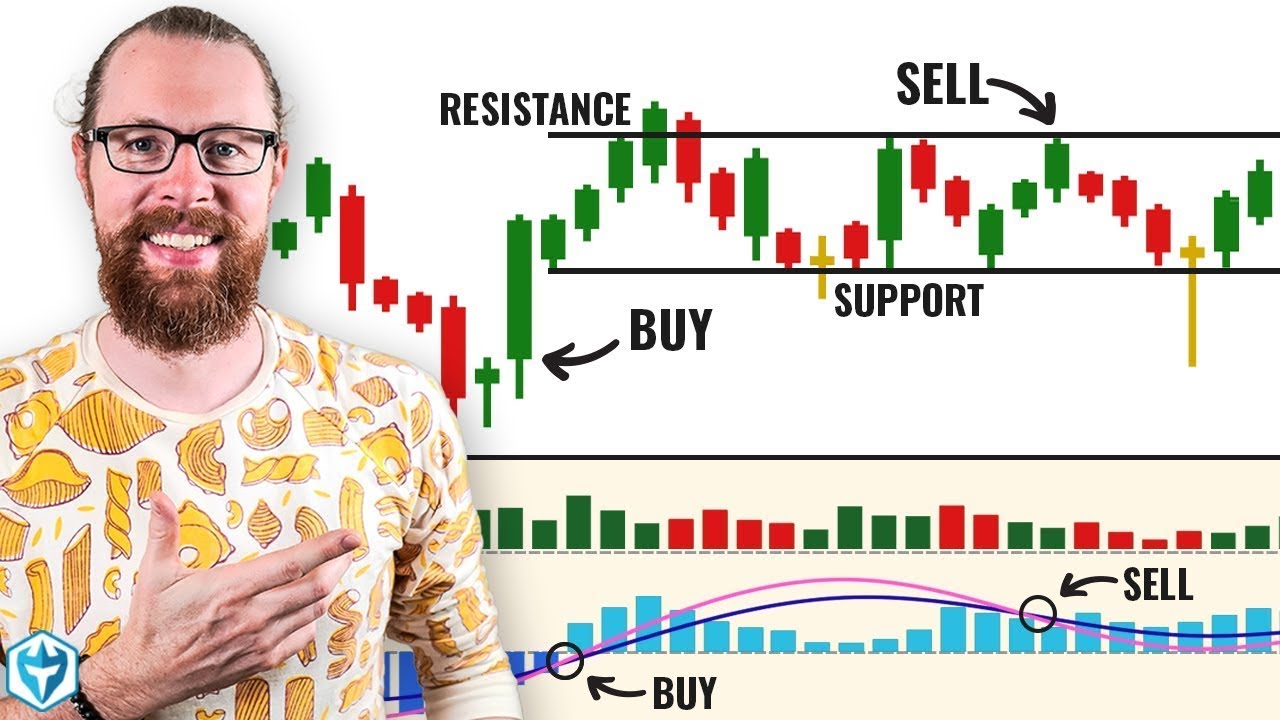
for you to align yourself as to why i'm doing index futures trading specifically recently and that I'm not so active in forex before we get into it we're going to look at the dollar index here and i want you to see that we've taken out the short-term high in the short-term low so we have a high here that took price higher broke that traded lower took that low out there that is the topic in teaching Of this lecture today in your notes i want you to create a section for dealing ranges okay whenever you hear
me refer to a dealing range what i'm looking at is a range where price has taken out by side then reversed and taken out sell side by the movement here okay that makes this range from here to here A dealing range okay so an ict dealing range whenever you hear me refer to that why am i working with a specific range why am i looking at one high and this high why am i pulling my feet from this low to that high all those questions are answered right here so we have a dealing range from
here to here So in this range the question is is how is it useful well prior to this run up here what has the dollar been doing it's been bullish i have been bullish one dollar i've been looking for higher prices in dollar and for the most part it's been delivering okay we've entered a little bit of a sloppy range in here this past week and that's fine so when this low is taken out here And sell sides taken i'm not looking that as a market structure shift where it goes up here runs to a
gap and then go lower because i'm trading against the primary uptrend if i do that that's the same as trying to pick a top and i don't try to do that i've lost a lot of money as a young man trying to do that so i submit myself to the market being likely to follow its higher time frame bias Trend momentum direction okay so i look at that run below that low here as accumulation of sell side liquidity for the purposes of buying it by smart money so stops here being triggered that's a flood of
sell orders coming into the marketplace and why is that useful and how is it useful smart money If they're bullish and they're gonna align themselves with the higher time frame trend as well they're gonna buy those sell stops so i'm gonna look at that run below here as a means of buying dollar i'm not specifically buying dollar i don't ever trade the dollar but i use it as a barometer what does that mean i'm using it in my analysis to determine If this is going to go higher then foreign currency should go lower if this
is going to go lower foreign currency should go higher vice versa it's like a teeter-totter so how this is useful is the dealing range that's been created by running out the short term low here i expect sell side to be accumulated so that way the market starts to trade higher what would it trade for well the dealing Range has been defined by this low being taken out in this high here taken out so we have buy side here cell side has been taken and if it turns higher once it starts to pull away from this
low sell side resides here and if i'm bullish because i'm sticking with the higher time frame trend i'm not trying to pick tops the drawing liquidity is Going to be that high because that's where buy side is so i'm not going to look at this run up into this range here for a fair value gap to sell off one dollar that's not what i'm doing i don't look for that my students know that so i'm going to be anticipating this range to be taken out so the smart money buys to sell stops and then sells
to the buy stops there are traders that want to be short dollar if They're shorting dollar they'll put their protective stop loss right above the short-term high here and that provides what buy-side liquidity how's that useful the smart money that buys the sell stops here will offset to those buy stops above the short term high so they're buying low selling high who they selling to at a higher price the buy stops resting above here that's narrative Okay so looking at the dollar we didn't do very much last week we kind of stayed inside the range
here so there's friday thursday wednesday tuesday monday's range to friday just the consolidation week okay you're a dollar this pair is in my opinion very frustrating right now because it's not trying to move very Much at all and we've moved back into this range here and we're just stalling i don't have a strong conviction one direction or the other so if you look at this market here is it obvious that it wants to go above these highs or below these lows now if we had a show of hands there is probably going to be a
large Degree of division some of you are going to be looking for lower prices some are going to be looking for higher prices now the way ict me myself the analyst defines low probability so that way the trader can engage in the setup the analyst inside of me has to make a determination of high probability trade conditions so how do i define that i've already taught it to you This is for your journal if in case you haven't already taken note with this high probability conditions with my concepts and my analysis method is the algorithm
presenting something in price that is so one-sided it's so obvious that it wants to go higher or go lower that it's very difficult for you to make a justification for the opposing side in other words if you're bullish and you think the price Is likely to go higher does this condition or market present next to no opportunity to present a shorting opportunity so it's going to be obvious this is high probability if there is a way for you to determine a likelihood of an opposing setup that is not my definition of high probability so what
are we waiting for As traders what are we being patient for because i preach that all the time you're waiting for that one-sidedness to the marketplace and it might not trade like that for a day or two or maybe even a week and you have to prepare yourself to have that patience to wait for the setup to present itself to you with high probability conditions now how does this relate to forex in my apprehension to be engaged with it Recently there is no high probability set up in euro it can go either way it can
run for the buy side here or it could run for the sell side is that high probability absolutely not the market comes back up into this fair value gap it ran up into that why didn't it drop i don't know why did it go higher i don't know Do you hear what i said your teacher your mentor the guru with the horseshoe the luck in my analysis is trimming away all of this nonsense this is chaff just because the markets are printing candles i'm not trying to predict every single fluctuation in every single market i
want to go where the iron is hot And i want to strike it when it's there because i'm going to shape a winner out of a market that presents the opportunity that's high probability so what i'm showing you here notice i'm not taking you into where the market's going to go to next because i don't know i don't know that right now so i'm not in forex does that make sense why am i going to gamble just to Entertain you i'm not going to do that i'm not here to show you that i can get
wrong a lot of times in markets that i never would have touched in the first place see the logic behind that here's british pound now pound took out its short-term low here that's something that the euro dollar did not do respectively so i'm Kind of like questioning is that an smt divergence correlated pair smt diversions now here's for your journal correlated smt divergence is when you are looking at correlated markets like british pound versus us dollar is closely correlated to euro versus dollar generally they'll move in sympathy with one another but in instances like we
have here if i was bullish for instance say i was bearish dollar and bullish foreign Currency if i saw this divergence between this low in this low here making it lower in cable or british pound versus us dollar versus that of going back up to euro that low here and here we have a higher low formed in euro than that of cable you see that says divergence so if i was bearish on dollar that would indicate to me that it's time to be Buying euro or buying cable in this instance if i was bearish dollar
and bullish foreign currency which currency would i buy euro or cable i would buy euro because euro failed to make the lower low because in sense of comparing relative lows to relative lows euro has failed to make a lower low so that would indicate if those conditions Were there and i'm not suggesting that they are folks we're just talking hypothetically here since cable went lower to take out that low here that's a stop running event and eurodollar is failing to make that lower low so it's saying i'm not willing to go down there and if
dollar were bearish this would indicate this is the relative strength leader and then i would expect this currency to Rally higher now that does not mean that i won't trade cable long sometimes there's other factors that are outside the scope of this because it's not that i'm trying to keep it from you it just would require me a lot of teachings that have to help support the reasons why i would say i would still go long british pound versus u.s dollar even though euro failed me to lower low some of these things would be the
economic counter coming up Interest rates differentials all those things which again are outside the scope of this and i promise i'll touch on those as we go through the rest of this year but i don't want you thinking or having the obligation placed on me that i have to explain every single little detail because i mentioned something if you spend time with me and hopefully that's what you're here for you're not here to just watch one week or a couple videos and call it quits or I think you know it all because you're not going
to do that but i want to give you a very deep dive into my concepts and my analysis style that aligns itself with the algorithm here is the australian dollar versus us dollar you tell me is it likely to take out the sell side here or the buy side here now it's real close to these so wouldn't it feel natural to say it should spike Down there and take that out logically that's what i think it should and could do but i could be wrong i've been in markets where it's done this before and then
ran away from it because this is the logical level that everybody would look to see a breakout below i'm not a breakout trader i look to see price run into these levels that's my setup so i'm not looking for a breakout to continue in I'm looking for a run below an old low or above an old high and i'm targeting liquidity i'm not trading patterns i'm not looking for anything harmonic i'm not looking for supply and demand because that doesn't exist unless you're looking at commodity prices which i talked a little bit about on my
twitter space on this past saturday if you've listened to that and you found it insightful give me a comment below And i appreciate that if it wasn't any help to you you're welcome to leave that as well as long as it's respectful every comment's accepted but i don't have a strong about trading the aussie dollar right now either so i'm not touching it here's the dollar versus canadian dollar we mentioned how it took this short term high up bumped it started to break lower And who knows what it was going to do and we had
a little bit of a retracement on wednesday and thursday and then friday we had a washout to me it left relative equal highs it could have easily swiped those but it's having a little bit of a heaviness in the marketplace and it might want to trade down into this gap here do i know which one it's going to do Right now no because i can't frame it with high probability on one side or the other so am i going to trade this personally no so i have a a conundrum okay i'm stuck if i'm looking
at 4x and i have these shackles of uncertainty on me and you as my students even my private group they're looking at me like you Know ict you know pull your magic wand out and do some magic here with forex that's why i've been very candid with them and i've been candid with you i do not feel forex is high probability at the moment will it stay like this no it will not forex is not dead okay i talked a little bit about that as well in twitter space on this past saturday but i'm not
trying to promote you to join twitter you can literally pull this up and not have a Twitter account so don't think i'm trying to pull people to twitter or to follow me i don't care i want the follows on the youtube channel but you're welcome to go on the saturday rants that i do you may not be a fan of that but it's kind of like a motivational thing it's kind of like to realign yourself after the previous week Of trading and sometimes i'll just talk about things i endured in my development and sometimes it's
funny to listen to because they were real they were real events i had to work through and other times it'll be things that i think are noteworthy and if they delete my channel over there on twitter i could care less Okay but this channel here i want to preserve and i'm going to keep a lot of the tinfoil hat discussions off of it here's the gold futures market okay look at this market for real folks does this look high probability to you is it going higher is it going lower your guess is as good as
mine that's why i'm not talking about gold think about it We traded from here to here we've been consolidating gun to my head okay gun in my head long-term bullishness on dollar it might resume that would be pressure on gold gold should go lower attack the sell side over here is it high probability no would i trade it no because it can do one of two things stay consolidated or run up and trade against my Expectation and dollar slip lower that's against my analysis that's where i'm okay with being wrong because i'm not taking a
trade that would lead to that as a monetary loss it would be a bruise to my ego it would be a scratch in my journal where i say my expectations were not seen in the deliberate price and this is my observations i'm not saying i'm so Stupid i messed this up i'm never going to get this this is too hard for me why am i struggling so much this should have been easier i should have learned it by now that's all negative self-talk and when you include that in your posts on social media or if
you include it in your annotations on your chart or in your journal you are literally poisoning your developing self you don't want to do that you want to Reassure yourself positive self-talk that's how you do it you're tricking your brain to retain the positive aspects of what has transpired whether you've taken a monetary loss or you just missed an opportunity any of those conditions are going to be helpful to you if you use positive self-talk that means telling yourself you saw it coming beforehand this is what you look for in The setup and what will
happen is your subconscious will retain that because it's a feel-good moment you're creating an artificial feel-good moment in your journal you're logging back data in moves and if you have taken a trade and it was a losing trade you go into it and look for the positives because you're gonna get it wrong sometimes like i do And when i was journaling young i went into the charts and discovered that if i went in and i recorded okay i had this trade incorrect but i'm encouraged because my bias was incorrect as a trader but the method
says if it was going to go high it would go down to a fair value gap or take out south side liquidity and then rallied up to a specific price level and i would focus on that so you're always looking For the silver lining that's how you stay positive and you endure drawdown periods of uncertainty where you have to sit on your hands and do nothing and that's a very hard lesson to learn you need a mentor that has done that and can justify why that is a good thing not well you got an edge
got to get there and trade it you know losing's part of the game money man's gonna save your rear end get out there and go for it That's stupid that's somebody that i guarantee you is not making money that's somebody that wants to row up the troops and hopefully it works out in their favor and they can champion themselves in front of everyone saying see we're killing it i am not afraid to tell you sit still Sit on your hands wait that comes with maturity that comes with someone that has endured financial loss to the
degree that probably most of you would throw your guts up so to avoid all those personal experiences and financial loss i teach the way i teach and that sometimes for most people in the younger Age brackets i'm viewed as a very boring monotone teacher i'm not going to get out here and you know bang pots for you and get you all worked up and show lamborghini lifestyle i'm not going to do that because none of that's going to help you these kind of lessons i'm showing here this is the thing that you need to understand
looking through the markets as a whole going through them individually is there A one-sidedness to all of them because if there's a risk going risk off scenario they should all generally be moving in the same direction or hinting at that and we're not seeing that at all not at the very moment we're not so i feel comfortable being in stock index futures crude oil now we've been recently enduring a lot of issues with crude oil just let me take you back to When crude oil do 40 some dollars negative so we went under zero the
cost of oil went below zero and refineries were paying people to come pick up their oil because it takes time for them to turn those pumps off during all the rickman row we'll call it because i'm not gonna put the things in this video that would make it otherwise flagged for Things just know that all the things we've been doing for the last two years led to that collapse in oil we were bearish i was looking for bearish prices on oil i called 15 maybe as low as 13 a barrel on oil and that very
day it literally collapsed and went negative nobody could have expected that no one of no one on this planet would have said Oil's going below zero and to the tune of negative forty dollars so you're all asking why is energy prices so high well they lost a lot of money folks a lot of money people weren't able to travel they weren't able to go anywhere so them being them They're creating this situation they're making all that money they lost back and with interest so you're seeing all this pull higher in crude oil and gas prices
because they have taken a huge loss they took a bath so now they have to recoup that how do they do that well you're looking at the price jar here so because there's a lot of manipulation in this market there's a lot of uncertainty and it's a Lot of knee-jerk reactions to anything at all about energy prices this market's gonna flip out and overreact is that high probability no so that's why i look at this market now everything i just said i want you to compare and contrast how much Better how much more plain more
simplistic and clear that this market's going to be versus what i just showed you in the previous discussions here we have the daily chart of the s p and obviously you're going to be asking okay i'm a forex trader this is getting boring ict you know you're gonna have to start talking about currencies or i'm Unsubscribing unsubscribe and you will find that you've given yourself the greatest disservice ever because what i'm showing you here is the same thing that works in forex when forex is moving right when the markets are more liquid why aren't the
forex markets liquid ict well because of the past two years and the effects of that in the supply chain and global commerce and exchange that's what's strangling those Currencies plus we have a w a r you paying attention going on and you have to literally weigh all those factors in to your analysis and i understand folks you have these multi-level marketing companies ran by goobers and young kids trying to tell you that you can get rich by doing stupid stuff and none of them actually can show you a millionaire Student nobody has a million million
dollars that have made money with their things none of their teachers are making millions of dollars none of them have been profitable and it's easy to get sucked up into that thinking okay it's just so easy to turn my phone on put this thing on my chart put a couple indicators on here and when it crosses this and just below that i'm going to do this and that and it's easy and i can do 15 entries on the same idea And share that on social media and it's going to make me feel good because someone's
going to put a little like behind my post no that's the wrong way to do it a sober-minded principle-oriented speculator has to weigh out all the things that i'm laying before you right now if it's boring it's right trust me when i tell you that if it's Boring it is right because big money is not going in in erratic price action it is not doing that it's looking for a systematic edge with visibility how can we go in and discern where risk is how can you define risk in all the markets i've shown you prior
To this one there's no real way of determining and defining risk how far is it going to go against you if you get in who knows i don't know so if i can't define the risk why on earth would i even put my money behind it i wouldn't and maybe you shouldn't either but i know some of you want to be hot shots and you want to gamble you want to be the guy to get there and be the Contrarian well this is not that kind of market folks and let me say this also in
this lecture in my 30 years of trading let me underscore this very plainly and succinctly this is the absolute hardest trading has ever been it's the hardest it's ever been we have so many things coming at us as speculators to change or inspire certain sentiment All the data we're getting is fake it's manipulated it's contrived for instance look at the inflation number do you feel that inflation number is accurate when you go to the grocery store right now how about when you go to the pump and you fill up your gas tanks does it feel
like that data that they're releasing for inflation is in alignment with reality No way absolutely not but to the average joe or jane that feels like well they're telling us what it is and it's probably not as bad as we all think it is no it's worse it's worse folks and it's going to get worse so you have to be super minded with your spending now and you have to be so Reminded about your analysis and what you're going to participate in and this market right here is giving that to you it's showing you everything
that a trader would want to see and find in price action to support the notion that it is high probability setups now i'm going to go into as the reason why that's the case and also kind of like give you the underlying tone of why I've been able to be accurate with this market publicly showing it and sharing everybody they can see it i put myself out there where i think the market's going to go why it should do this why i should do that and i'll leave it to you to determine whether or not
this is useful information but if you don't want to look at the markets like this I promise you this you are never going to learn what i teach and find consistency in it not because it doesn't work because it works like gangbusters and it's highly precise but you won't subject yourself to the requirements that are needed to be developing properly and have the right mindset that's why i talk so much because i'm telling you the things that you have to Think about while you're developing not get to the point give me an entry strategy ict
where's my stock gonna be and where do i take profits i got time to do this you're gonna fail and i promise you i would put a million dollars on that because none of my students came through fast tracking it cherry picked pieces out of it and made millions dollars they've never done that And unfortunately the way the world is today they want dollar menu have it right now my way mentorship and expect unrealistic expectations and results it doesn't work that way the market doesn't owe you anything i don't owe you anything that doesn't taste
good does it but that's the reality and you have to align yourself with hey This market's going to try to kick me in in the gut it's trying to take me out it's not here for your pleasure it's not here for you to go in and just pull dollar bills off of the money tree and have no consequences no thorns in your finger as you reach for them the reality is this is war you gotta go in Ready to do battle but you have to know when to pick your shots you have to know when
to flank it you have to know when to retreat that's cutting losses short allowing your stop-loss to be the determination that you were wrong in that trade idea retreat is not defeat and sometimes Standing down that means don't engage don't go forward you're not running backwards you're just sitting still with those other markets i've made mention of prior to this market here you are standing down doesn't matter what you see out there in front of you you're standing down this market where i actually have been engaging let's look at the differences between it and what
i've shown so far in the other Markets all right so we have an old low here relative equal highs the market trades above that then breaks down and takes out the sell side here what does that make this range here to here but dealing range now how's that useful well we're in a very long protracted consolidation it wasn't like a short little run from here to here it was elongated this is a Daily chart so this is a lot of time going sideways essentially but it took buy side and then eventually aimed for sell side
when that happens on the daily chart and we're entering a seasonal tenancy of the first part of the year i'm looking for sustained price moves in the second half of the year i'm looking for sustained price moves there as well so apart from the details that lead to that And i'll talk a little bit about that in topical studies but again i'm trying to keep this conversation germaine to the topics and make it useful to you but i'm going to introduce some topics that we'll branch off into in the coming weeks and months so the
dealing range high dealing range low why is that a dealing range again we took both sides buy side and sell side out what's the bias now Bearish this range in here we're looking for areas to anticipate a run back up into a premium short term high short term low it runs up into a premium here it sells off it creates relative equal highs cell sides taken here so once it has taken the sell side here what's the market likely to do revert back to buy side even though it's bearish where is the buy side like
a neon sign relative equal Highs bumps up to it then does what you have now a new dealing range you have a dealing range from low because it took out the sell side and the buy side's taken here so your dealing range is from here to here what is the usefulness in that you're anticipating the market to trade back down to a discount and eventually to its sell side discount array Below 50 of here to here this fair value gap is a target so you're going to be looking for areas once it sells off here's
a fair value gap break lower break lower target filled sell side relative equal lows tags it so now we have this dealing range from Here to here why is that a dealing range we've taken by side here and cell side's been taken here so from here to here you start doing analysis inside of that range look at all the back and forth in here and then we get to this level here and it's more energetic when i see that i identify this as the dealing range high to here and here but i will refine it
down to the most energetic price swing inside of the Dealing range so i'm going to use this range here from high to low how's that useful from here to here i'm going to be looking for a equilibrium price point or premium to go short because the bias is what bearish i publicly made that known even on youtube i said we're entering a seasonal tenancy here where we go into may where it's bearish Did it deliver of course it did now this gap here we see it trade up into it here sells off comes up up
until here fails to go into it there but look at all these opportunities where it could have filled in that gap but it didn't broke lower that indicates to me that this is a breakaway gap i will talk about gaps in its own topical study but for now this is a Breakaway gap meaning it's going to most likely stay heavy and run where in our bias what's that direction lower so we have sell side below here now so we expect mark's price to trade lower below that it does so and then keeps on trading lower
and creates a short term low here rallies back up into a gap drops down once more takes cell side so now buy side is where it's likely to revert Back to and from this high to that low that's our focal point for our study so inside this range i want you to think about what you see study this pause the video make notes of it and then watch the rest of the video if you do not pause the video folks i know some of you like to reply back i'm not going to pause the video
This is that kind of lesson where you do not get the benefit except the fact that this is a long video accept it because it's good stuff this is stuff that literally makes money okay this is the stuff that helps you not lose so much money this is how you find the setups that i'm teaching you to look for but if you don't do these parts these interactive studies and don't pause the video you've cheated yourself and then You're going to complain in the comments or in other places around the internet and saying ict stuff
so convoluted it's complicated it's not complicated you're just not doing what's required so who's failing here you are if you don't pause the video all right so i have the chart kind of aligns that we can focus on that range here so inside that range Again from here to here we have a bicep liquidity pool right there it trades up and purges by side why is that likely to occur because we're bearish we're going into a seasonal tendency where the market's likely to trade lower so anytime it runs back above buy side liquidity It's likely
to sell off once it accumulates those buy orders it's going to target what the sell side below that low here and it does so here so sell side is now purged so this is an area where if you're a swing trader and you don't want to be a day trader because a lot of folks are like hey man you know i can see that intraday trading is amazing and it's awesome and you and your students are able to do a Lot of things that are highly precise i just can't do it michael i can't i
don't have the time i don't have the lifestyle my requirements at my job my business i'm in school you know i just can't do it give me something i can trade with on a higher timeframe daily chart this is it how's this any different from what i teach in the lower time frame it's simply changing the time interval Everything i'm teaching you is fractal the algorithm runs across all the time frames all of them it starts at a higher time frame runs its way down through the time frames and it refers to all these locations
the algorithm is highly complex but the concepts of engaging with it is not complex you have to be specific and oriented to the high level of detail To navigate each one of these time frames and put things in their proper place and context so in short if we're bearish i'd like to look for a short-term high taken out and accumulate short positions who's accumulating short positions above old highs smart money they held price there why because they were allowing traders to engage this as what a bull flag Retail sees that oh look at this doji
down here it ran up support is now being found here because that was resistance and that is now what a continuation of a buy side run higher with a bull flag it's going to run for this area here because that's resistance and the opposite took place we were bearish here the market trades lower attacks the sell side Runs in spends time down here and then we have friday's price movement so let's discuss liquidity a little bit deeper okay this is one of those lessons where you're gonna be like man this makes a lot of sense
and you can't find it in books okay today's date think about now today's date in june 2022 i'm teaching this for the first time even my paid mentorship group doesn't know this lesson so if anybody out there takes this information and repackages it you know it's came after me this is what the algorithm does okay i want you to think like this because this is what the algorithm when it runs certain macros macros are a Short list of orders of instruction do this do that okay the if then or that that logic behind how the
price is being designed delivered and booked it is not buying selling pressure it is not your pattern nothing harmonic No crossing over of moving averages no oversold overbought indicators none of that stuff not wolf waves not elliott waves none of that stuff white cough none of it has anything to do with how price is booking and how it's delivered what i'm about to show you this is it we have now a dealing range this load was taken out here this high was taken out here so now we have this High down to that low how's
that useful well if we strip this away i want you to think about the simplest of things that retail traders use and i started this way same way in 1992 folks the same procedure of looking for classic support and resistance because they want to sell you on the easiest thing going in because that way you'll put money in an account thinking it's going to work and then you are now Fleeced they don't care if you stay in the business long enough that the statistics already state that most people blow their account the first 30 days
let alone majority of them by 90 days so they want you to get in there feeling like you can do it real easy it's simple they make these stupid little books super little courses and they trick you they rook you into thinking that hey all it has to do is go Down to an old level where it bounced before and it's probably going to go up or it's going to go up to a level where it bounced down before and it's probably going to go down once it goes there again because hey history repeats itself
right yes the history does repeat and the only aspect of that that is true is that losing traders follow that logic so we're looking inside this range here okay this is our specific dealing range what do you see Before i go further wait a minute ict you just said that's a dealing range right these are relative equal highs it went above into the fairbank gap with this here and we never were able to go hired so i'm looking at that as that's the cap on the marketplace and it's likely going to be a breakaway gap
that means it doesn't fill right away Until it fulfills lower level objectives on price down here so what do you see in here pause the video and when you're ready to continue unpause it all right so we have this high to that low why am i picking this high because it has the most energetic price run away from it it's the most recent One that has that energy going lower the delivery of the candle is moving away from it quickly that's what i'm really getting at so i'm framing it with the logic that this is
likely to stay open not rebalance and the market's going to drive lower so i range from here to here that's what i'm measuring in equilibrium is here so above that level this level here what what are we looking for we're Looking for buy side but classic support resistance idea is this we taking out this low relative equal lows okay this break below it here is shallow and it's short-lived and then we broke down aggressively through it so classic support and resistance traders are going to do what we're going to be thinking about that low once
it broke through Here more meaningfully they're going to assume that that was support broken now turn what resistance right so so they would expect price to trade up into that level right here and then trade down from there not understanding any of the logic as to why it would do this at all that's narrative that's the reason why retail traders suck because they just simply look for Support resistance or they look for patterns for pattern sake and they're fooled by randomness the algorithm is not random so i teach you to look at a range and
define it in the scope of premium to discount equilibrium is here and if we're bearish we need the price get to equilibrium or preferably higher than to go short in this shaded area here Why did it not just simply trade back to that low and go lower why didn't do that think that's our last up closed candle right before the energetic move lower inside the context that this is likely a fair value gap that is going to stay open why because it had no ability to get up until it closed it at all so that
changes the fair bag gap to what a Breakaway gap breakaway gaps remain open until lower level objectives are fulfilled and delivered and booked in other words it goes lower to a specific price level in the discount then at a later time it might come back up to here but it could be an undetermined amount of time i don't know when they'll come back to fill in a breakaway gap and if it's bullish market everything i just said just reverse it this last closed candle prior to move Lower and taking out that dealing range low that
is my ict bearish order block it trades lower comes back up doesn't really quite get back to that old low sells off again then it comes back ramrod's this low here goes above it and then consolidates so anyone that would have expected this little bit of fluctuation through this Would have wore them out these are days these are days of trading s p shorts are going to be scared it's probably going to go higher why because they see a wool flag run up consolidation and they expect it to go higher we're bearish we're in a
premium market and it's going to a bearish order block now price is likely to drop lower and repricing and target what What's it going to target if this is your your trade what's it targeting well think about what i thought on this youtube channel flagship pattern the optimal trade entry from high to low 79 62 retracement levels that's here that's my optimal trade entry so you can use targeting approaches where you put the Fib on the bodies here and here the lowest of the open or closed and the highest of the open or closed and
your projections down would be right in here and i'll leave that for you for to study and do it on your own but we have a fair value gap that's left open bearish order block a dealing range that's been broken to the downside the only thing we've done is retraced Back into a short-term premium and retail traders are going to see a bull flag we're looking at it to go lower what's going to go lower for before we get into that we have a short term load it's taken here so we had sell side here
and it starts to rally back up what's it reaching for next it's going to revert back to buy side that's this here That's why it's not going to go to simply that level and go lower it's going to go deeper than to clear off all the buy side liquidity so that way it can absorb that buying orders and translate that to a short position for smart money so counterparty is the buy side being attacked here so shorts in the smart money camp Can then target that low down here so we have buy side taken here
the sell side was taken here so now the sell side changes to here because the dealing range is now defined by this low in this high because buy side was taken on this high southside was taken on this low here so we have a dealing range here how do we find that useful we're bearish So even though this is a fair value gap close to around the equilibrium between this low and this high that simply would just be a partial and we hold for what cell side to be attacked but look closer in here what
do you see let's zoom in so here is that area here And inside this own area of shadedness i've taken your attention to this short term low here so we have a short term low here and then it gets taken out and then we have this low here and it starts to rally up look close do you see that this is a swing low again these are daily candles they're not lower intraday charts we have a low that takes out sell side here Runs down creates that low one more smaller attempt to go lower than
this day it does then the following day we open trade down and trade back up this is a swing low on a daily chart after we've taken out sell side below here and we have a short term sell side liquidity pool here which it runs down into and then creates a swing low so we're in a discount inside of a Discount think about that now if southside's been taken here and sell sides been taken here what's it going to revert back to buy side where's that swing high on the daily is here so if it's
going to go here and run to that level buy side is simply not just that at that level What's above that bingo our gap we've been talking about that guy for a couple weeks now the easy low hanging fruit objective 3880 i gave that on twitter and i'll talk about that in a couple minutes but notice how we had cell side taken here and then the market reverts back to buy side and to an imbalance that gap Large range day how did we know or how could we have known that friday was going to be
a large range date with an up movement well let's dig into that now all right so we finally made our way down into the hourly chart for s p here's our gap from the daily chart that's noted here and here's that old cell side liquidity pool and we dug down into that and i'm going to add some day dividers here so that we Can get a little bit of context i want you to look at the profile of the week okay now when i say profile that is not volume profile okay i do not use
volume profile i do not use footprint i do not use depth of market they are all gimmicks and i know that's going to upset some of your followers that use that stuff okay i promise you The market's not moving and booking based on those interpretations it's simply not okay what i'm about to show you this is this is it this is what makes the market do what it does okay this is how price books i'll leave it up to you to wrestle with it but i'm the one making money with these trades and you're over
there putting things on your charts looking at those things and not price action you're not even relating to How the market is going to deliver on a weekly profile weekly profiles are a template okay how should price deliver i want to walk you through this one here and how i was able to tell you before the fact on friday that we would see 38.80 so on monday we opened from all of this nastiness here on the previous week the market starts right away on monday just starting to go higher repricing Repricing repricing going higher no
one can go short no one can go long because it's just constantly just going higher if you fight that you're dead you got to wait for some kind of displacement when does that occur on tuesday we have a little bit of a movement here and then breaks down then cell side is taken and think about what i showed you on that daily chart We now have a swing low so on thursday we can anticipate the market doing what coming back down to a discount rallying up and right about here that's what i said weekly objective
on twitter is 38.80 now why did i pick that i'll tell you in a moment but friday notice what we have here the markets already moved above all the consolidation here It's not likely to do what have a sharp movement lower it's not going to take cell side out because it's already done so here in the consolidation it's already worked into this very very gap here twice with a stealth stop run there taken out here digging deeper into this imbalance leaving the bottom portion of that imbalance open making it what a breakaway gap So it's
indicating that it's not likely to have retracements of any magnitude that would see this revisited again so we had this level taken out here retraces back down into a short-term discount from low to high fair value gap digs into this here and then once more on thursday it rallies comes back down in retraces and this is where i'll talk about what i was wrong about On thursday but right about the second part of the day but friday we just started consolidating had a little bit of a movement on a lower timeframe in london which i'll
show you and then off to the races because the market only had friday to fulfill a run into that gap everybody knew about this gap Nobody knew when it was going to hit it until around thursday that's kind of like what i was hinting at on thursday's trading so on thursday i was looking for a run into this level here and initially i was wrong and i took a trade and got stopped out plus two points and while it wasn't a loss i was incorrect about it running to here but what i was expecting was
and i mentioned This on twitter i was looking for a run up into here and then trade back down in and i think i did this discussion on the video on this youtube channel also prior to this video so i don't know what date that was or what the title was but just take my word for it i cover this and talk about what i was looking for and why but i wanted to see this level taken out here and then drop down into that to be A long and then look for higher prices it
did that but it didn't give me the run first here then drop down because i wanted to see this high taken out i was going to go short there after long so i was longing shorting reversing it writing it down here i was going to go along there and then hold for 38.80 that was my plan for the week that's the the Video i wanted to talk about like right now that was what i wanted to cover on friday as a review saying this is what i did and how i did it and why i
did it but it denied me that run here that's fine this level here i got in sync with the marketplace made some cash and then on friday did it again as well this imbalance right there that's what i used to justify the run up Into 3850 and there's two setups that were made available if you were looking for it too and we'll cover that now 38.80 this was the tweet you can see the time on the 23rd so right in here right about in there and the market consolidated so because it's consolidating i don't expect
it to drop down because everybody wants it to go oversold they want to see some kind of harmonic Pattern a gaurtly a bullish you know divergence and some indicators something to that effect when the market's this close to the gap or some premium array and you only have that day before the week closes when everybody with any insight would know that this is where it's draw drawing back up into because it's a gap it's a real gap Actual gaps have a tendency of filling in and it's an obvious target so i know some of you
hardliners in here that are very critical of me oh this is everybody does this everybody does that okay well post your trade post that you knew about it beforehand you outlined it beforehand and you actually traded it because i already done that all right we're going to drop down into a 15-minute time frame You can see the fairbank gap here we dropped down into it in london consolidated into another run into that fair bay gap in london and then aggressive run right at the nine o'clock hour market was not going to give anybody an opportunity
to see a deeper retracement and inside this run i'll show you what it looked like also but this is the low hanging fruit objective this is what I tweeted this is what i posted on twitter the day before say we would look for 38.80 why is that low-hanging fruit low-hanging fruit is the easy objective this is how i teach my students now obviously the gap being closed entirely would be up here well it may not have done that on friday only had just friday to get up to this level it may have just fell short
of it so the low end of the fair value gap is down here so what's the nice round you Know 10 level into the gap the first one 38.80 that's why i like to use 3880 okay so that way you know it wasn't some random number i told you the logic here as to how i used it and determined right away into the one minute chart you can see at the new york session at 9 30 equities opening we see a run aggressively here very value gap it drops down into it Buying opportunity if you
were trading with the new york 930 opening and the target that gap the shaded area up here you could be a buyer here the market rallies up creates another fair value gap there again thinking about that weekly profile don't expect it to retrace don't expect it to have any kind of movement lower it's in a hurry folks it's been stagnant most of the week Waiting for price to show a willingness to want to go higher once it showed that it wasn't coming back to old resistance broken turn support think about what i showed on the
hourly chart rewind the video back to the hourly you can see how the market did not once it broke above it did not come back down to what logical support level would be seen with retail seeing old heist broken let's wait for it to come back and touch it Again it that doesn't work folks it's not not when you have time crunched like it is here friday was the day of delivery thursday in the evening one minute after 11 my local time eastern time in the united states i said 3880 is the the next draw
and that's my weekly objective making it public that way you know there it is and here's where it went to now You have obviously a set up here and you have a setup here no retracements no funny money just straight to the draw of that daily gap so what's the benefit of knowing what the weekly profile is going to be knowing where the draw on liquidity is where is it likely to go now it's not my goal here To devalue my private mentorship because they were told this beforehand before the week was going on we
were looking for that okay that's the only distinction that separates this public mentorship versus those individuals that have joined in the and you can't join folks but and please don't get upset because i'm actually teaching You how to do these things so you don't need me to do that but that mentorship was there made available to people that needed that holding of a hand this is what i think you should do next and you study with that not that logic here i'm going to talk about what has already happened the comment section is open my
students are welcome to come here and post down here and say i was a liar if i didn't say this is where the mark Was going to go you were told the very night before but they known days before okay so it's not a oh it's going to the gap and i'm lucky here we knew about it beforehand but the logic that i use to tell that community i'm teaching that here publicly as a mentorship this is this is the understanding it's Not going to fluctuate it's not going to be willy-nilly wishy-washy it's going to
be straight to the point and the point requires a lot of explanation you should want that if you're satisfied with this is what it looks like you buy here sell here stop here there's you're never gonna find consistency but that because what makes that setup high probability that's what's lacking look around on Youtube look around in every teaching circuit everybody wants to do the flash and a pen cliff notes version of what i teach and that's why their students suck because they have no idea what's going on unless they hear me talk about it in
my personal private group then they Go and they make their little videos and make their little courses and they make new little commentaries but it's my stuff that they're saying so what i have done is taken that away and laid it out here publicly and you'll start seeing who's been copying who so granted friday was a you know is a blistering run higher most of you probably didn't participate In it but i did talk about this very approach to engaging a fair value gap when the market does not do a drop down when it's bullish
for a due to swing and take out cell stops because sometimes it's going to create these opportunities how could you know it was going to do this i taught you that in this lecture because of the weekly profile that gap that was looming above on the daily chart which is shaded here The fact that we only had friday to get to it and the market was just basically saying we're not going lower we're not going to go any lower and it kept taking out buy side but not drawing down and completely breaking lower it would
go for a short term area of sell side but then immediately rebound and go higher to take out buy side again so What that was indicating to me as the analyst they're gravitating towards this gap so you wait each day now i thought that we could have started to run up to it thursday a little bit better than we did like i was expecting a whole lot more energy on thursday but because we didn't get that that's why friday was It that was the big hurrah that was the floodgates opening up and you better be
on board or get the hell out of the way and there you have it now obviously this lesson isn't gonna answer everything for all of you you're gonna have a million new questions and guess what that's wonderful that's being mentored because i promise you as we go forward those questions will get answered and i don't Have to do it in a response in a comment just write it down in your journal questions that need to be addressed and you watch and see because the way i talk and teach and show examples you will get that
answer but it has to come in the natural progression of me teaching the way i teach because i'm not going to change gears i'm not gonna have it your way mentorship mentor okay i'm not gonna be that that person for you okay I like things my way they name streets after me one way and unfortunately that rubs a lot of people wrong but i promise you if you submit to what i'm doing and teaching you you're going to get what you're looking for you're not going to get it on the timeline you want but you're
going to get it perfectly packaged you'll understand everything as to what it is you're Trying to do what you're looking for when not to do something why should you be sitting still why should you be avoiding specific markets you're gonna know all that stuff and that's what makes a consistent profitable trader because anything apart from what i'm teaching you here it's gambling and it's just circumstances that led to you just being right that time And you're going to attribute that to retail things indicators volume profile elliott wave harmonics supply and demand whatever put it fill
in the blank it's it's all that stuff and i know that that's what makes a lot of you upset with me because maybe you're making money with some of that stuff but i promise you if you go back and look at your examples where you made Money align it with this and you'll see why your trade really worked and when you failed look at what i'm teaching and you'll see that's the reason why your trades are failing i know that sounds arrogant i know that sounds very pompous but it doesn't change the fact it is
what it is until next time Be safe