in today's episode we're going to focus on the parabolic upside phase because we've only just begun it really and when we compare this to historical Tendencies You Can notice that we're only in the very beginning stages of that parabolic phase of the cycle but we have to better understand this phase so that we can navigate it appropriately and that's what we're going to be discussing in today's video so subscribe to the channel for more videos like this in the future and let's dive right into it but before we dive into it let's first have a
quick message from our sponsor our sponsor for today's video is bit Unix and they are a really great crypto exchange for you to consider for your daily crypto trading and investing they are a no kyc no VPN Futures exchange and their liquidity is on par with the top exchanges users can trade over 250 trading pairs with up to 125x leverage without restriction and to celebrate our partnership with bit Unix we're running a very special offer from November 27th until December 7th you can sign up using my link in the description down below and deposit usdt
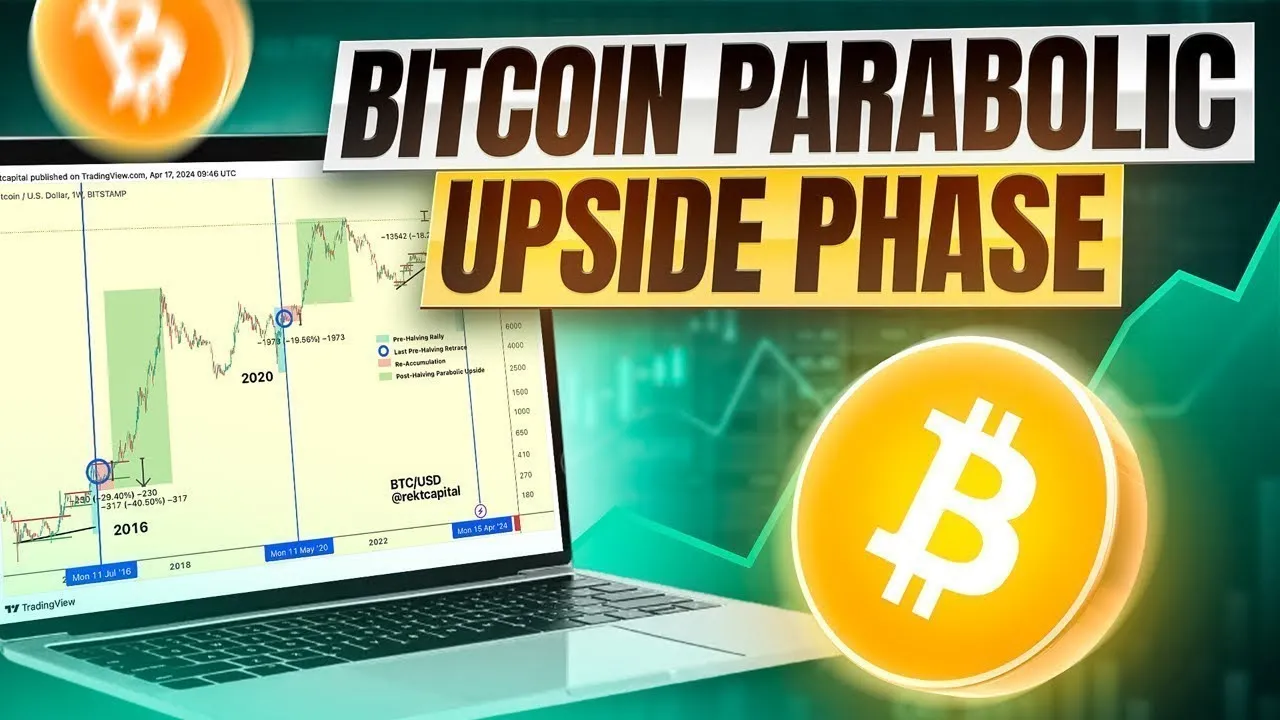
tether to get 20% rebate the rewards will be distributed on the very next Working Day and for more information check out the link in the description down below thank you once again bit Unix for sponsoring this video and let's Dive Right into this episode where we'll be talking about the parabolic phase of the cycle you can see that this is month one in Breaking the old alltime high region of resistance and that is essentially the very first signal to kickstarting the parabolic phase in the cycle this black horizontal level we see the analgous level like
this across Cycles in 2020 and 2021 this was the level 19,000 roughly speaking 20K that was the old alltime high resistance here in this cycle the analogous level was 69k and in the previous cycle of 2017 it was of course a little bit lower than that 1,200 approximately speaking and so in each of these Cycles breaking the old alltime high major resistance that first monthly candle is the very early sign of that parabolic phase of the cycle beginning so this orange circle just showcases to us that we're very much in the very early stages of
the parabolic phase of the cycle and just to better understand the magnitude of what could happen next we've seen in the past that we can see quite a few monthly candles produce in the coming months so in this cycle over here it was 1 2 3 4 5 6 7 8 nine months worth of upside in this cycle in 2020 2021 we saw 1 2 3 4 5 6 7 8 9 10 11 12 so here we saw 9 months of upside here we saw 12 months of upside and this is month one so if
we're talking about nine months of upside 12 months of upside this is month one out of a possible nine at the least or a possible 12 at most and it just goes to show how early we are on this parabolic phase of the cycle it really will be quite a few months before we start to even consider a peaking in bitcoin's price action this orange circle just really represents where we are right now and it's still very early stages and when we talk about when this breakout to new alltime highs and the parabolic phase of
the cycle when it begins there's always a certain amount of time after the harving where that occurs and you can see here that we really broke out right on time really if we compare this portion of price action in 2021 and this portion of price action look how that perfectly really mirrors this breakout and if we do the same thing in 2017 you can see that 2017 that took a little bit longer maybe month or two longer to break out after the harving into the parabolic phase of the cycle but nonetheless history doesn't have to
technically repeat itself picture perfectly but it does often rhyme and the rhyming has been impeccable in this cycle where we broke out from this macro downtrend to enter the new uptrend to new alltime highs same thing in this cycle as well breaking that downtrend rallying post harving to new all time har and same thing here so we're seeing a repetition of these cycles and it's incredible to see that really and the same thing goes for when we bought him prior to the Haring so let's start off perhaps with this cycle right over here when we
bought him prior to the Haring it takes roughly the same amount for us to then later peak in the bull market which is really fascinating to see these sort of Tendencies repeat you you can see the same thing here bare Market bottom before the Haring and then we Peak roughly the same amount of time after the Haring and that's the beauty of this cyclicality that we see in bitcoin's price action because the same thing happens here bare Market button before the harving and then we see the same sort of upside and then of course Picture
Perfect uh shape of this rectangle which we can essentially copy paste from preh Haring to post Haring and then we come up with a bull market Peak so you can just see how we've already seen this amount of price action or at least this amount of months take place and in fact we have the same amount of time at least for us to enjoy the parabolic phase of the cycle and then some until we finally peak in the in the cycle so it's pretty phenomenal to see how we can see this this cyclicality to better
understand this parabolic phase of the cycle in a lot of detail and just on the note of that parabolic upside and how we tend to see the cyclicality in full View and full force in mid October of 2023 I spoke about how Bitcoin tends to break to new all-time highs 214 days after having and based on this we could see a new alltime high in November 2024 of course I didn't foresee that we'd see a new alltime high in the preh Haring period that's something that maybe nobody could foresee but when it comes for that
that new all-time high after the Haring in November 2024 then you then you guessed it it just repeated perfectly 214 days after having we broke to new time highs and it's phenomenal to see that that happens in every single cycle that we break to new alltime highs 214 days after the harving it's that cyclicality that is absolutely incredible whereby 24 days after having in three Cycles now we've seen without fail 214 days after having a new alltime high and kickstarting essentially the parabolic phase on the cycle with these black circles right over here we then
see fantastic upside for the remainder of the parabolic upside phase but we have to understand that in the future we're going to have to consider a bare Market taking place that is natural part and parcel of any cycle we see absolute phenomenal parabolic ball runs take place but then we see a yearlong bare Market take place and if you just do this as well what we've been doing throughout the whole video copy pasting really these bare Cycles or bull cycles it's really copy paste in terms of bull market Peak to Bare Market bottom you can
see the absolute same take place in this cycle right over here which is which is absolutely phenomenal isn't it we can see the same thing in this cycle as well and that's because every bare Market tends to last a Year's worth of time so if this was 2022 this was 20 2018 and this was 2014 you can notice that each of these years is separated by four years worth of time so that naturally means that in 2022 long still way ahead or at least in 2026 apologies we're going to see a bare Market take place
so 2024 is going to be phenomenal of course we're already seeing that but we're going to see this parabolic upside take place deep into 2025 and then we're going to have to consider a bare Market coming after 2025 the majority of which is going to play out in 2026 but of course that bare Market is probably going to begin deep in 2025 as well just notice how the bare Market takes place a few handful of a handful of months before the bare Market year triggers and you can see that 2017 December 2017 is the bull
market Peak and then bare Market beginning in 2013 December 2013 as well is that bare Market Peak and in 2021 November is where we saw that bull market peak in the beginning of the bare market so just looking at that we can notice that the bull market Peak and bare Market beginning could take place at the latest in November December 2025 there is reason to believe it could occur a little bit earlier but at most history is suggesting to us that we should really be out of the market by November December 2025 that's just the
reality of the cycles and I've just spoken so much about these Cycles in this video already that we tend to see just picture perfect replication of old cycles and we mustn't ignore some of the tendencies that we tend to see in previous Cycles when it comes to understanding where could we Peak and where could we could actually see the bare Market take place and start to really progress with downside the last portion of the cycle that I really didn't talk about is the preh Haring period the bare Market bottom and then the transition into an
accumulation phase and then a preh Haring rally we tend to see that in every cycle it takes different shapes and forms but this is generally that sort of macro accumulation year whereby we tend to accumulate a little bit at the bare Market bottom reaccumulate and sideways movements in this region and then rally going into the Haring but that's the past that's looking too far into the future what we need to focus on is the parabolic phase of the cycle we've which we've only just begun and enjoy the fruits of our work that we've been putting
in over the past several months and for me personally past several years in fact so if you want to stay a breast of all of these different moves of the Cycles how they progress how we should navigate them going forward and how to make the most of this parabolic phase in the cycle feel free to subscribe to the YouTube channel here and I'll be happy to share all these videos all these insights with you in a lot of detail going forward so if you enjoyed this video subscribe to the YouTube channel like this video if
you enjoy content like this going forward I'm re Capital thanks so much for tuning in and I'll speak to you in the next one speak to you soon