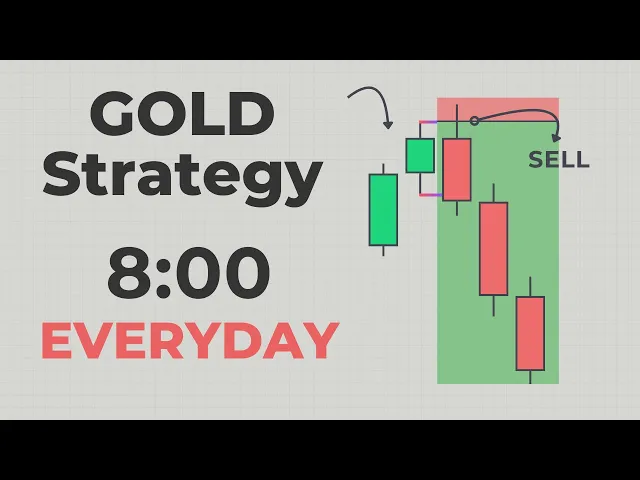
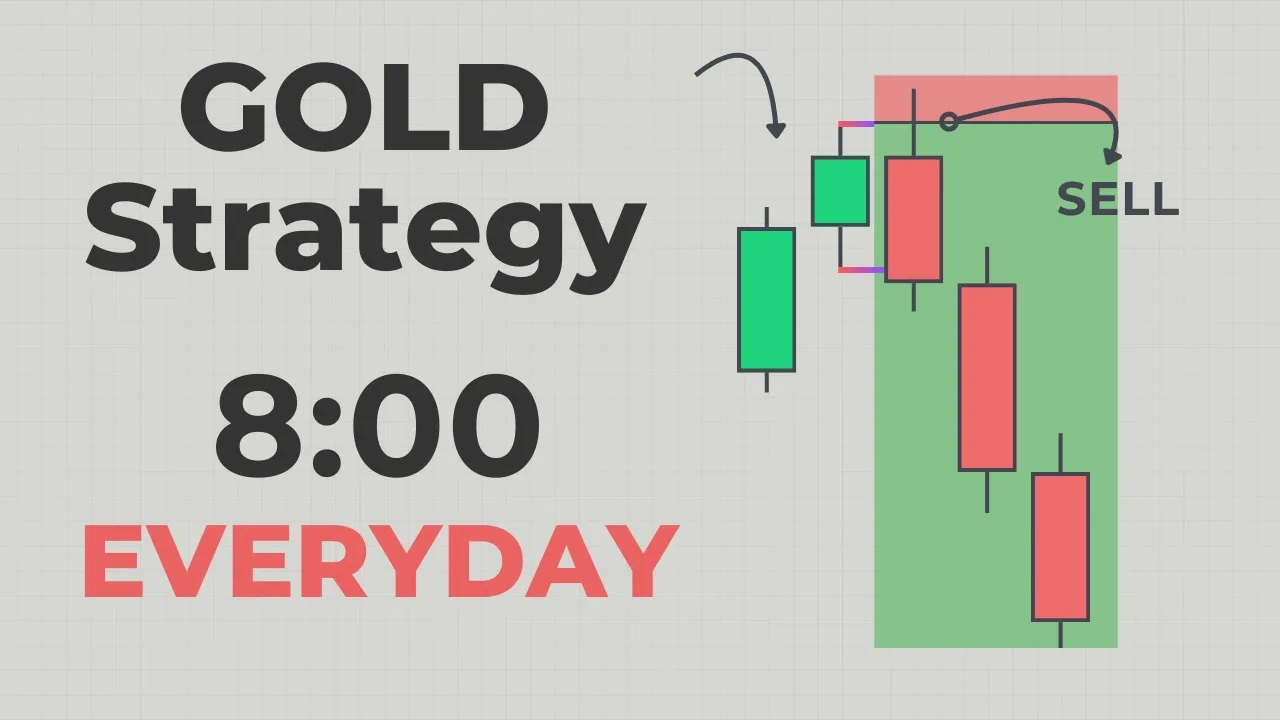
what if one single candle in gold holds the key to profitable trading In this video I'm sharing my strategy focused entirely on the specific candle which appears almost every day at the same time If you keep losing when trading gold watch this video through to the end I genuinely believe it could completely change your approach Let's dive in Now the setup will be around one candle almost every day and it happens at a specific time If you notice this is the hourly chart of gold If you notice this candle in red or pink this is the candle that we'll be trading around Now if you notice that around this candle almost the side of the breakout is the bias for the day Now it could be a short term like for a few hours or for uh one 4hour candle sometime it could be for the whole day As an example if you see this day here um the moment we break below or we will be finding an entry here but the moment we close below we started pushing lower the retracement and then pushing lower For this day it was a little bit different There was a reversal scenario here So we will go through it Uh same thing here reversal and then you see after after the reversal we're going to be discussing all of this We started going up and same thing here reversal Now for this one we only lasted for one candle or on two candles but this one is going to give you at least one to one or maybe if you have a precise entry you could get 2 to one from this And you see this one here we started pushing all the way up and sometime you'll be catching the low of the week or the low of the day and sometime the low of the month using this However we're going to be focusing on catching you know one to one 2:1 and then letting you know the rest of the position run uh by itself Maybe you're going to hold for a day maybe for a week But the whole premise is that we'll be focusing on one candle happening at the same time almost every day Now let's remember one thing that a candle is nothing but a range on a lower time frame And it goes the opposite way So a range if you focus or if you look at a range in time frame and then you go to a higher time frame you can see this as a candle Now it could be an ideal range like this or it could be something like this but it's still a range All right so that is not an invention that is not something new Uh some people call this a theory when in reality just a common sense All right so a candle is a range and that is you know range is liquidity We're going to be focusing on these key levels the high and the low of the candle and that is also the high and the low of the range The moment we see price going around these levels we're going to be executing our trade Remember that price is fractal So a range is nothing but a candle on a higher time frame And same thing a candle is nothing but a range on a lower time frame Now as I said the strategy will be around one candle And this specific candle the timing for it is 8:00 p. m EST So this is the hourly candle that we're going to be focusing on It could be a bearish candle It could be a bullish candle In a bearish candle we could go long or we could go short And same thing here In a bullish one we could go long and we could go short So the color of a candle does not matter much but what matters the most and it's more significant is where the candle at and what happened on the next candle So talking about the direction and entry we could have a continuation scenario we could have a reversal scenario in a lot of times um I keep saying that continuations are better and they give you um high reward to risk and high win rate However in this case or in this specific strategy I would say that reversals are actually easy It's not easy but it's more rewarding It's higher reward to risk And in my opinion it's easier At least I know where to set my stop loss because the manipulation already happened But continuations are also you know high probability Actually higher win rate here Now for a continuation this is the 8:00 p. m hourly candle What I'm looking for is you know let's say this is a bullish candle We're going to be looking for longs especially if the 8mm candle is at a key level After that we'd be looking for the continuation of the next candle which is the 900 p.
m candle Now I'm not going to go over the details you know the exact details as a full trading plan This is going to be again an inspiration an eye openener something that you could implement to your strategy Now you see this candle here going up This is the candle that we're going to be entering at mostly If you watch my candle continuity theory the CCT you're going to know that we can enter here Actually you can enter here with a risky entry or you could enter after the breakout and then continue higher Same thing in a bearish scenario after the breakout here stop loss above the wick and then look for the continuation or a risky entry around this level Now what I want to focus on on this video is just you know the importance and significance of the 8mm candle How you can look for continuation how it can give you a bias for the day breaking above and then closing above most likely going up especially again if the 20 or the 8 p. m candle is at a key level Now for the reversal and in my opinion at least for me this is easier to spot and this is easier to trade and it's more rewarding So you could have a higher reward to risk You could catch a lot of times the low of the day This one most of the time is the I would say the low or the high of the day And I'll show you examples on the previous two days or the previous three days And you're going to see how this is working out Now for the reversal it could be a bullish candle going up or it could be a bearish candle It does not matter But you see we're going up Maybe we're at a key level All right And that is just an extra thing to look at And if you're using this or if you're implementing this concept to your current uh strategy then you should do this already Hourly 8 p. m candle This candle here this is the opening price of this candle All right And this is the closing price So closing price opening price The moment we open we started going up We don't create a wick You see here what happened here is first thing we create a wick and then we push higher In this scenario here what happened is the opposite We started going higher first to create the higher wick and this is a reversal profile So we get a sweep here You can enter immediately here Now this is hourly You could look for one minute or five minute entry here The sweep pushing lower Then we can also take a continuation trade here Same thing in a bullish scenario We have a bearish candle Now it could be also a bullish candle Again could be a bullish candle and then we sweep the low of it What happened here is this is the closing price of this candle and this is the opening price What happened is immediately starting going lower sweeping previous candle low And this candle here is what It's a range right So it has a lot of liquidity on a one minute time frame You could also look for a one minute entry or five minute entry What happened here is sweep going up And I do have a lot of confluences that I apply to this A lot of things that tells me how high probability or low probability this setup is But these are things that I'm we're going to be discussing in another video This video is just about you know the main idea or just the tip of the iceberg This next candle here So you see how we close bullish here Now what do we have Continuation We can enter here or at the breakout and then continue higher Mostly after this manipulation this becomes a very high probability one So we have two scenarios continuation or reversal You can try both I would suggest going to your um chart open gold on the hourly and notice the 8mm candle and how price behaves around this candle and what happened on the next candle on the 9:00 p.
m based on what happened on that candle You will see how price moves for the whole day Now again this video only offers insights to improve your strategy or a concept to blend and implement to your strategy I would like to see your comments below if you want a complete guide around the same strategy So if you want a full guide then let me know in the comments Let's go over the examples Now we're going to go to trading view and show you how price behaves around that candle and give you a proof on what was happening the previous 3 days or 4 days and I'll show you that this actually works Okay so this is the hourly chart The first step that you want to do is go to the indicators tab and apply this indicator to the chart So it's Asian session range This is the one that I'm using and just look up on YouTube Mullham Trading Indicators and you'll see a full tutorial and the exact settings that I'm having on this indicator So you could have the same indicator as me So this on blue is the Asian session range and that is the one that we're going to be focusing on All right So you see how the start of age is what 20 or 8:00 p. m That is the one that we're going to be focusing on Now if you want another indicator that will just show you this candle here you could have this one highlight candles by time Look it up You're going to see that it just highlight that 8:00 p. m candle All right So now we have this indicator here I want to show you you know for the previous days how price behaves around this specific candle Now you see here for this day this is today this is happening now we can see that this candle is uh 8 p.
m If I put it in a rectangle I'm going to see that price opens immediately to the lower side I mean it creates a wick to the upside Yeah But it does not break above The first thing we did is going lower in a continuation scenario What we want to see is creating a wick and then go higher Right What happened here instead is a bullish candle but we started going lower We were creating a wick but what happened is a sweep of the low So what happened here is the sweep of the low All right So we took the low Now you can look for a reversal and look at where price is reacting All right So you see that is a key level here price reacted to that key level going higher That is a setup by itself Now if you go to the one minute time frame and focus on what happened here you see how this is the 8:00 p. m This is 8 p.